Tue 23-04-2019
Hi everyone, hope you are all ok and had an awesome Easter break...
Back to business...
USDJPY
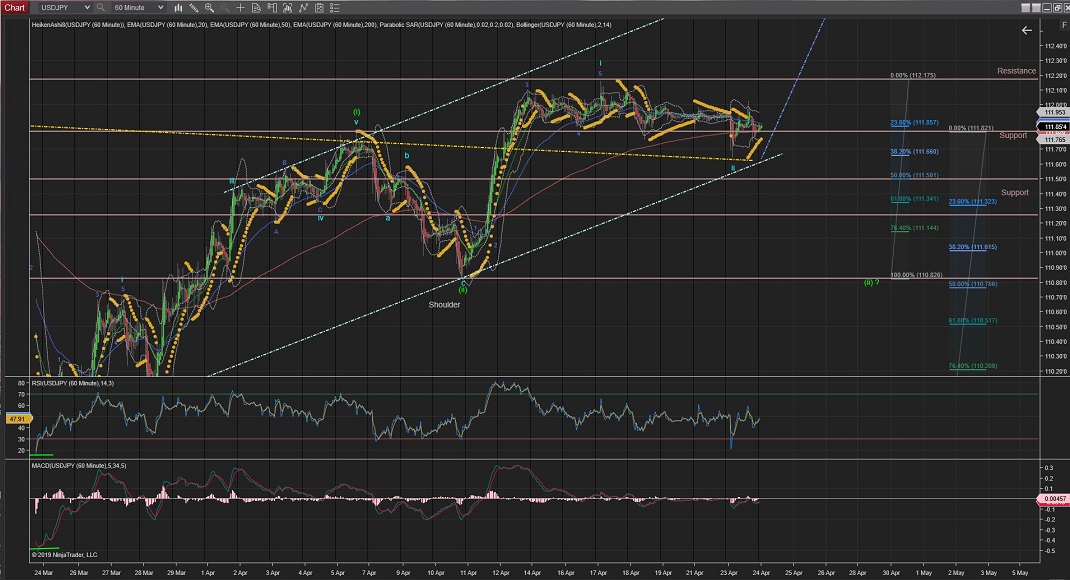
USDJPY Wave ii has touched the lower trend line (light-blue) to what it could be its completion.
Which would mean a %38 retrace of Wave i on a move back towards the Head & Shoulder Neckline (yellow).
There is a lot of attention on this Head & Shoulder formation and once it breaks through, if this count is correct it will be a long run for Wave ii of (iii) of [iii] upwards.
Next: an impulsive move across the highest of Wave i at 112.16 would confirm Wave iii underway.
60Mins
4Hours
Daily
Weekly
USDCAD
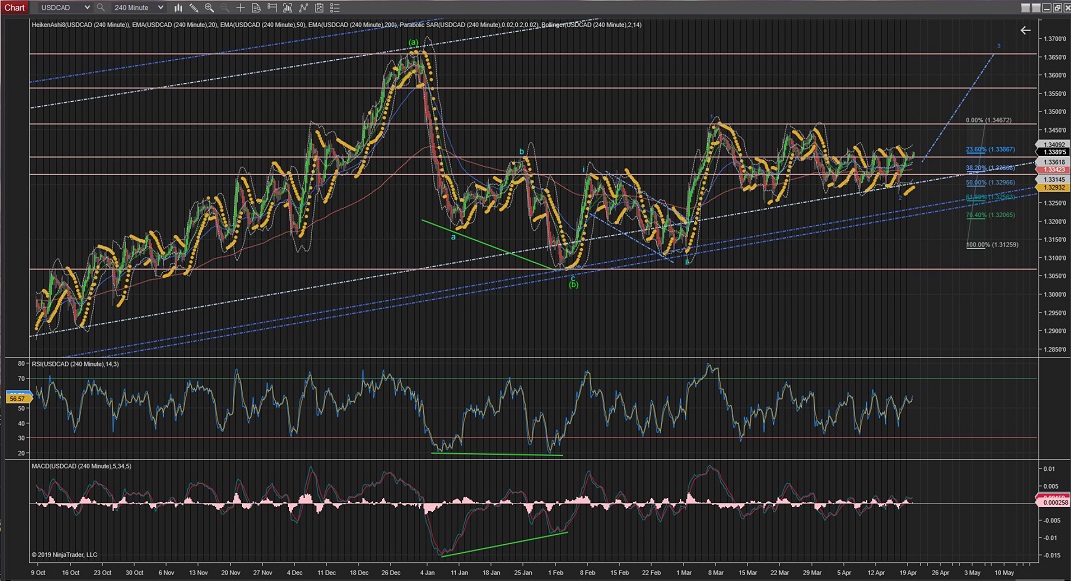
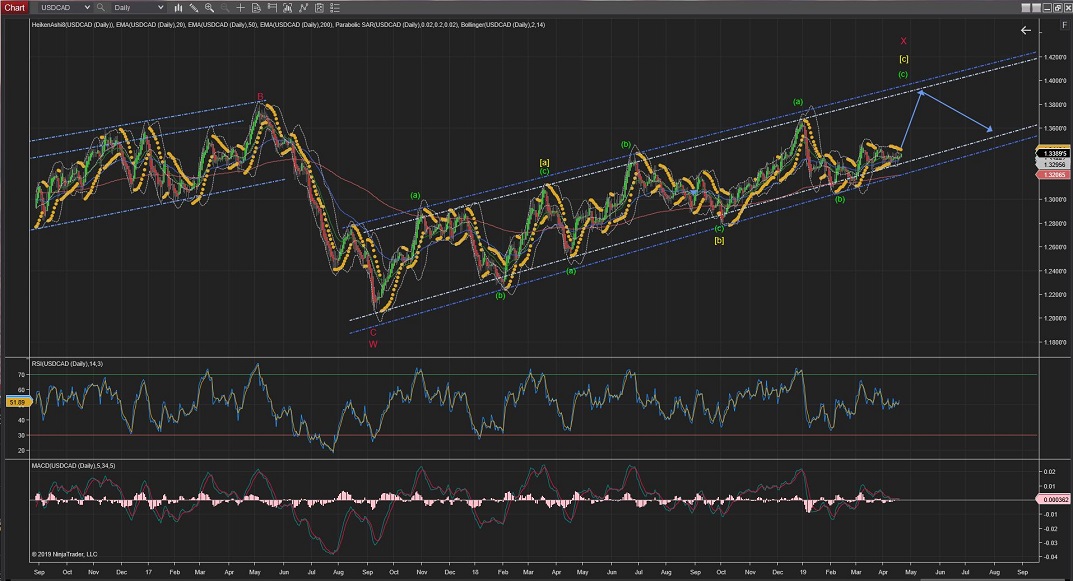
USDCAD I have been expecting Wave (iii) to start gaining momentum and cross the highest of previous Wave (i) and maybe today's impulsive move to the upside is the initial wave and the prices will continue raising further up impulsively.
Wave (iii) will be confirmed when it crosses the highest of Wave (i) at 1.3450 and carries the price higher.
Next: expect a small correction for Wave (ii) to develop in three Waves down before Wave (iii) continues its way across resistances at the 1.3450 area.
60Mins
4Hours
Daily
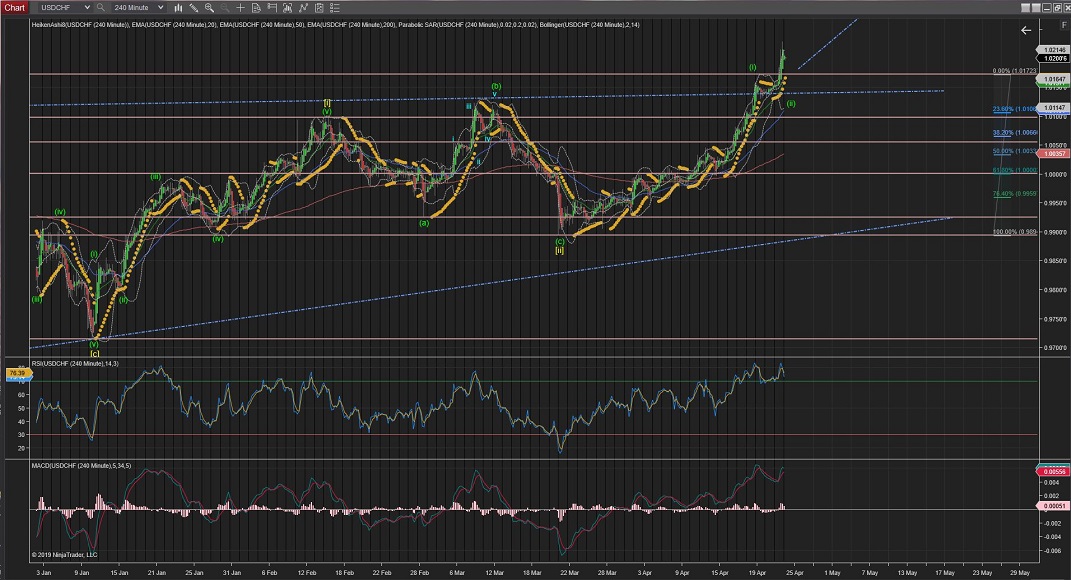
USDCHF
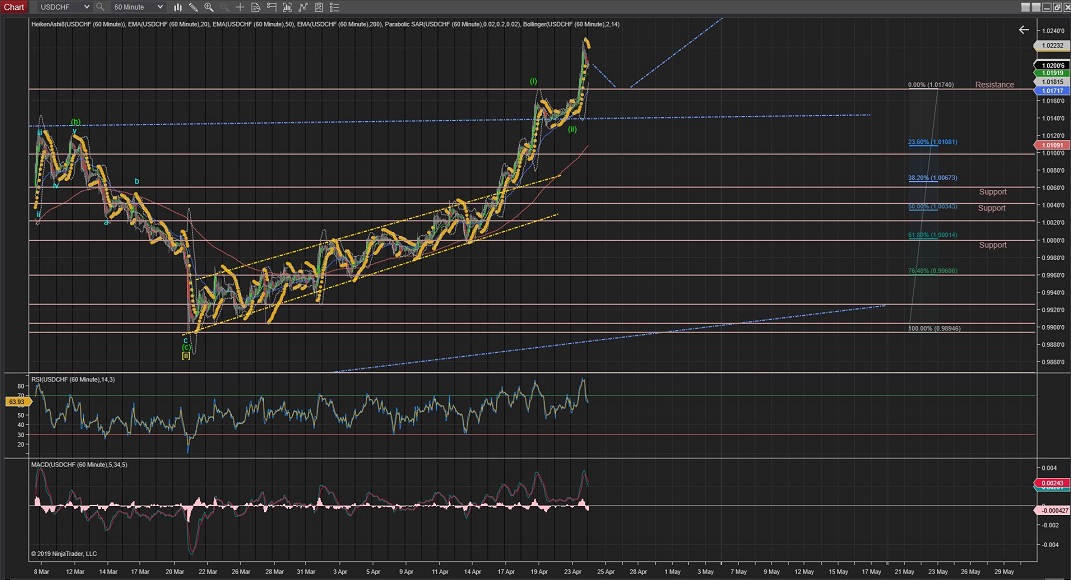
USDCHF has finally reached, and crossed the upper trend confirming Wave [iii] started (best pictured on the Daily Chart).
I can still not distinguish 5 clear Waves that follow the Elliot terms for Wave (i) but nevertheless the move has proved to be the start of Wave [iii] and has picked up momentum to break out of the long term triangle shown on the Daily chart.
In the hourly chart, the best that I can make for a Wave (i) and Wave (ii) correction is at the point of crossing the upper trend (blue).
I would expect another small correction towards the trend again but Wave [iii] has already confirmed to be on the way up; and it has a long way to match the length of Wave [i].
60Mins
4Hours
Daily
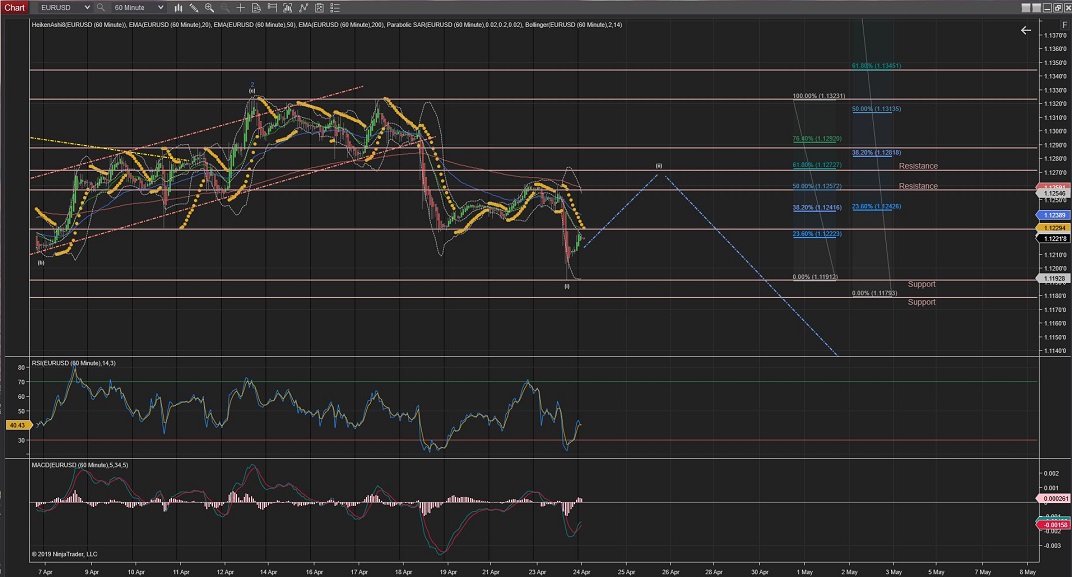
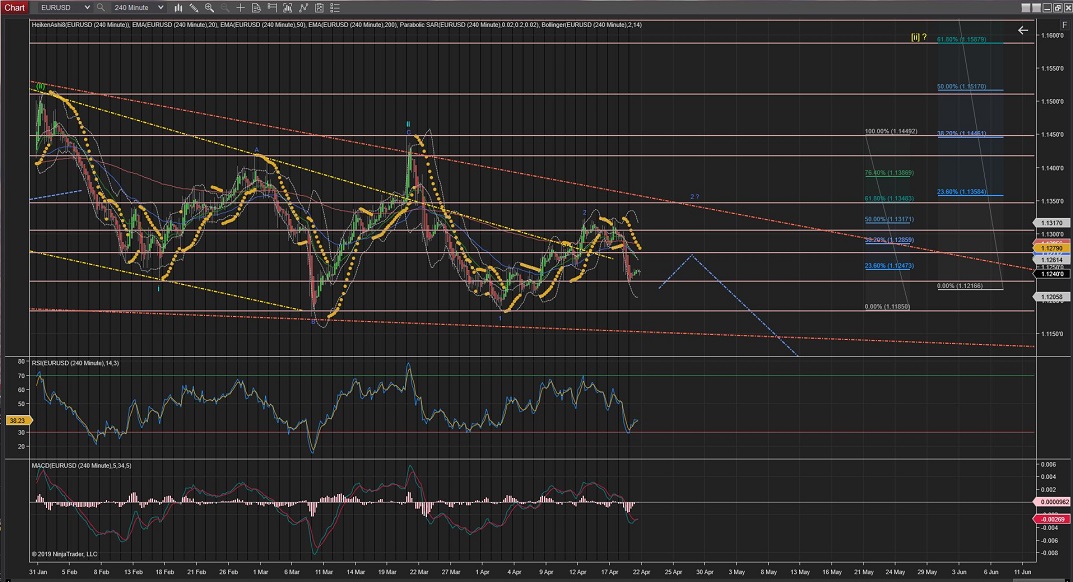
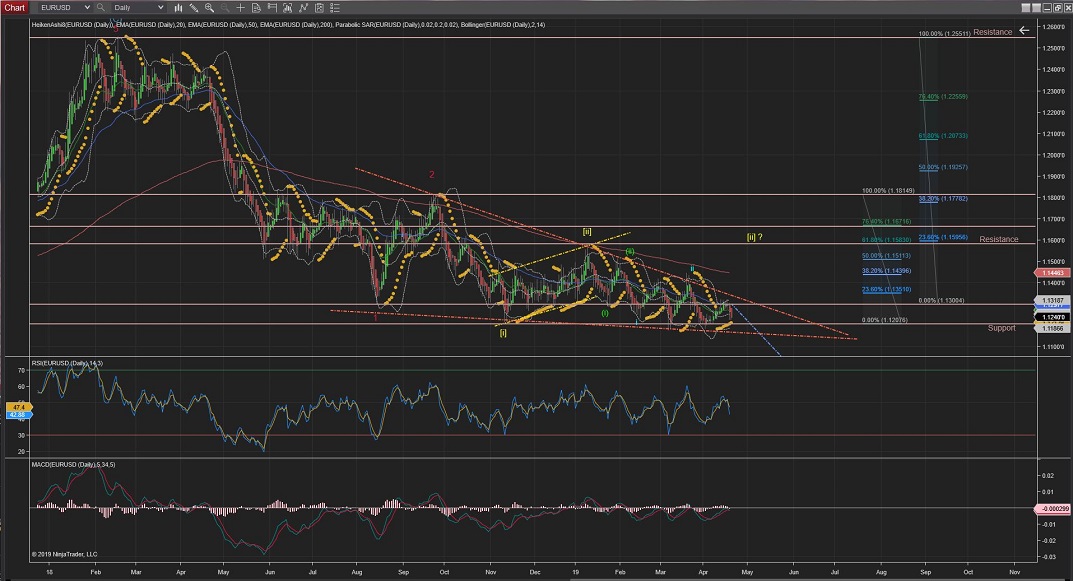
EURUSD
EURUSD Completed the 5 internal waves of Wave (i) of Wave 3(blue) to the downside at 1.1191.
Wave (ii) is now taking place to retrace back, possibly %50 or %62 towards the 1.1250 or 1.1270 resistance areas.
Once Wave (ii) is completed we should see the impulsive waves to the downside to continue to the downside and the possibility of a good opportunity for a low-risk entry.
60Mins
4Hours
Daily
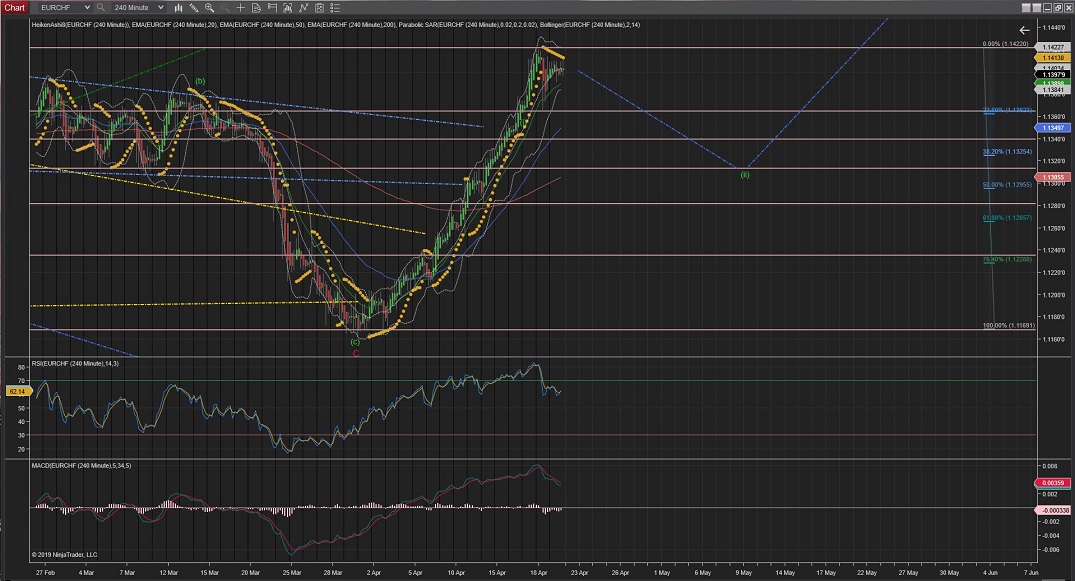
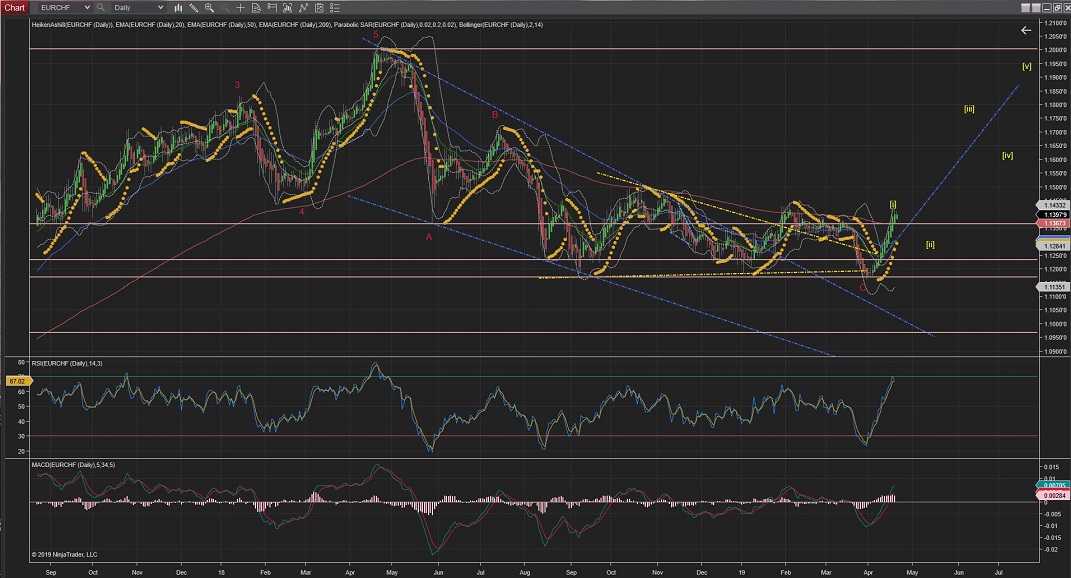
EURCHF
EURCHF has extended Wave v today until 1.1380 to complete Wave (i) at 1.1420 area.
Next, Wave (ii) should carry the price lower towards support levels, possibly developing an expanded flat correction (3,3,5) towards the %23 retracement at 1.1360 area.
After the correction, Wave (iii) should continue taking the price extensively higher on the break out to the upside.
60Mins
4Hours
Daily
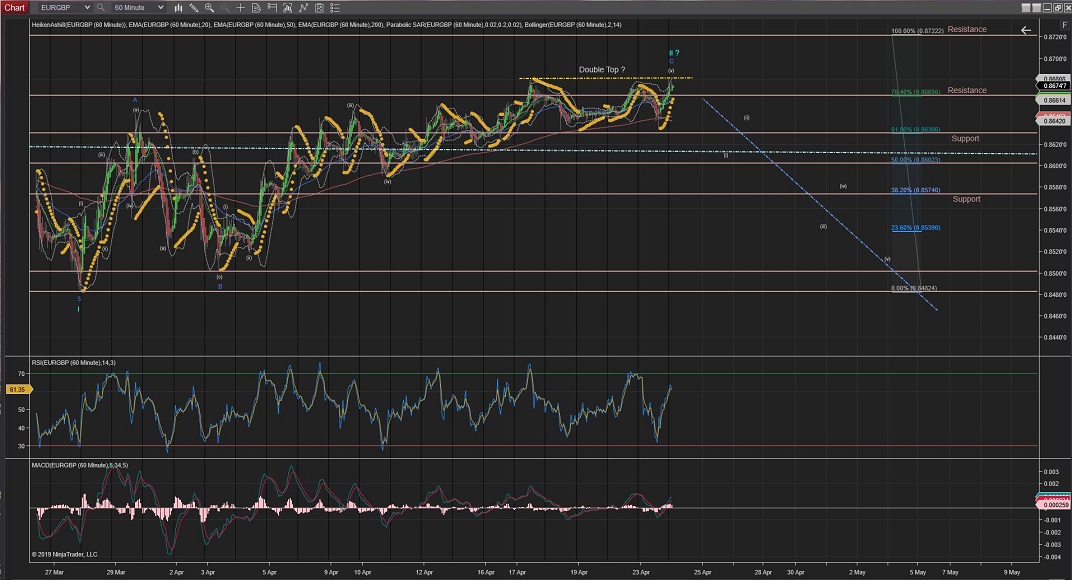
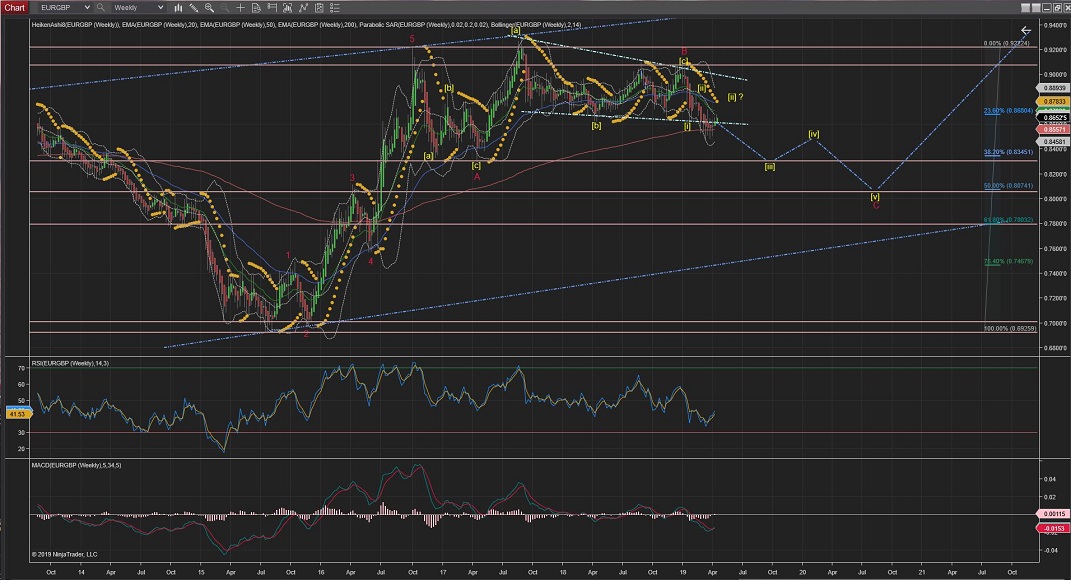
EURGBP
EURGBP is been moving in a corrective manner for a while on Wave ii and again today could have been completed at the %76 retracement of Wave i to what appears to be a double top.
Note: There is potential for an extended Wave (ii) as an alternative count and the daily chart also shows an alternative count for a larger Wave [ii] to extend further.
As for the current count; If correct, Wave 3 should start the impulsive waves down, once Wave ii completes, taking the price below the lowest of Wave 1 at 0.8500.
60Mins
4Hours
Daily
Weekly
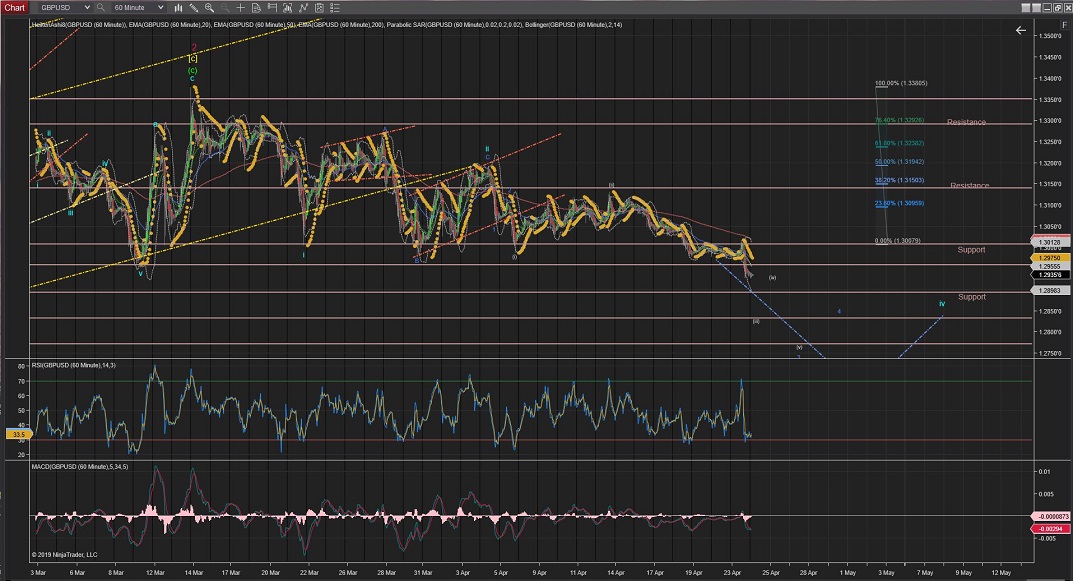
GBPUSD
GBPUSD is been moving slowly downwards but undecisively to what might be Wave (iii) of Wave 3 of iii downwards.
Note: the Daily Chart shows an alternative count for an Extended Wave [c] correction to complete Wave 2(red) at the %50 retracement level (1.3517 area).
As per current count, Wave iii was confirmed as it crossed the lowest of Wave (i) at the 1.3000 level area and should continue lower towards the 1.2750 area.
60Mins
4Hours
Daily
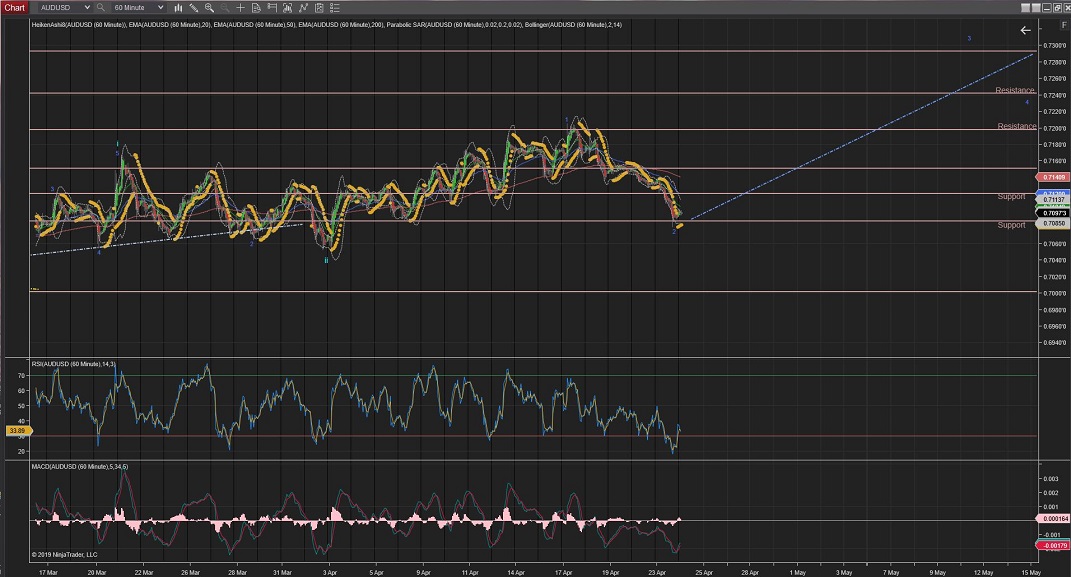
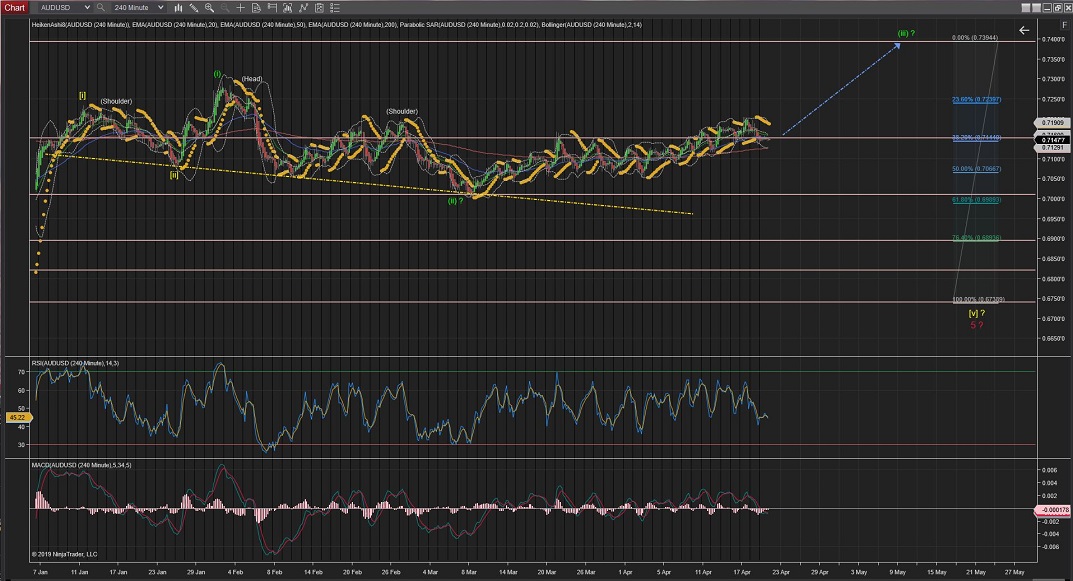
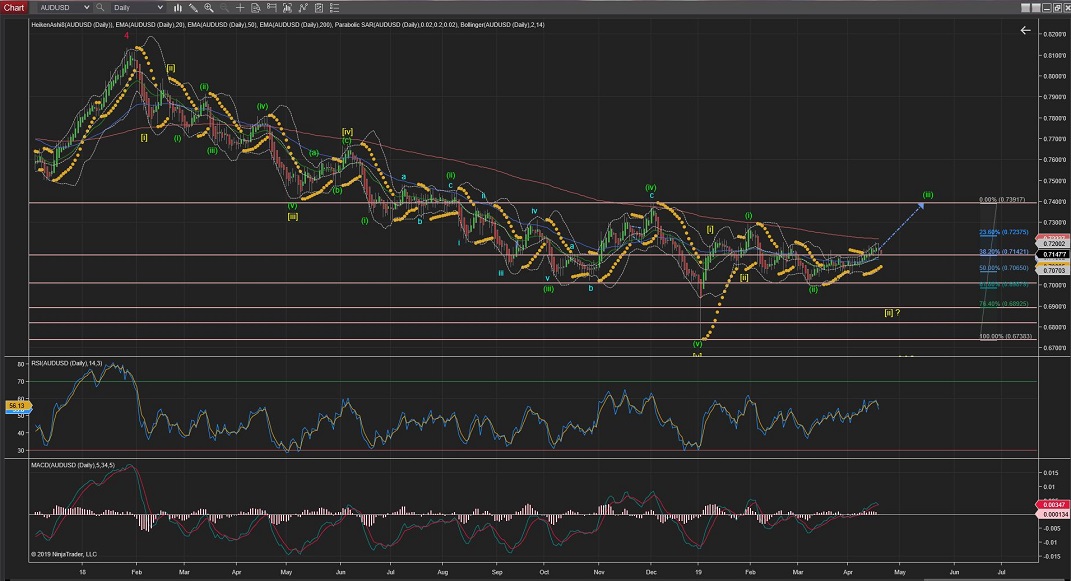
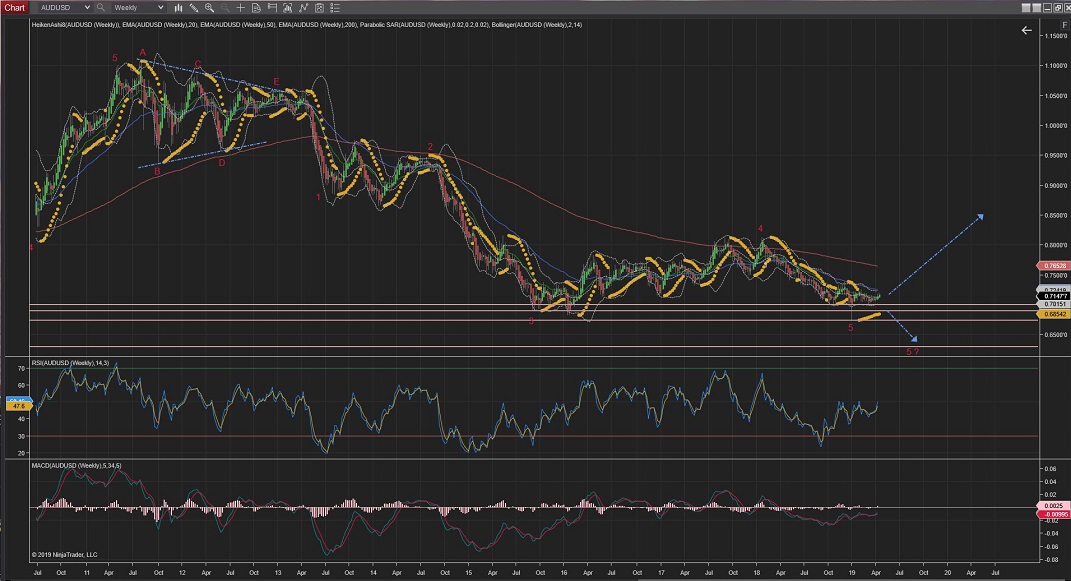
AUDUSD
Daily & 4Hour Charts:
AUDUSD 4Hour Chart is showing the price raising from the neckline of a clear Head & Shoulders pattern which is suggesting Wave (iii) could be finally making its way up.
Still not out of the woods yet, so further moves lower than this neckline would trigger the alternative count for an extended Wave [ii] going towards the %76 levels of support, although it is still possible an extended Wave [v] or even a further extended Wave 5, with not much resistance levels to stop the move down (best seen in the 4Hour and Daily charts) .
Hourly Chart:
Is playing a very awkward and hard to follow series of waves but so far they meet the Elliot Wave principle...
I have modified the 60Min Chart count with the latest price drops; showing now a Wave 2 (blue) correction of its higher degree Wave iii.
Next, Wave 3 should raise in its 5 internal waves up, possibly to the next resistance level around the 0.7300 area.
60Mins
4Hours
Daily
Weekly
All the best for everyone.
Andres


 Trading Waves .org