Wed 17-04-2019
Hi everyone, hope you are all ok.
USDJPY
USDJPY has been and still is moving sideways while going through Wave 4 (blue) of Wave i, and yet to cross the big resistance levels at 112.10.
Once Wave 4 completes, Wave 5 should complete Wave i of (iii) and Wave ii correction lower would take over.
The target for Wave i is to reach the top trend line (light-blue) around the 112.40 to 112.60 area and Wave ii correction to retrace %50 of Wave i back towards the Head & Shoulder Neckline (yellow).
There is a lot of attention on this Head & Shoulder formation and once it breaks through, if this count is correct it will be a long run for Wave (iii) upwards.
60Mins
4Hours
Daily
Weekly
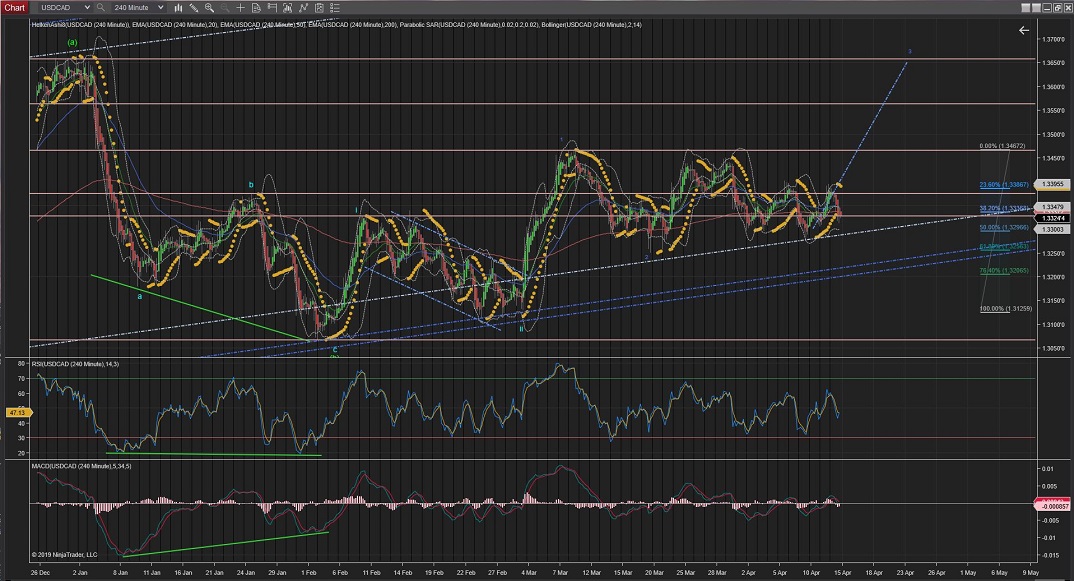
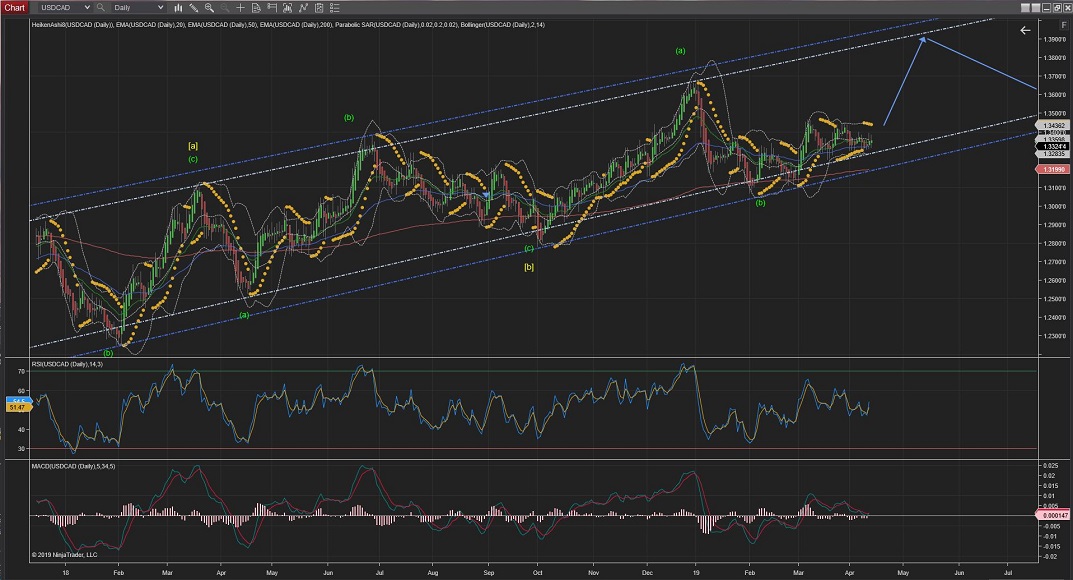
USDCAD
USDCAD correction of Wave (ii) completed at the %76 Fib levels.
Since then it has moved up sideways within a range of roughly 100 pips in a corrective manner for Wave (ii) of Wave 3(blue).
I have been expecting Wave (iii) to start gaining momentum and cross the highest of previous Wave (i) and maybe it is now about to come the end of this correction for the prices to start raising impulsively.
Wave (iii) will be confirmed when it crosses the highest of Wave (i) at 1.3450 and carries the price higher.
60Mins
4Hours
Daily
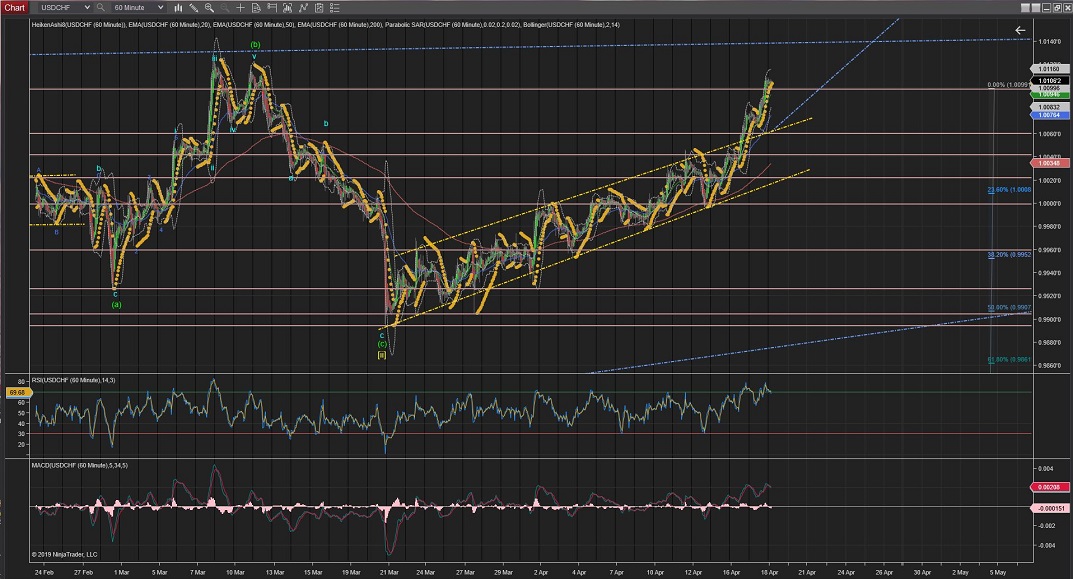
USDCHF
USDCHF has finally breakout of the raising trend to the upside.
I can still not distinguish 5 clear Waves that follow the Elliot terms.
And this leads me to think that this move could still be a complex correction so I count for an extended Wave [ii] as an alternative.
For now, this pair is looking increasingly bullish and, should it break through the upper trendline (blue) it would confirm Wave [iii] is underway.
60Mins
4Hours
Daily
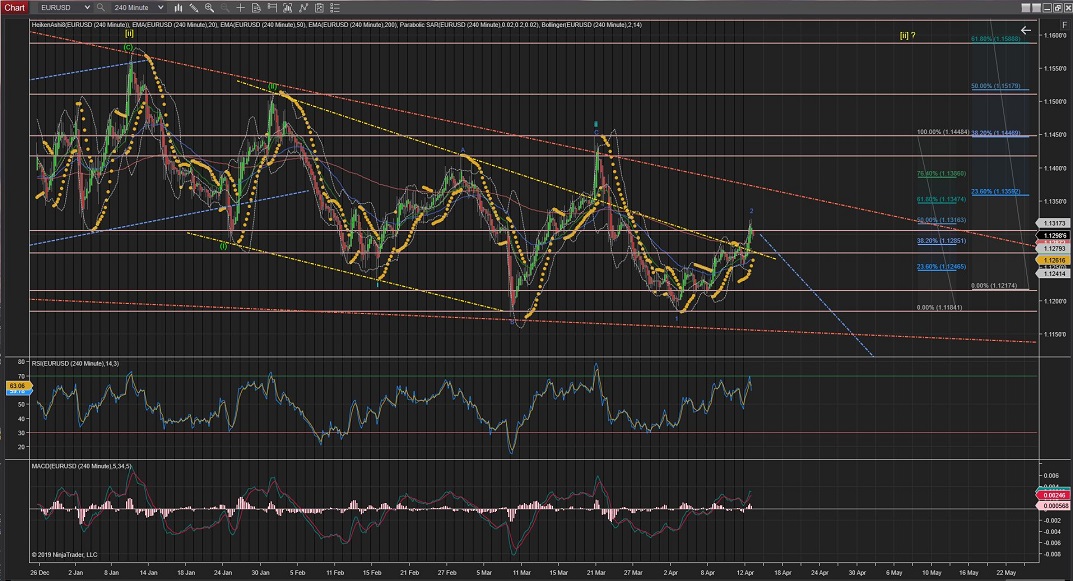
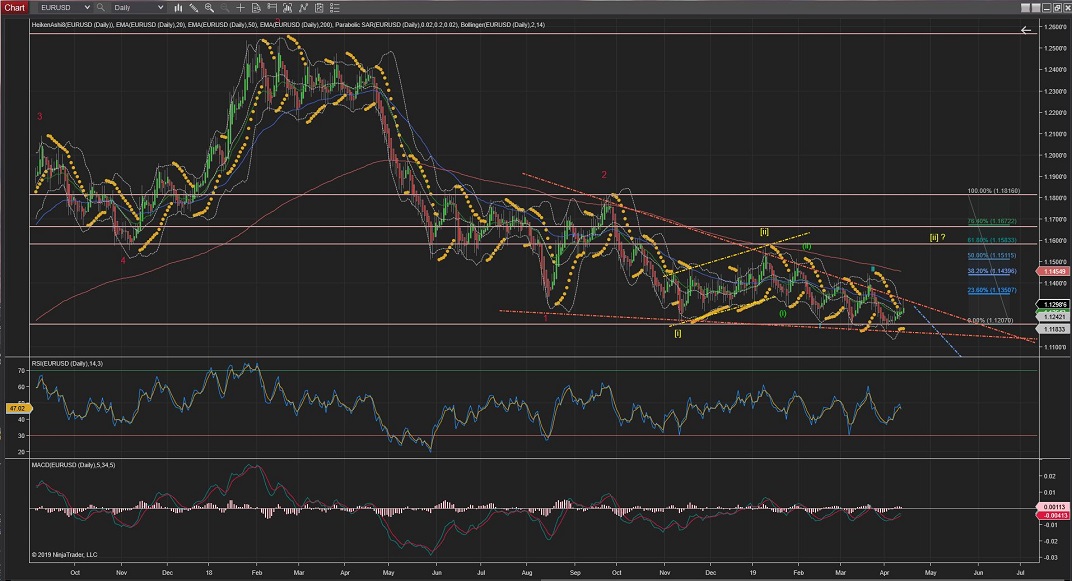
EURUSD
EURUSD made a move for a larger Wave 2 correction and reversed slightly between %62 and %50 retracement of Wave 1.
If the price bounces off the lower trend (red) it will indicate that Wave 2 is still in play and likely heading for the %62 retracement.
Bearing in mind that the alternative count for Wave [ii] to continue to the upside is still present (best seen in the Daily chart).
If it breaks through the lower trend (red) though, it will indicate that Wave 3 of Wave iii is underway for a long decline.
60Mins
4Hours
Daily
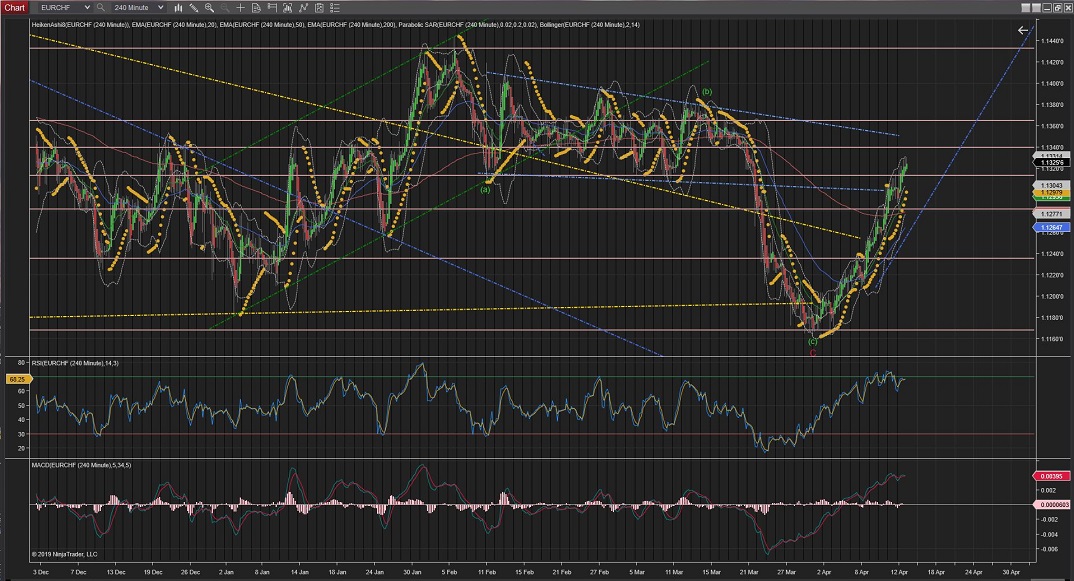
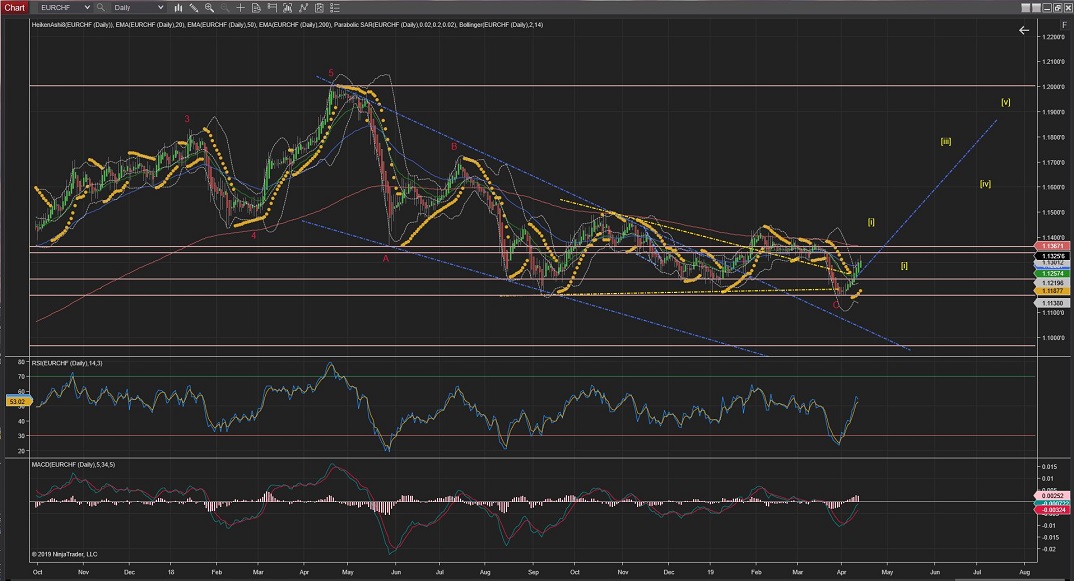
EURCHF
EURCHF has extended Wave v today until 1.1380 to complete Wave (i).
If this is not the end of Wave (i), and Wave v gets extended, the price could find the next resistance at the 1.1383 or 1.1392 area.
Next, Wave (ii) should carry the price lower towards support levels, possibly to the lowest of previous Wave iv (1.1281 - next to %38 retracement), although the next big area of support after that would be around the %50 retracement area (1.1255).
Note how Wave (ii) correction would create a beautiful Cup & Handle pattern for Wave (iii) to take the price extensively higher.
60Mins
4Hours
Daily
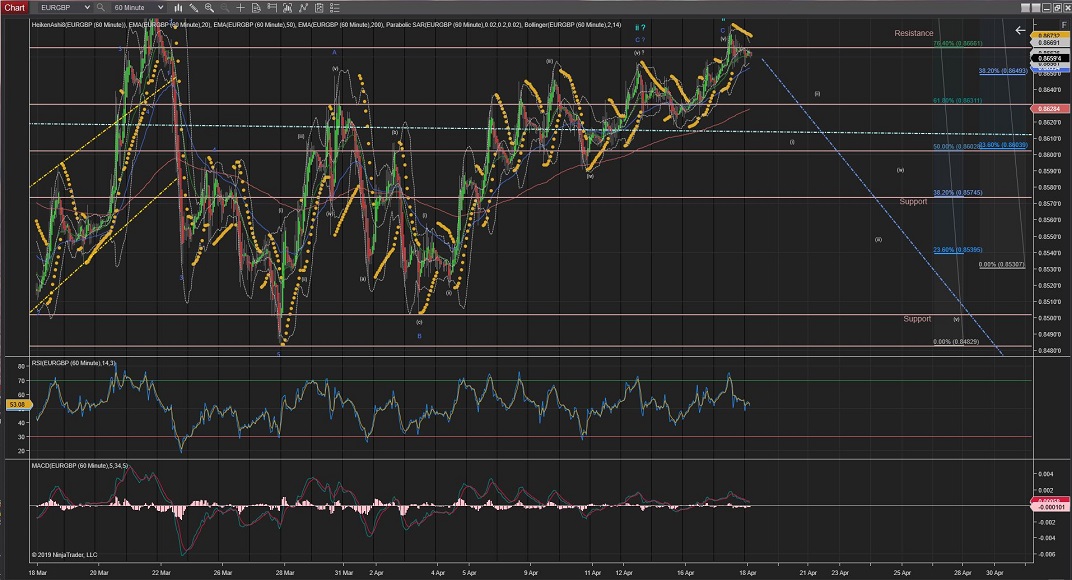
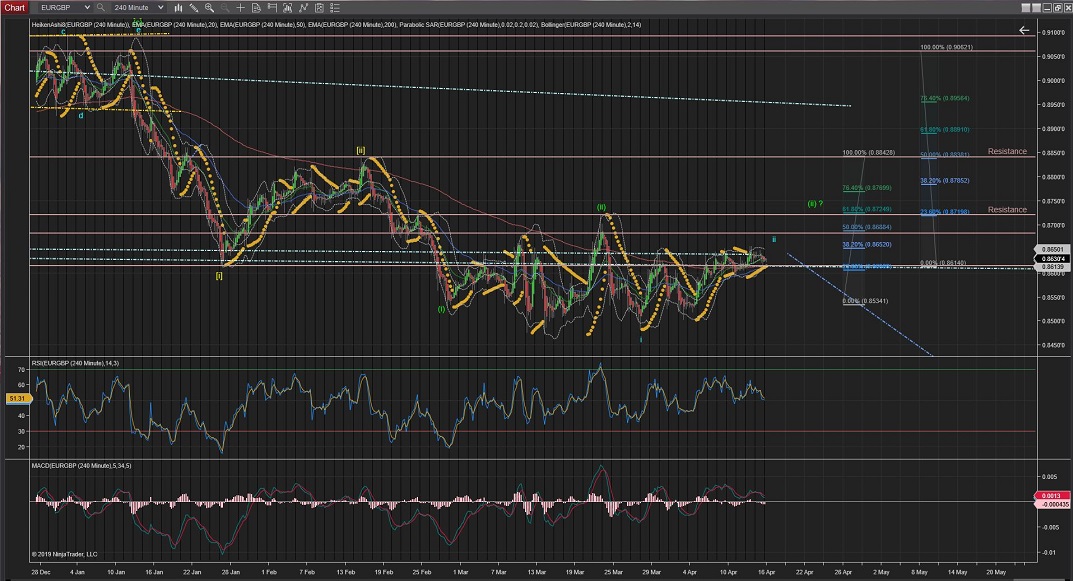
EURGBP
EURGBP is been moving in a corrective manner for a while now and now seems to be extending Wave ii towards the %76 retracement of Wave i, with the last internal 5 waves about to complete at 0.8665 area.
Note: The daily chart also shows an alternative count for a larger Wave [ii] to extend further up to.
As for the current count; If correct, Wave 3 should continue the waves down, once Wave ii completes, taking the price below the lowest of Wave 1 at 0.8500.
60Mins
4Hours
Daily
Weekly
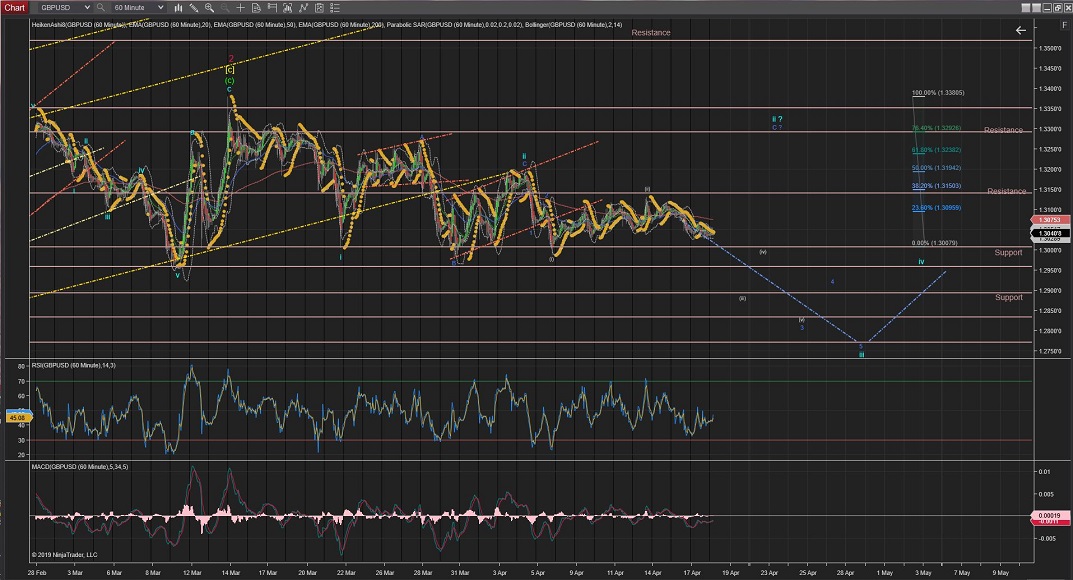
GBPUSD
GBPUSD is been moving sideways undecisevely to what might be Wave (ii) correction of Wave 3 of Wave iii on a downtrend.
Note: if the price crosses higher than the highest of Wave (i) it would trigger the alternative count of a Wave ii to be still in play and price could raise towards resistances at the 1.3300 area again
Also, the Daily Chart shows an alternative count for an Extended Wave [c] correction to complete Wave 2(red) at the %50 retracement level (1.35128 area).
As per current count, Wave iii will be confirmed when/if the price crosses the lowest of Wave (i) at the 1.3000 level area.
60Mins
4Hours
Daily
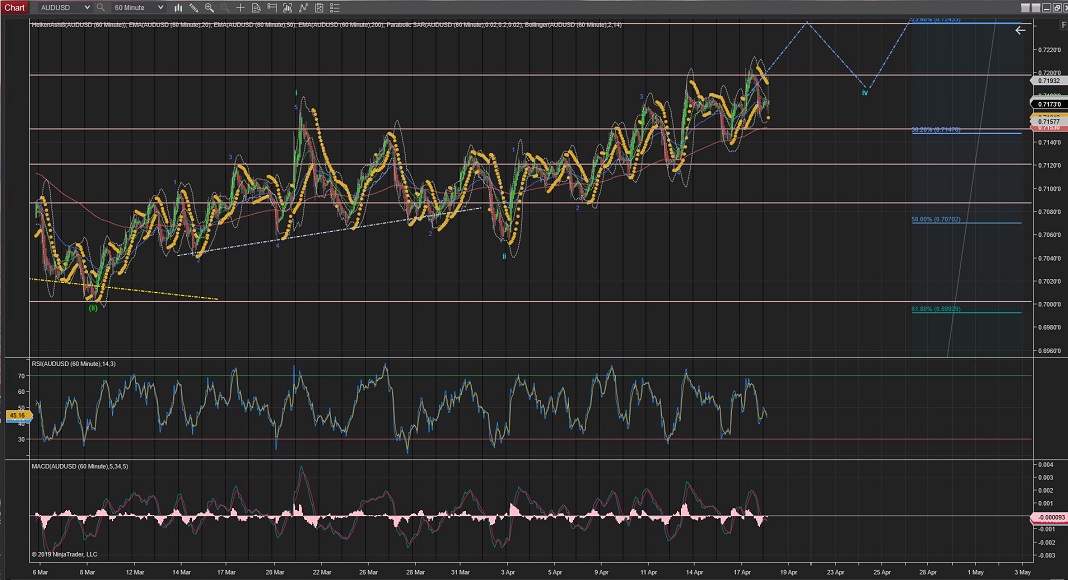
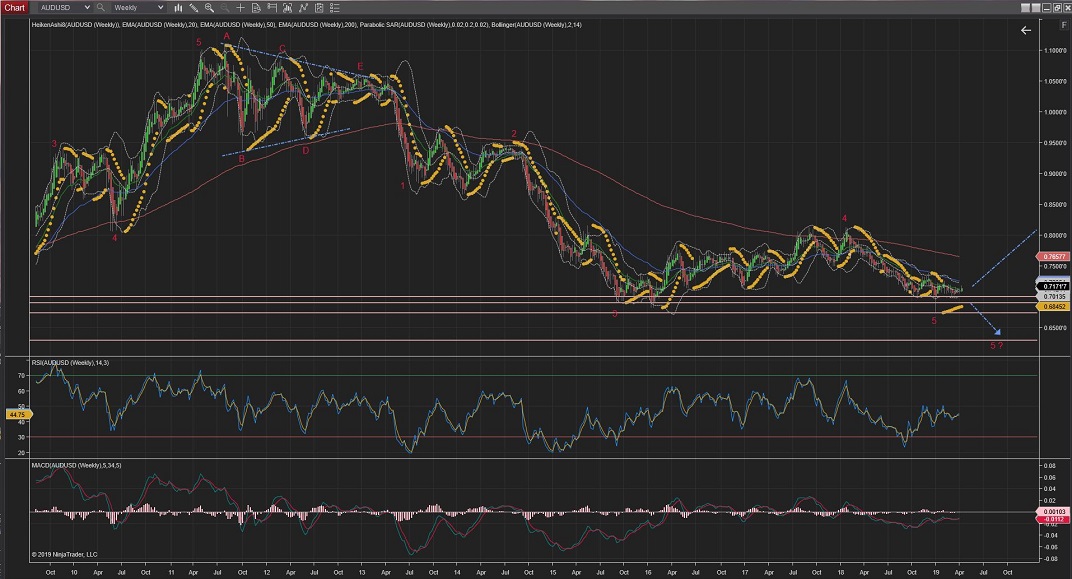
AUDUSD
Daily & 4Hour Charts:
AUDUSD 4Hour Chart is showing the price raising from the neckline of a clear Head & Shoulders pattern which is suggesting Wave (iii) could be finally making its way up.
Still not out of the woods yet, so further moves lower than this neckline would trigger the alternative count for an extended Wave [ii] going towards the %76 levels of support, although it is still possible an extended Wave [v] or even a further extended Wave 5, with not much resistance levels to stop the move down (best seen in the 4Hour and Daily charts) .
Hourly Chart:
Is playing a very awkward and hard to follow series of waves but so far they meet the Elliot Wave principle so...
Next, Wave iii should continue the remaining of its 5 internal waves up, possibly to the next resistance level around the 0.7200 area.
From there, Wave 4 should do another correction in price before Wave 5 takes the price higher to complete Wave iii.
60Mins
4Hours
Daily
Weekly
All the best for everyone.
Andres


 Trading Waves .org