Tue 09-04-2019
Hi everyone, hope you are all ok and had a good start of the week.
USDJPY
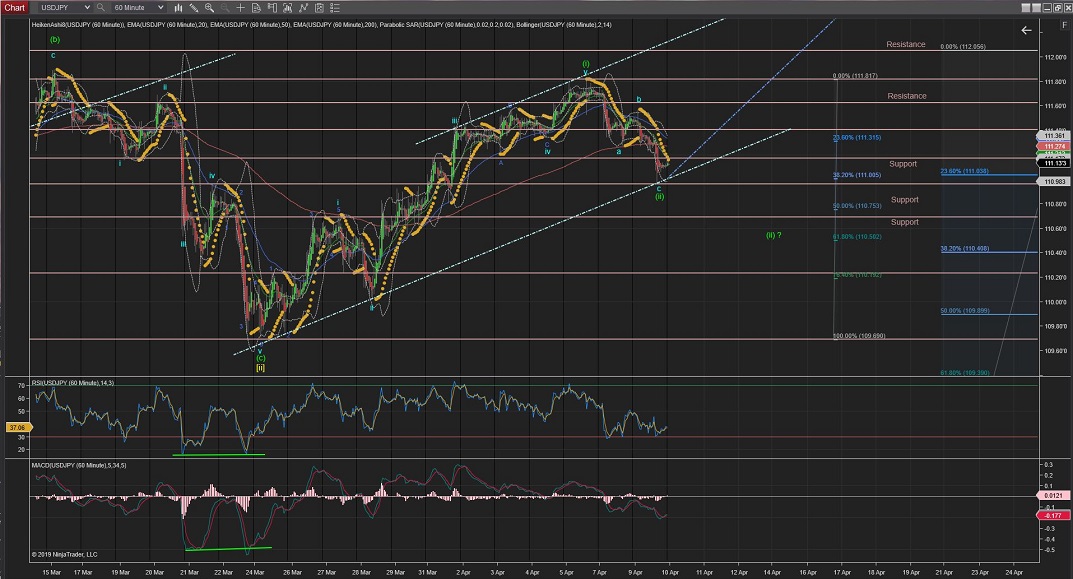
USDJPY Wave (ii) correction reached the %38Fib Retracement of Wave (i) and the price stalled.
Todays lows defined a trend line (light-blue) which could be the turning point for Wave (iii) up.
If the price crosses the trend line the next support level would be between %50 and %62Fib retracement.
Once Wave (ii) is completed we should expect the rise of Wave (iii) (of Wave [iii]) to carry the price up impulsively again.
60Mins
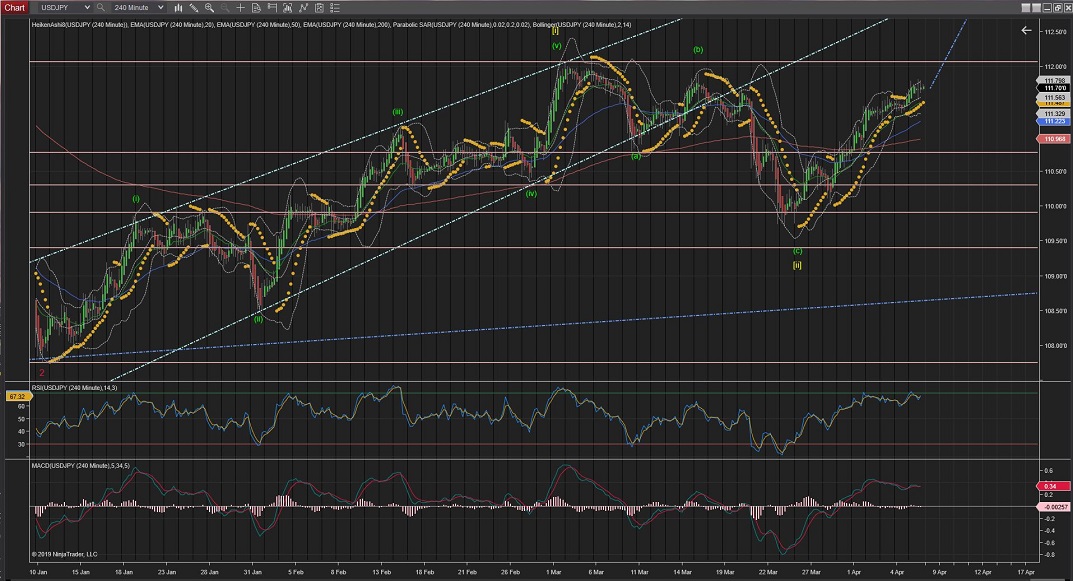
4Hours
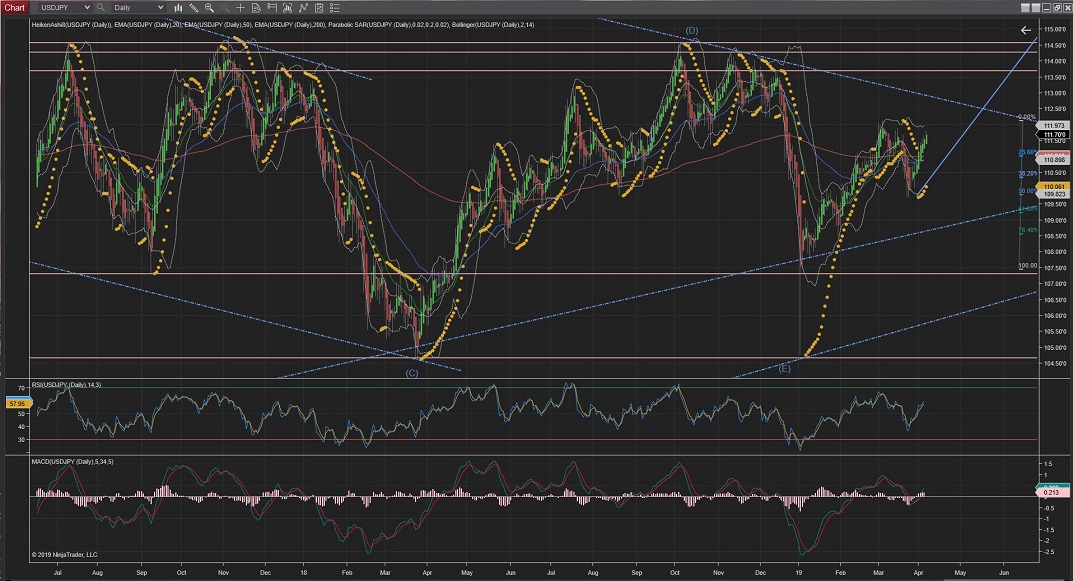
Daily
Weekly
USDCAD
USDCAD correction of Wave (ii) completed at the %76 Fib levels.
Today it has moved up with a slightly impulsive Wave up for a internal Wave (iii) of Wave 3(blue).
Wave (iii) will only be confirmed when it crosses the highest of Wave (i) at 1.3450 and carries the price higher.
At the moment it seems to have developed two internal waves within Wave (iii) on the way up.
There is currently a correction to the downside and should raise up again to continue the trend upwards through Wave (iii) of Wave 3 (blue).
60Mins
4Hours
Daily
USDCHF
USDCHF brokeout of the triangle to the upside and stopped at the first resistance at 0.9995.
Since then, it has moved sideways for the past several sessions.
If the price carries on upwards in the form of 5 waves it will indicate that Wave c of Wave (c) of Wave [ii] has been already completed and this is the start of the series of waves for Wave [iii].
If the price drops lower again towards the lower trend (blue), the current count would still be valid for an extended Wave c.
Regardless of the starting point for the raise, on the long term, the price is bound to raise impulsively for Wave [iii] .
60Mins
4Hours
Daily
EURUSD
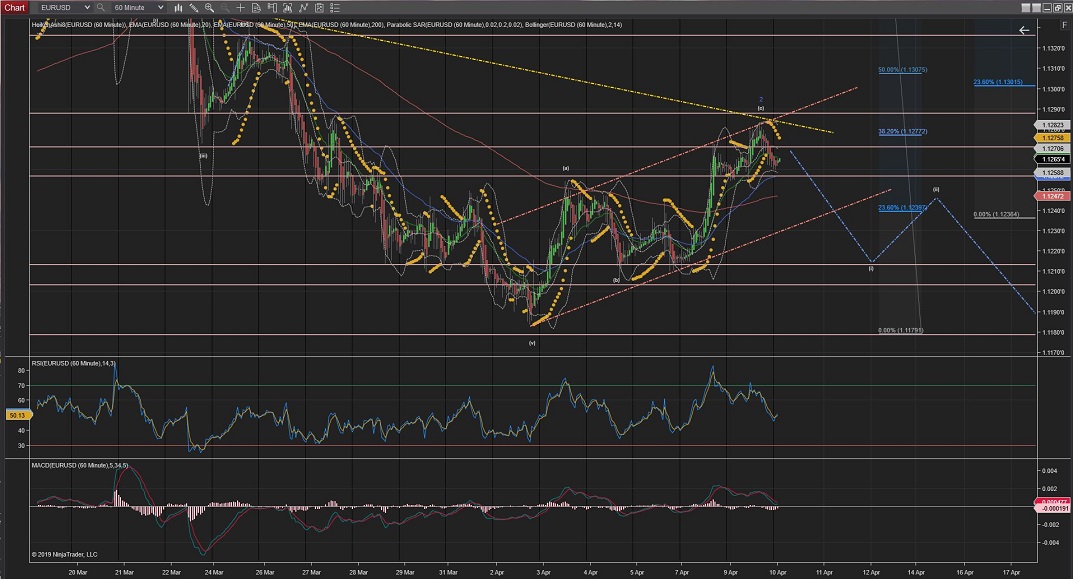
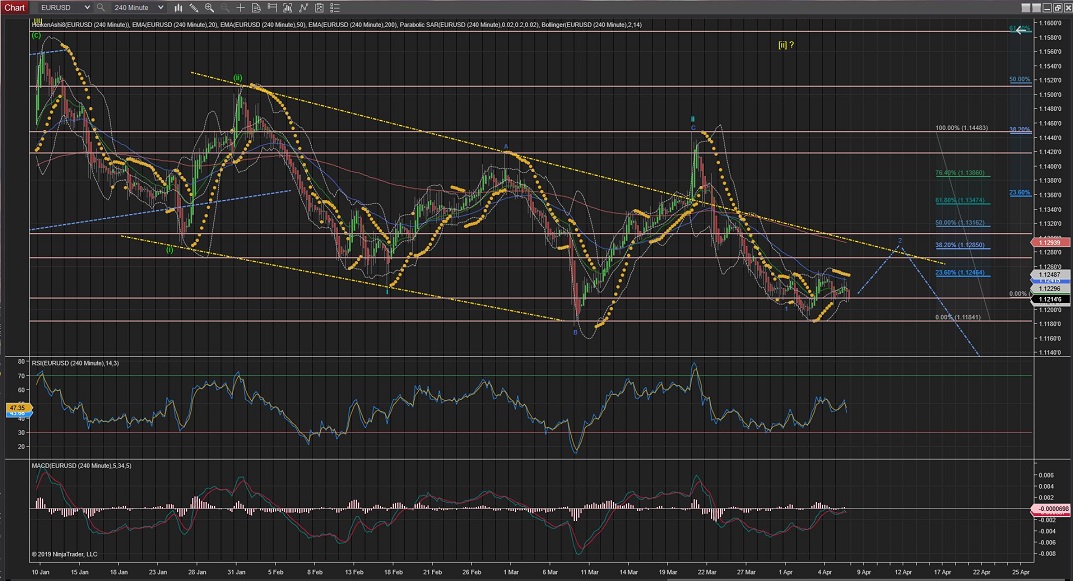
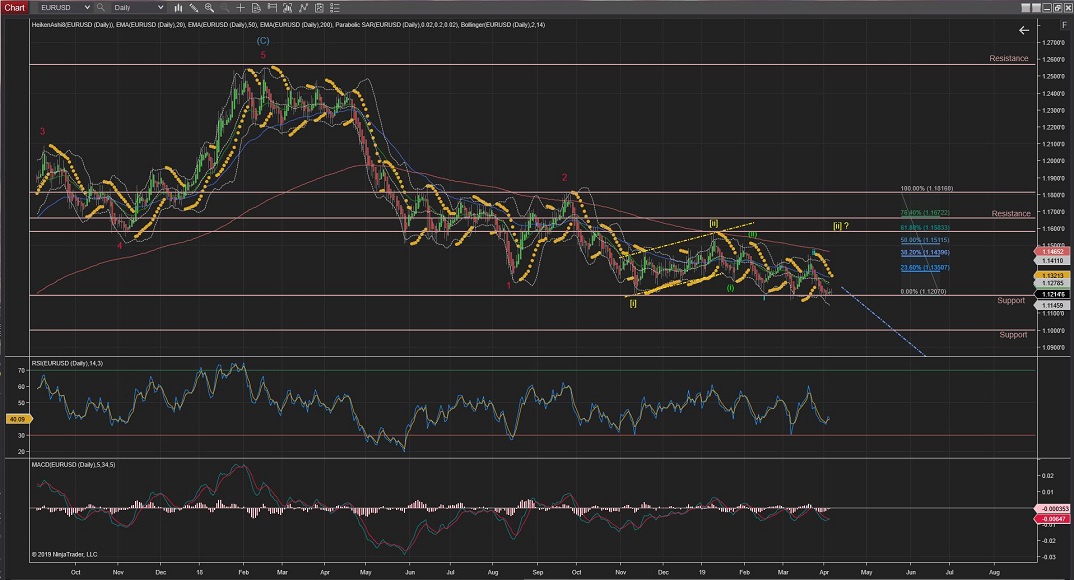
EURUSD today seem to have completed Wave 2 (blue) correction with its last internal Wave (c) bouncing off the yellow trend (at %38Fib retracement of Wave 1).
Wave 3 (of Wave iii) shed an initial impulsive wave to the downside and stalled at the end of the session.
Next, Wave 3 should continue to move down impulsively across the trend line (light-red) and support levels.
60Mins
4Hours
Daily
EURCHF
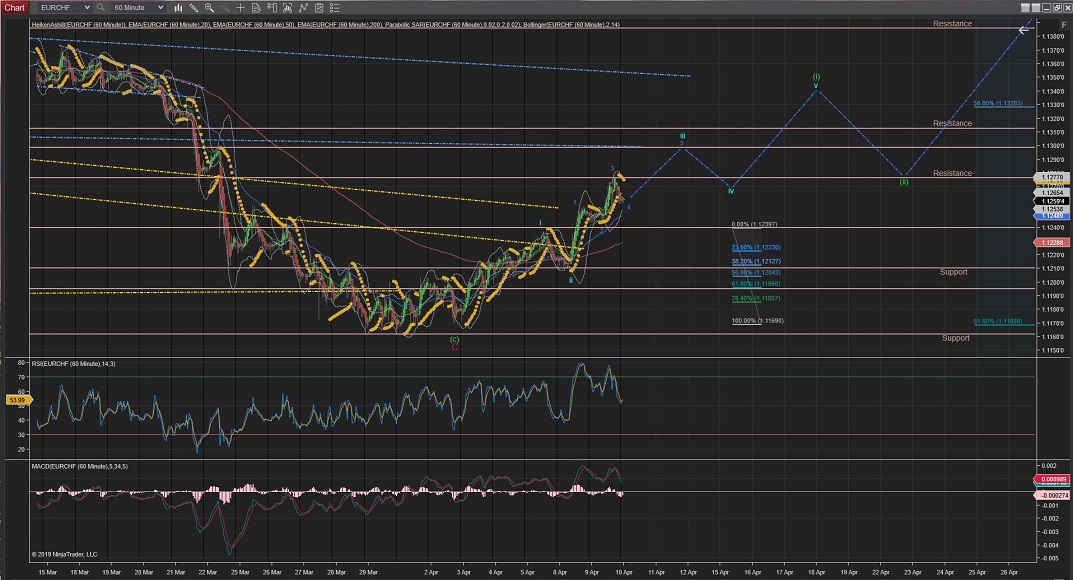
EURCHF Wave iii developed 4 internal waves so far and it is about to complete Wave 4 (which should not drop lower than the highest of Wave 1 for this count to remain valid.
Tomorrow Wave 5 should carry the price higher, after its current internal correction, towards the next resistance level at the 1.1300 area to complete Wave iii.
Once Wave iii is completed, Wave iv correction should bring the price back roughly towards the 4th Wave of a lower degree (Wave 4 (blue)).
60Mins
4Hours
Daily
EURGBP
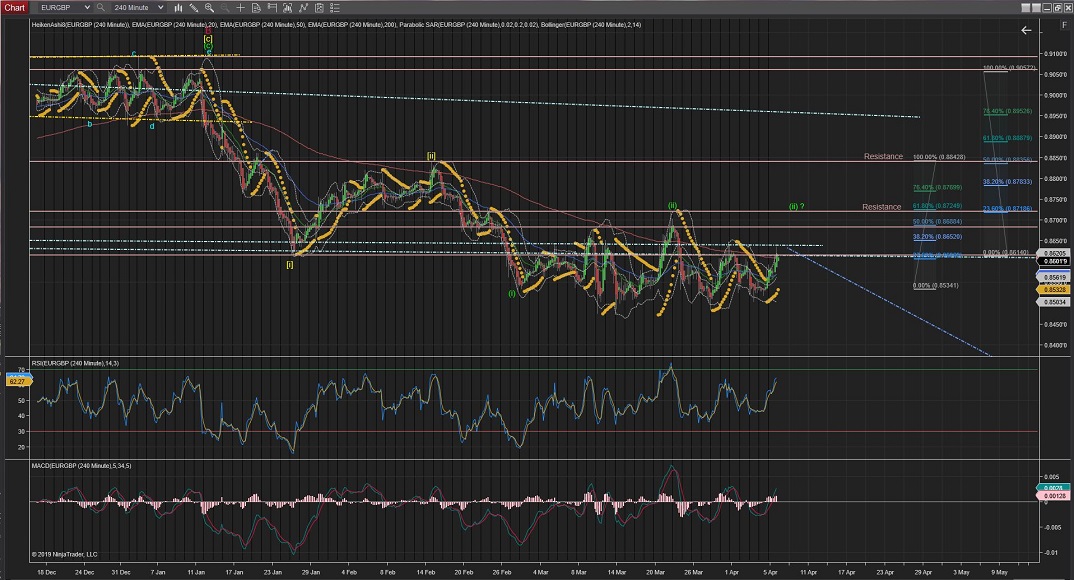
EURGBP Wave 2 is showing a ZigZag (5,3,5) correction possibly extending further to complete at the %76 Fibonacci retracement of Wave 1.
Note if the price crosses higher than the 0Fib retracement it would trigger the alternative count of a Wave (ii) going towards the %62Fib level again or higher at the %76.
If the current count is correct, Wave 3 should take the price below the lowest of Wave 1 at 0.8500.
60Mins
4Hours
Daily
Weekly
GBPUSD
GBPUSD is moving in a very undecided fashion.
Wave ii reached the %50Fib retracement of Wave i and dropped sharply.
This sharp drop suggest that Wave ii could have been completed and Wave iii is underway.
Since then the possible Wave iii down seems to be going through its internal Wave (ii) correction and, once completed, should carry on with the impulsive waves downwards.
(Notice that if the price crosses the red trend it would suggest that Wave ii correction is still in play and price might raise towards resistances at the 1.3300 area again)
60Mins
4Hours
Daily
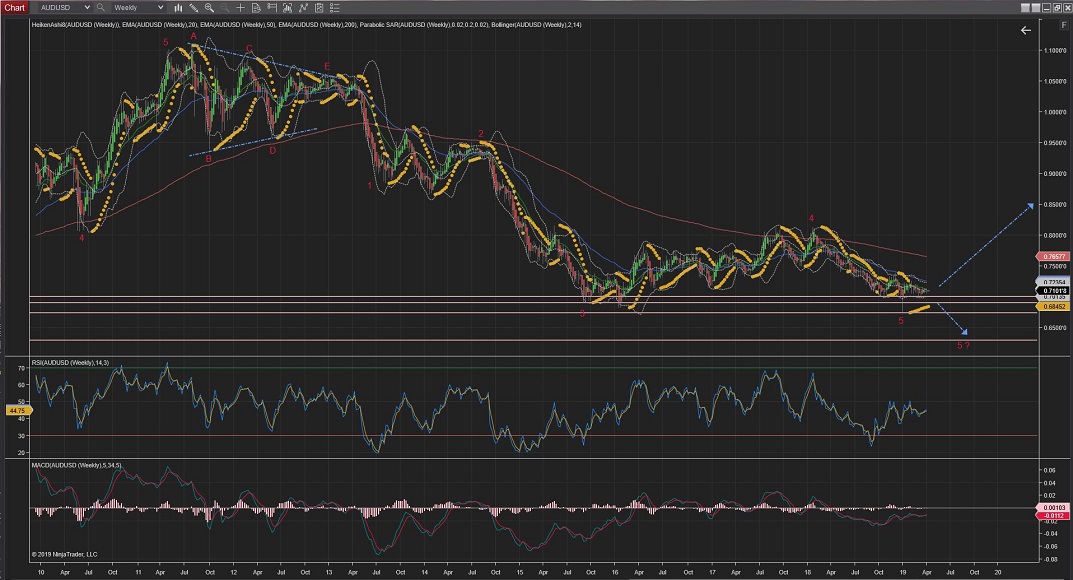
AUDUSD
Daily & 4Hour Charts:
AUDUSD 4Hour Chart is showing the price raising from the neckline of a clear Head & Shoulders pattern which is suggesting Wave (iii) could be finally making its way up.
Still not out of the woods yet, so further moves lower than this neckline would trigger the alternative count for an extended Wave [ii] going towards the %76 levels of support, although it is still possible an extended Wave [v] or even a further extended Wave 5, with not much resistance levels to stop the move down (best seen in the 4Hour and Daily charts) .
Hourly Chart:
As it stands the current count shows a Wave 2(blue) of Wave iii possibly completed at %50 Fib retracement of Wave 1.
For this count to remain valid Wave iii should continue the remaining of its 5 waves up crossing the highest of Wave 1 (0.7126) and then the highest of Wave i at 0.7167.
Further moves lower than the 0 retracement of Wave i would invalidate the current count and go in favour of the alternate counts (best shown in the 4Hour and Daily Charts).
60Mins
4Hours
Daily
Weekly
All the best for everyone.
Andres


 Trading Waves .org