Wed 03-04-2019
Hi everyone, hope you are all ok.
USDJPY
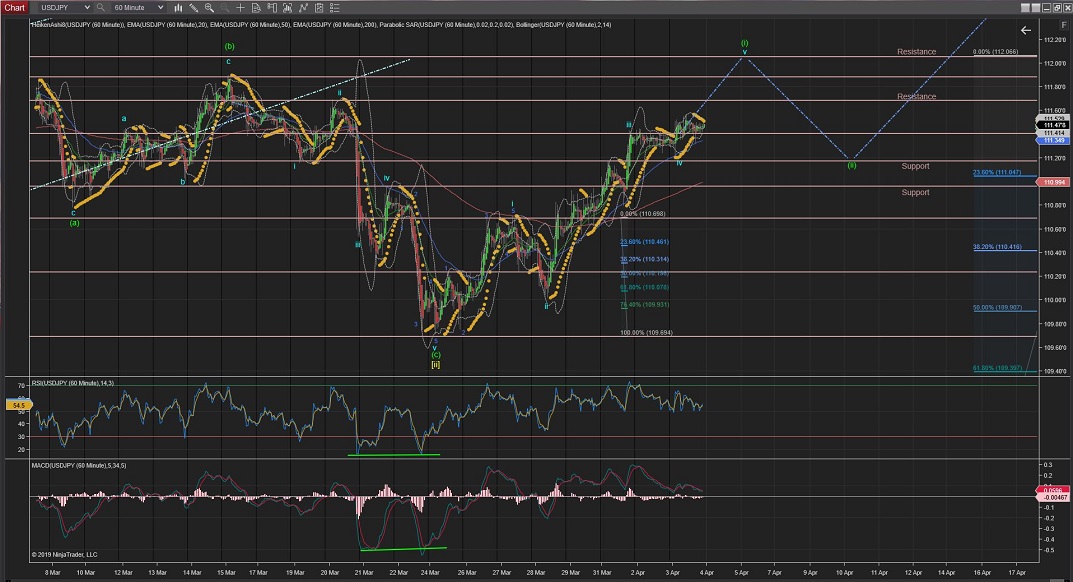
USDJPY might have completed Wave iv, although it has not shown impulsive waves up yet to confirm Wave v.
The target for Wave v is around the 112.00 area where it would complete Wave (i) and Wave (ii) should start developing to the downside towards, possibly to the same heights as the current Wave iv.
60Mins
4Hours
Daily
Weekly
USDCAD
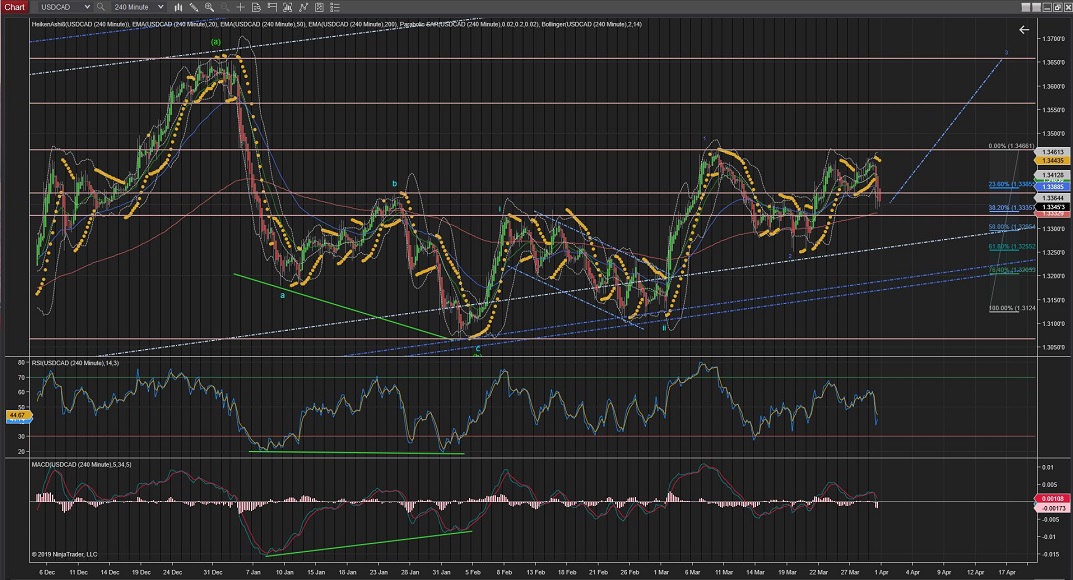
USDCAD correction of Wave (ii) extended further today but still completed at the %76 Fib levels.
Wave (iii) up has shown small impulsive waves up but will only be confirmed when it crosses the highest of Wave (i) at 1.3450 and carries the price higher.
60Mins
4Hours
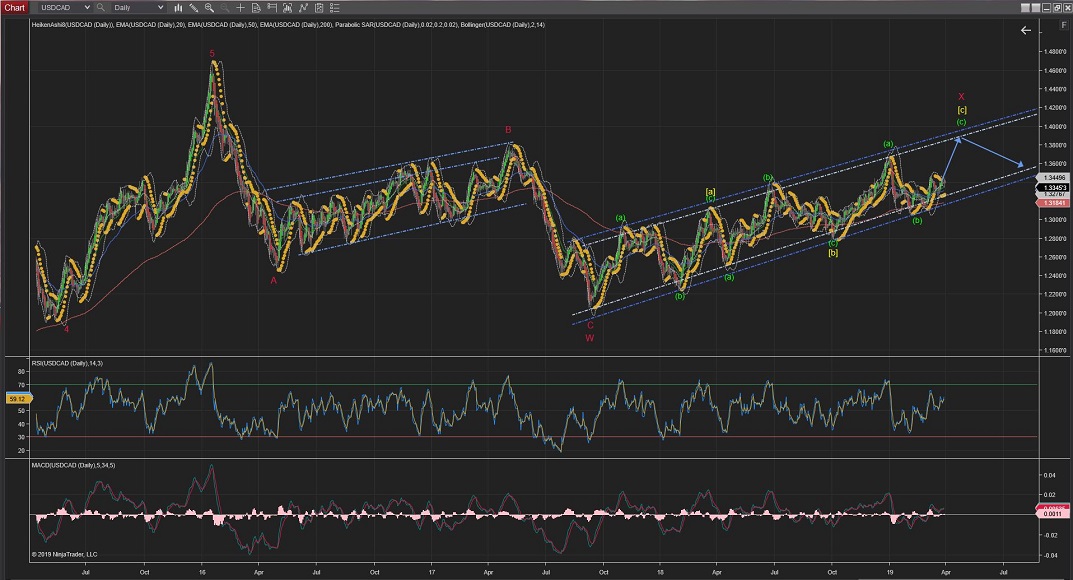
Daily
USDCHF
USDCHF broke out of the triangle to the upside and stopped at the first resistance at 0.9995.
Since then, it has moved sideways and moved down slightly but overall has shown hardly any price action.
If the price carries on upwards in the form of 5 waves it will indicate that Wave c of Wave (c) of Wave [ii] has been already completed and this is the start of the series of waves for Wave [iii].
If the price drops lower again towards the lower trend (blue), the current count would still be valid for an extended Wave c.
Regardless of the starting point for the raise, on the long term, the price is bound to raise impulsively for Wave [iii] .
60Mins
4Hours
Daily
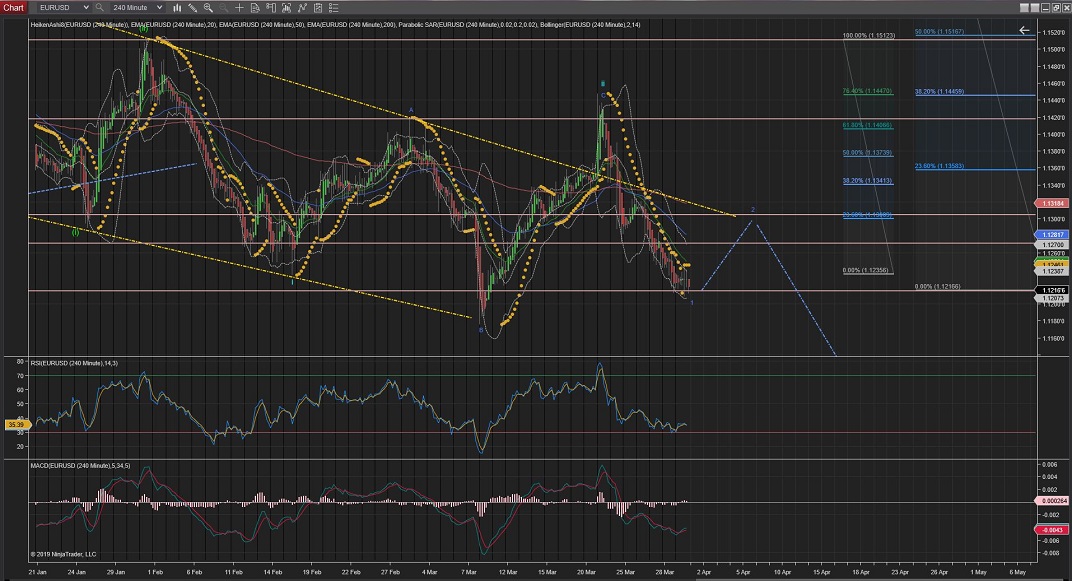
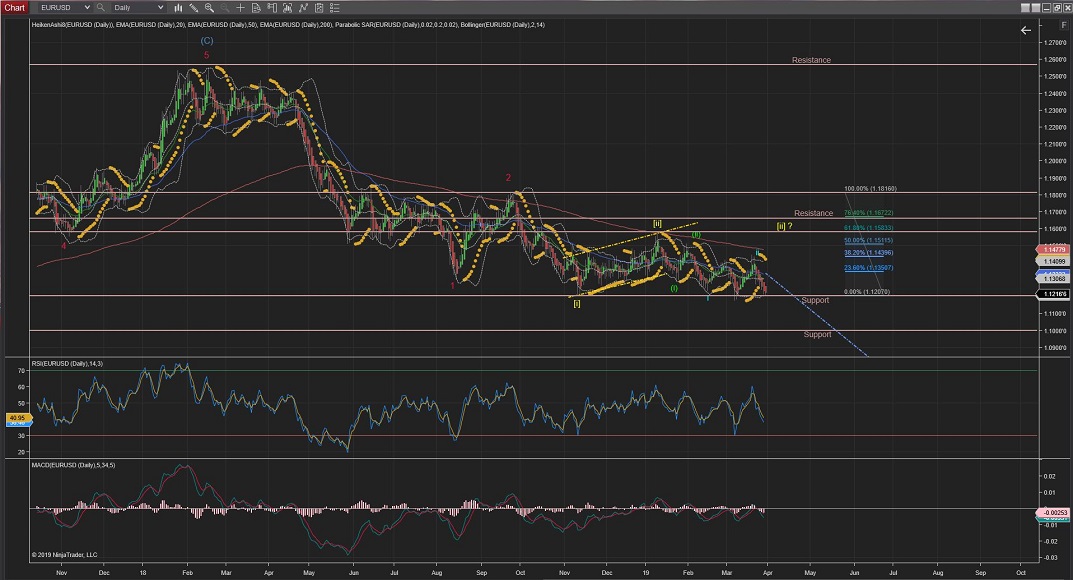
EURUSD
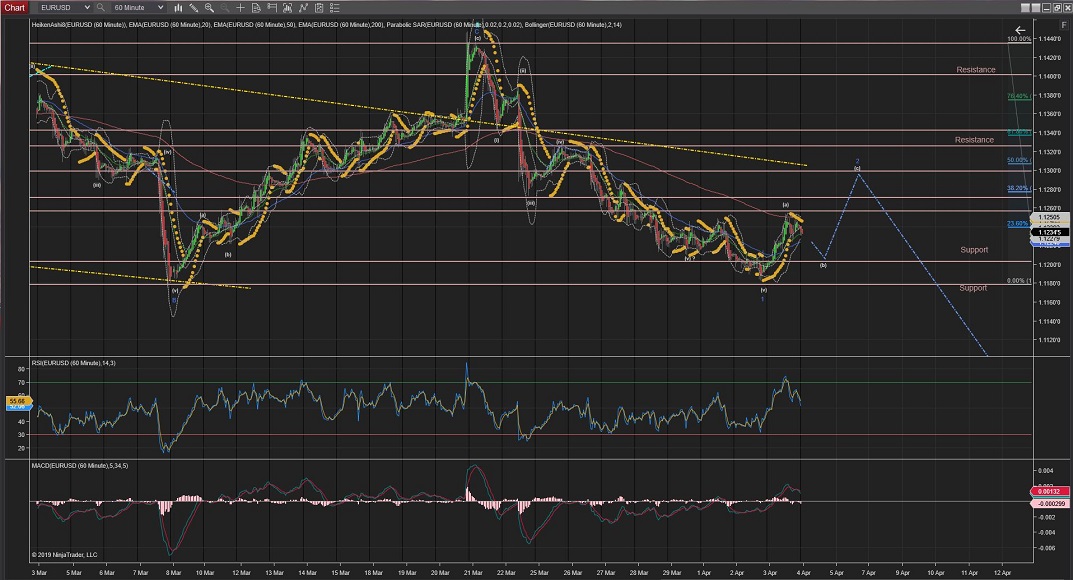
EURUSD has extended Wave (v) to the 1.1180 area, which is the biggest last area of support for a while, and finally completed Wave 1(blue).
Today Wave 2 raised the price in its internal Wave (a) and started to drop suggesting the start of Wave (b) towards Support at 1.1202 area.
Once the internal Wave (b) is completed, Wave (c) should carry the price towards the yellow trend (%50Fib retracement of Wave 1) to complete Wave 2(blue).
Once Wave 2 is completed Wave 3 (of Wave iii) should show impulsive waves to the downside again and provide a low-risk entry opportunity in its initial internal confirmation waves.
60Mins
4Hours
Daily
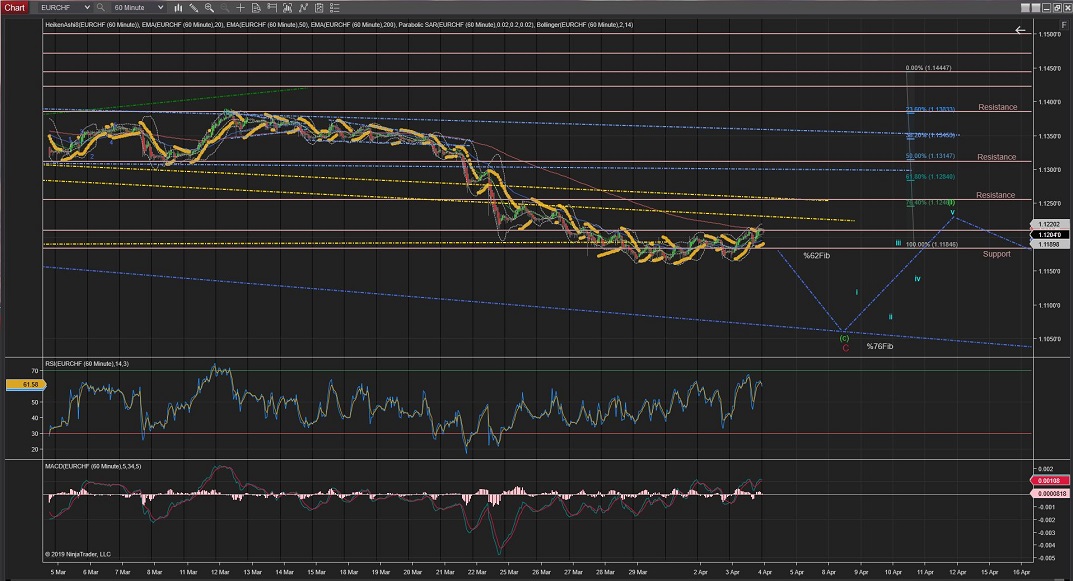
EURCHF
EURCHF is still undergoing correction through an extended Wave C(red) to towards the %76Fib retracement, as it has been moving sideways through the %62Fib level.
This moves gives more weight to the suggestion that it is still running through the Wave (c) correction and could still drop lower towards the %76Fib level at the lower trend line (blue).
The %76Fib level would bring the price back towards the blue long-term trend line (best shown on the Daily and 4Hour Charts) (1.0968 area).
60Mins
4Hours
Daily
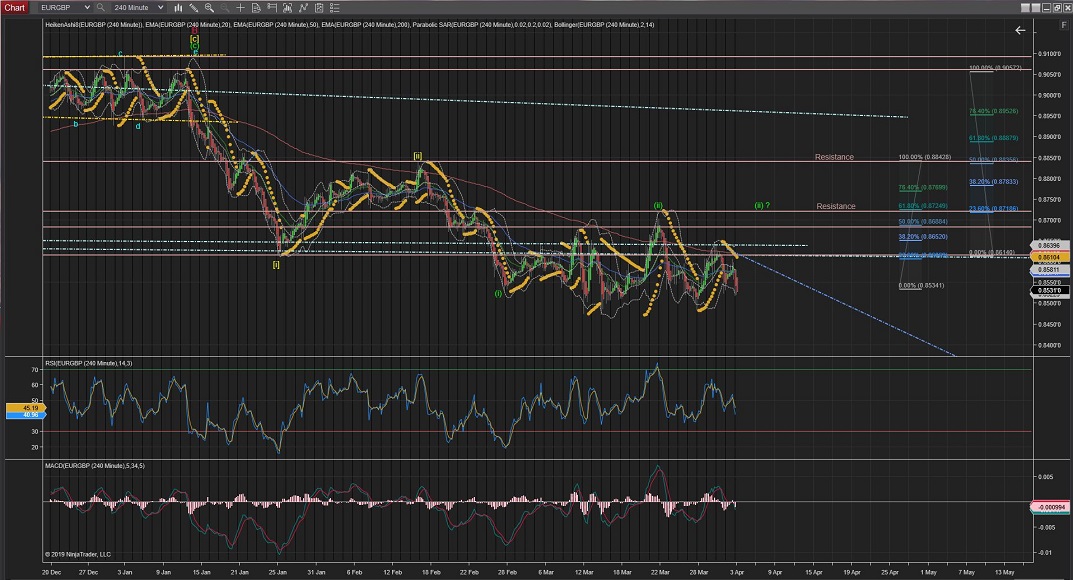
EURGBP
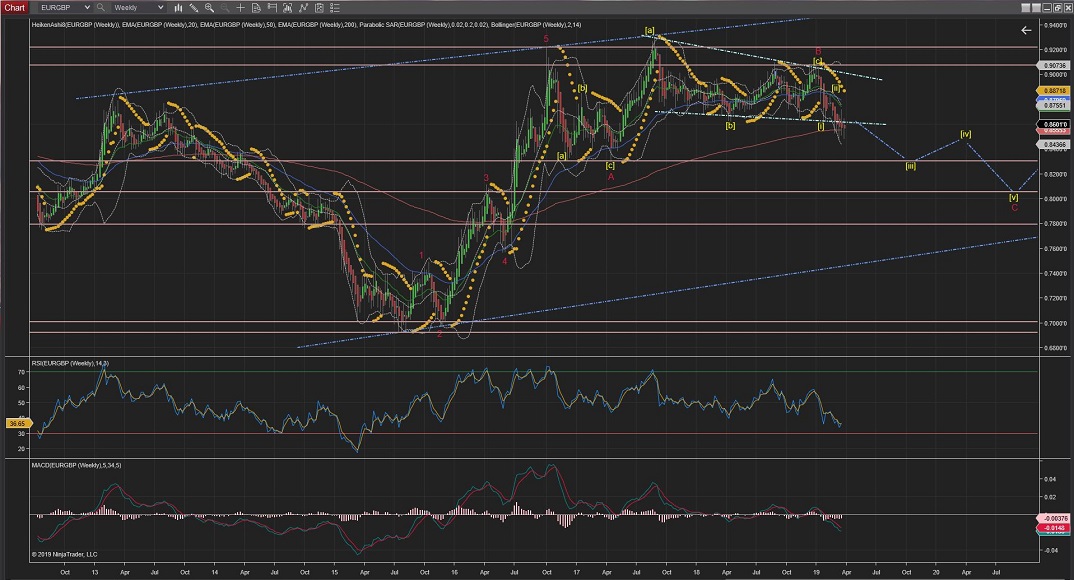
EURGBP completed Wave ii correction between the %62 and the %76 Fib level.
And now created the turning point for Wave iii of Wave (iii) down.
The initial drop down is very impulsive and so far and going through the internal Wave (v) down towards completion of Wave 1(blue) of the larger Wave iii, possibly at the next level of support at 0.8482 level.
Once Wave 1 is completed, Wave 2 should follow a 3 waves correction to the upside.
60Mins
4Hours
Daily
Weekly
GBPUSD
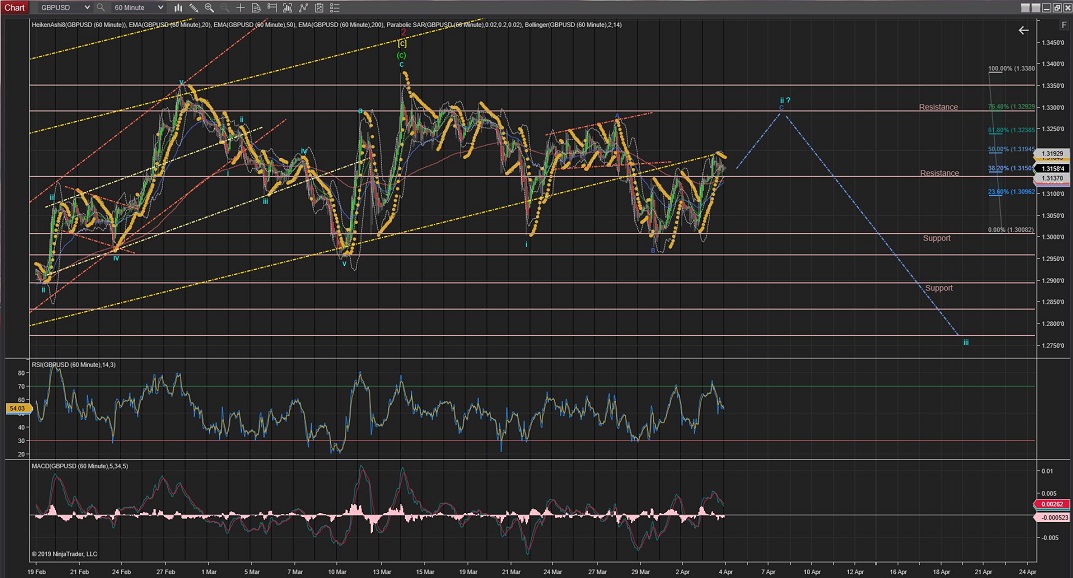
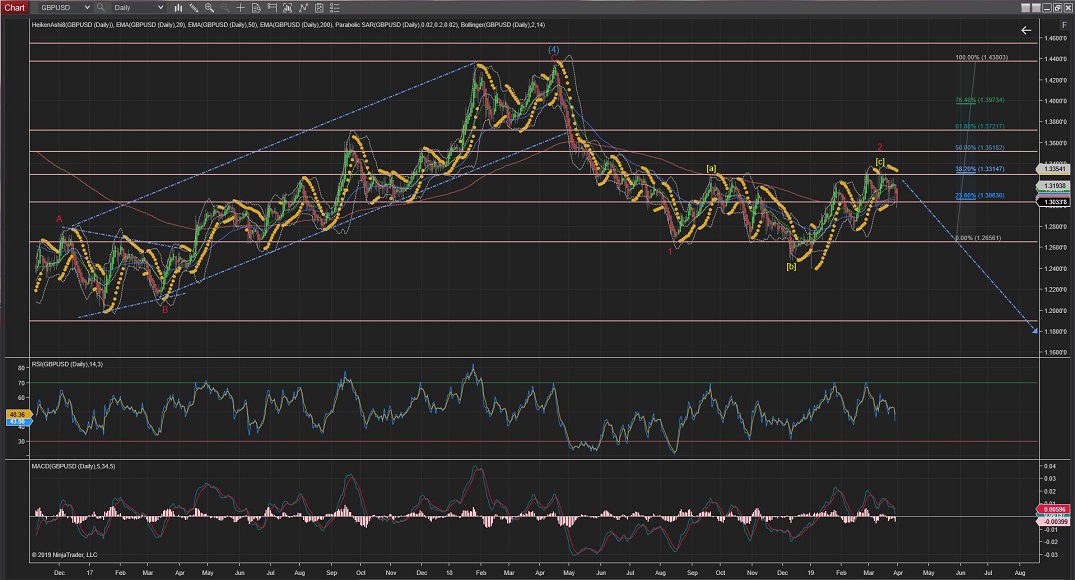
GBPUSD today has triggered the alternative count for an extended Wave ii back towards the %76Fib retracement of Wave i.
Although, if the price raises further than 0 of that retracement it will indicate that a larger Wave 2(red) is still in play.
If this is an extended Wave ii; Once completed, impulsive moves to the downside in the form of 5 waves would confirm that Wave iii has started.
60Mins
4Hours
Daily
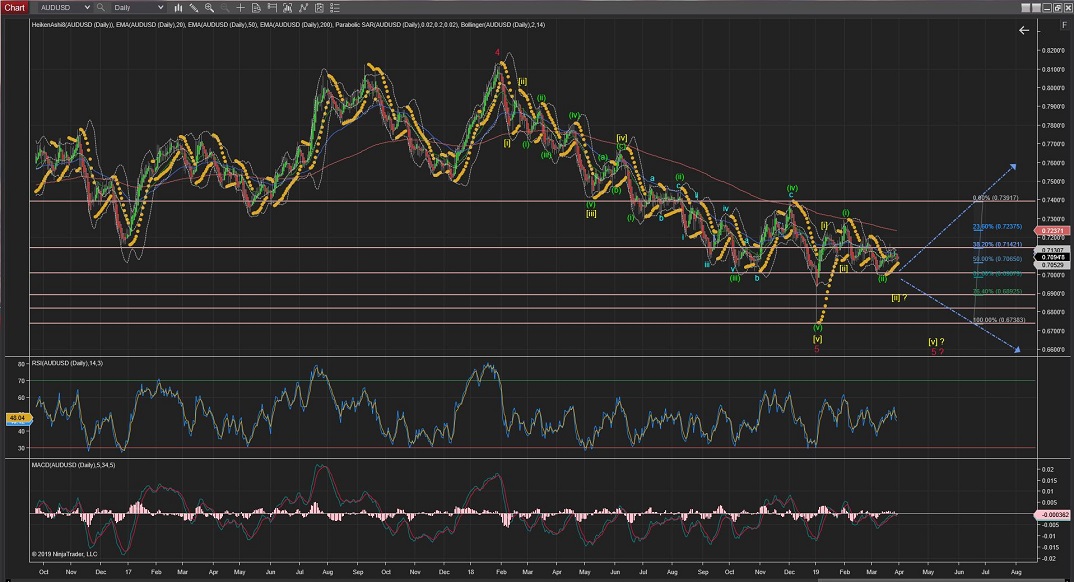
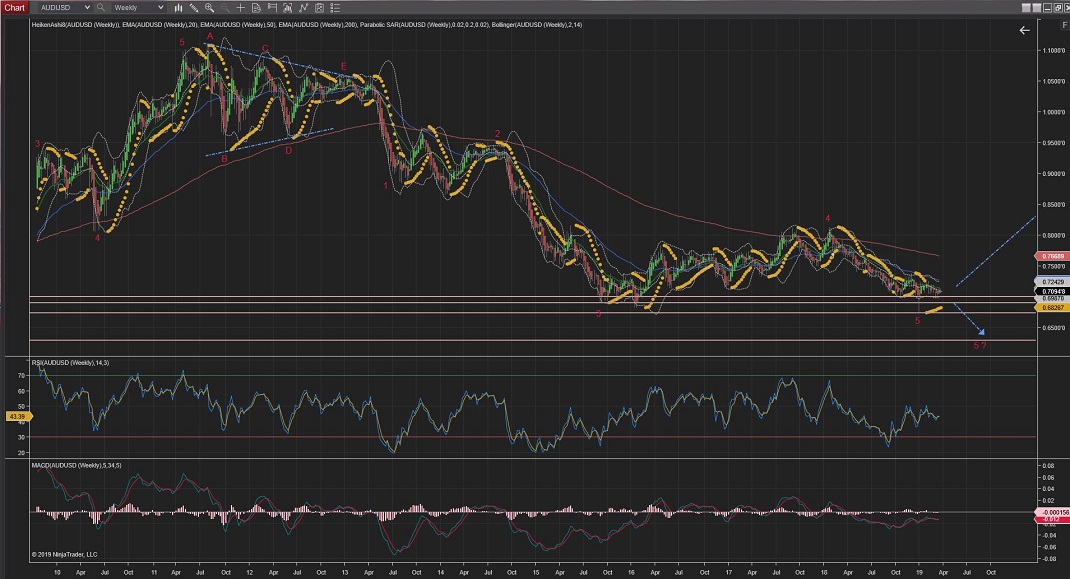
AUDUSD
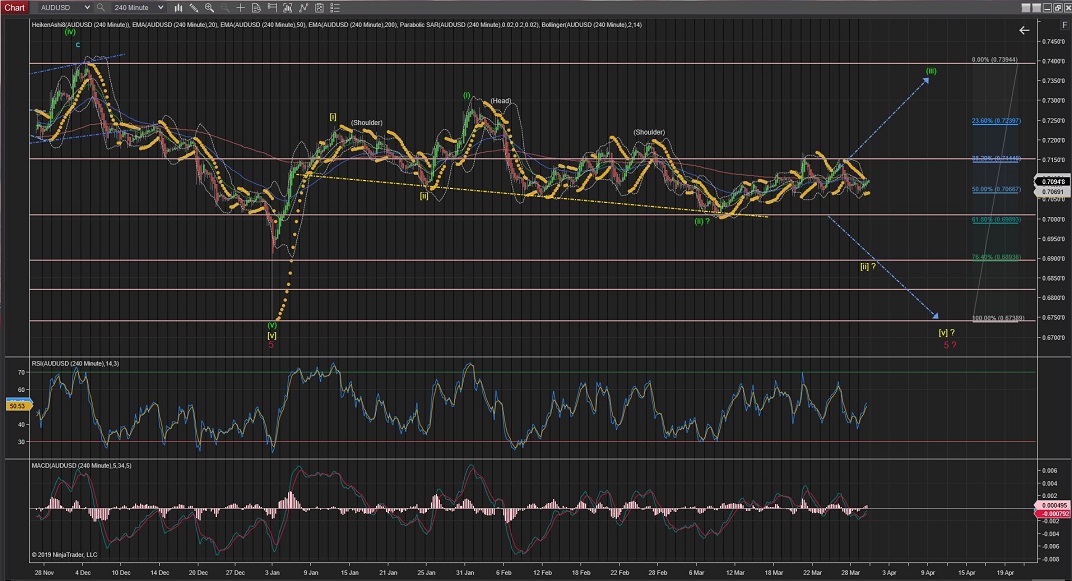
Daily & 4Hour Charts:
AUDUSD 4Hour Chart is showing the price raising from the neckline of a clear Head & Shoulders pattern which is suggesting Wave (iii) could be finally making its way up.
Still not out of the woods yet, so further moves lower than this neckline would trigger the alternative count for an extended Wave [ii] going towards the %76 levels of support, although it is still possible an extended Wave [v] or even a further extended Wave 5, with not much resistance levels to stop the move down (best seen in the 4Hour and Daily charts) .
Hourly Chart:
As it stands the current count shows a Wave ii possibly completed at nearly %76 Fib retracement of Wave i.
For this count to remain valid Wave iii should develop 5 waves up crossing the highest of Wave i at 0.7167.
Further moves lower than the 0 retracement of Wave i would invalidate the current count and go in favour of the alternate counts (best shown in the 4Hour and Daily Charts).
But so far, today it has completed what appears to be Wave 1(blue) of Wave iii and a corrective Wave 2 should now follow before Wave 3 takes the price higher again.
60Mins
4Hours
Daily
Weekly
All the best for everyone.
Andres


 Trading Waves .org