Fri 29-03-2019
Hi everyone, hope you are all ok.
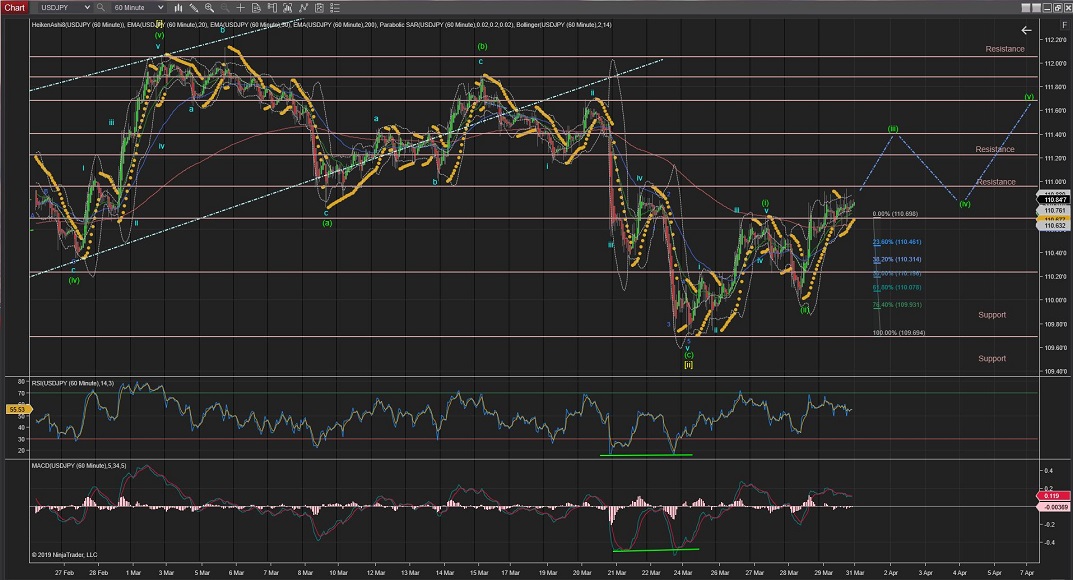
USDJPY
USDJPY completed Wave (ii) correction between %62 and %76 Fib retracement of Wave (i).
Since then it raised impulsively on the initial wave of Wave (iii) and it has now stalled slightly into what should be an internal correction for wave (iii).
Monday I would expect Wave (iii) to carry on its move upwards through resistance levels towards the 111.20 to 111.40 area.
Once Wave (iii) is completed it should follow Wave (iv) correction back towards the 111.00 area; at which point the highest of Wave (i) should hold the price from dropping lower.
60Mins
4Hours
Daily
Weekly
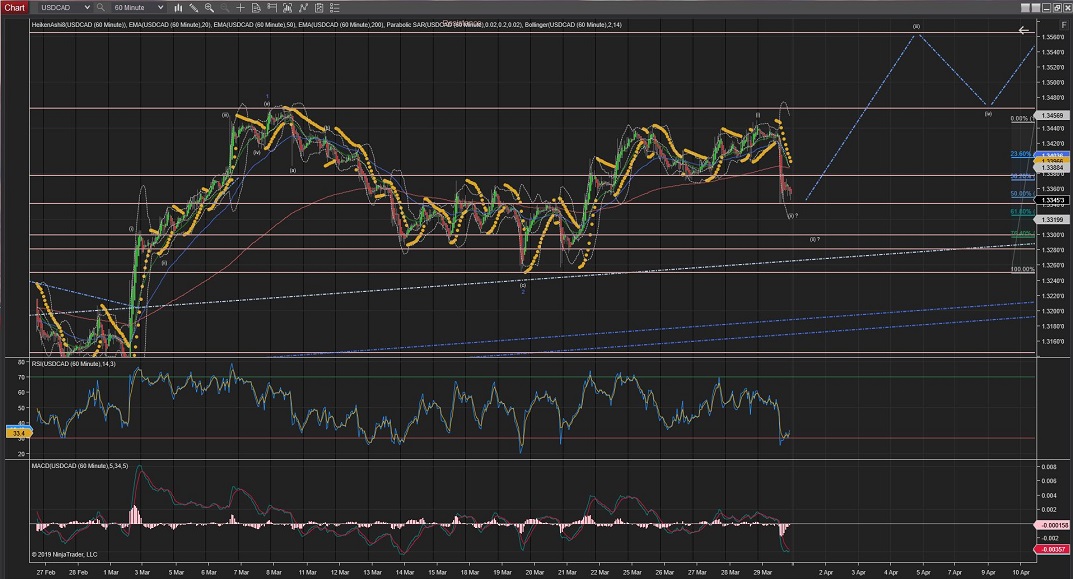
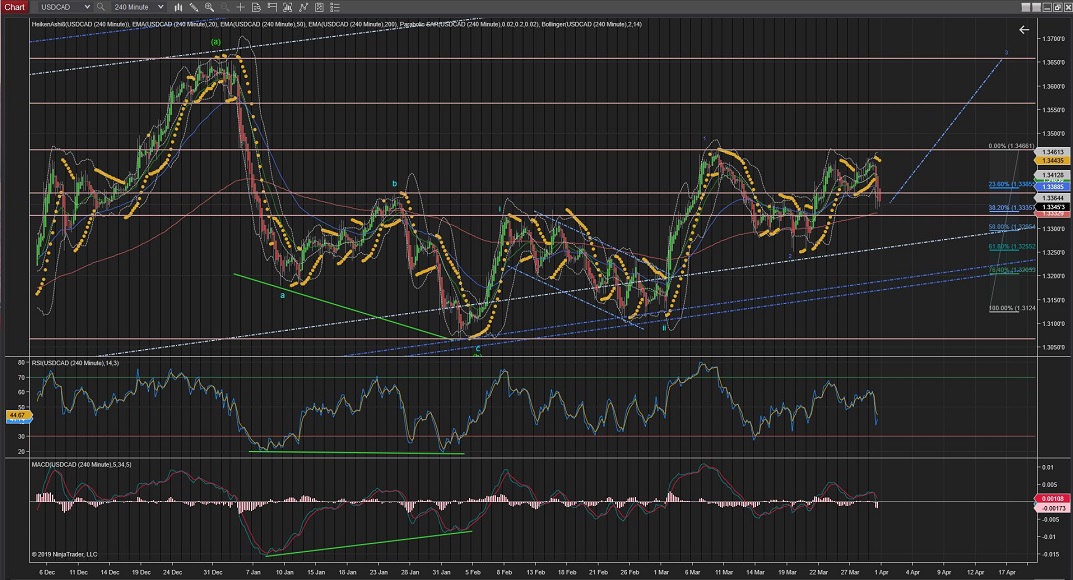
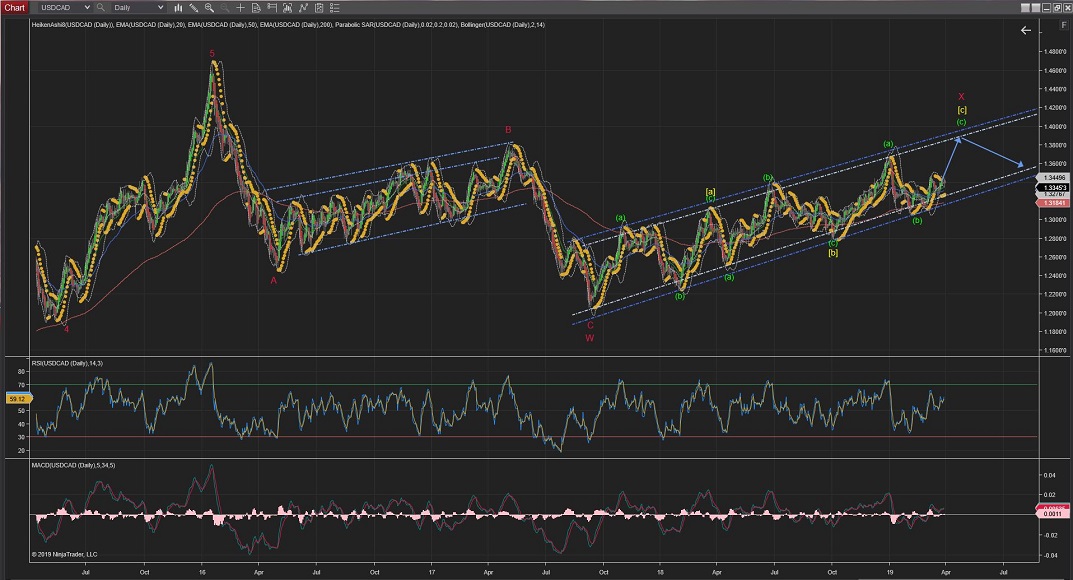
USDCAD
USDCAD triggered the alternative count for an internal greater level of waves (i) and Wave (ii) for Wave 3(blue).
As the count stands now there is a correction of Wave (ii) between %50 and %62 Fib levels which will be confirmed as completed as soon as the impulsive waves shows the start of Wave (iii).
Wave (iii) should developed in 5 waves and will be confirmed as soon as it crosses the highest of Wave (i) at 1.3450.
60Mins
4Hours
Daily
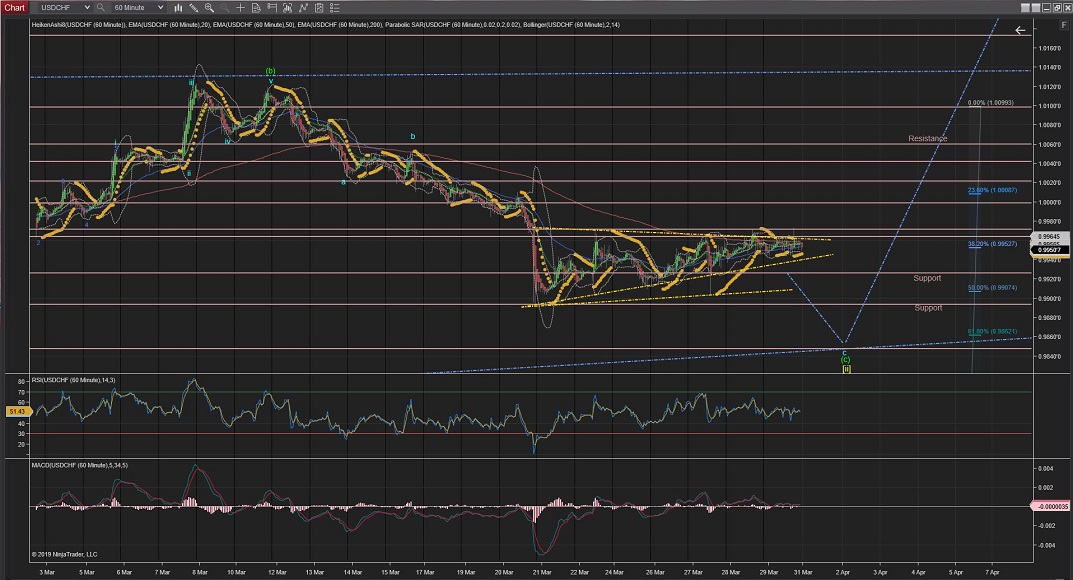
USDCHF
USDCHF is still moving sideways through a small trend (yellow) in a corrective manner.
Although most indications are pointing that the price still will be heading down towards the lower long-term trend line again to complete Wave [ii] at the %62 Fib retracement (best shown in the 4Hour Chart).
On the long term, however the price is bound to raise for Wave [iii] once it hits the lower (blue) trend.
60Mins
4Hours
Daily
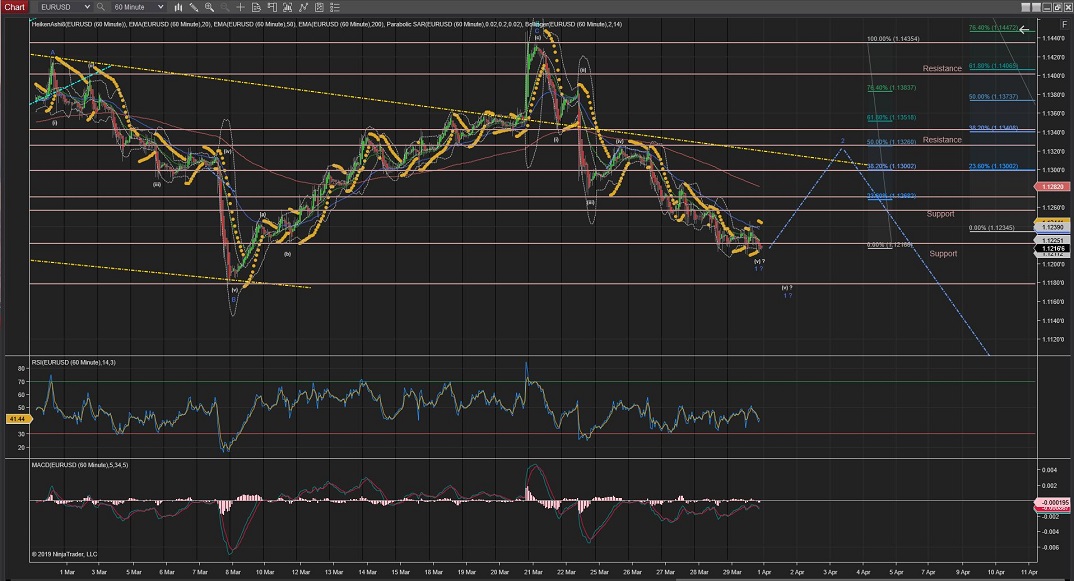
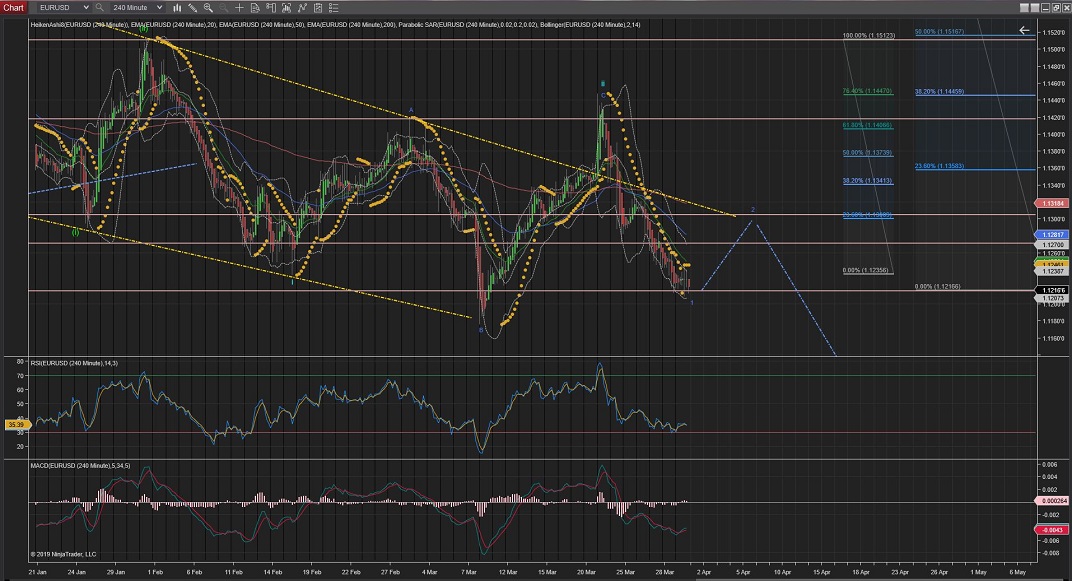
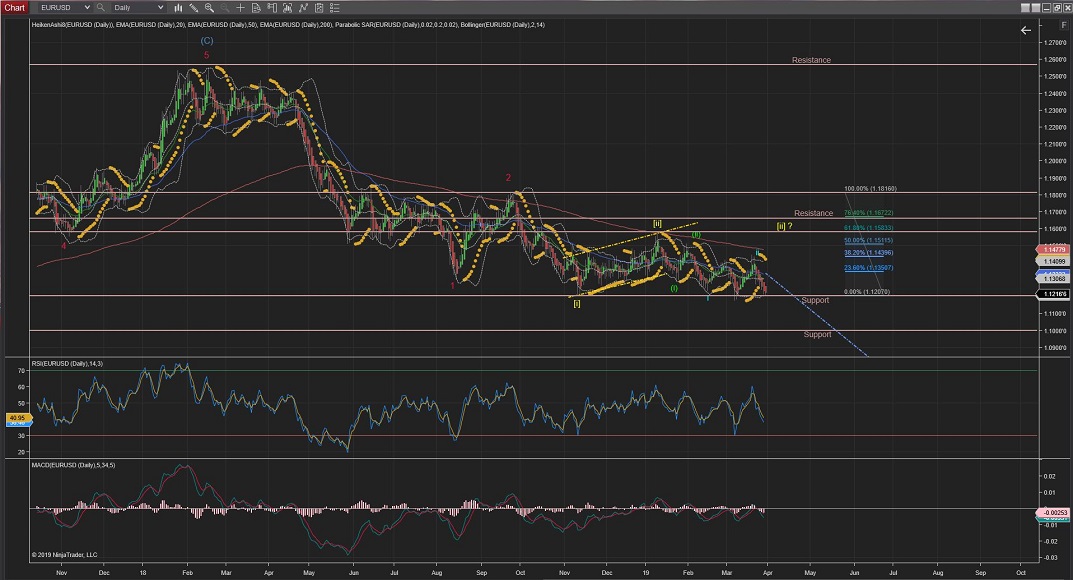
EURUSD
EURUSD seems to have finished Wave (v) at the 1.1221 resistance level, although it could be extended to the next level of support at 1.1180.
If this is the final bottom for Wave (v) it will complete Wave 1 (blue) and Wave 2 should raise the price in three waves towards the yellow trend.
Once Wave 2 is completed Wave 3 (of Wave iii) should show impulsive waves to the downside again and a low-risk entry opportunity.
60Mins
4Hours
Daily
EURCHF
EURCHF has invalidated the previous count and I have modified the long term count for an extended Wave C(red) to towards the %76Fib retracement, as it is now crossing the %62Fib level.
The %76Fib level would bring the price back towards the blue long-term trend line (best shown on the Daily and 4Hour Charts).
As for the hourly chart it is showing to drop impulsively in three waves to make the last Wave (c) towards the blue trend line at the 1.1000 or below area and and %76Fib levels (1.0968 level).
60Mins
4Hours
Daily
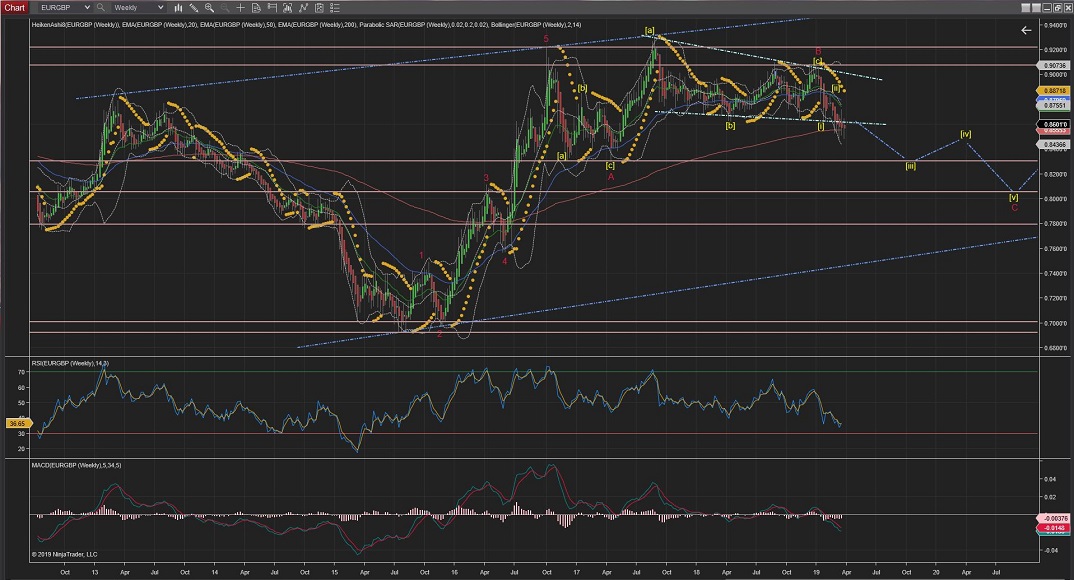
EURGBP
EURGBP might have completed Wave ii correction between the %62 and the %76 Fib level.
Although it has not moved down yet much, this could be the turning point for Wave iii of Wave (iii) down.
Once Wave ii correction is completed, Wave iii (of Wave (iii)) should move impulsively downwards and the first two internal waves on the way down should offer a low risk entry opportunity.
60Mins
4Hours
Daily
Weekly
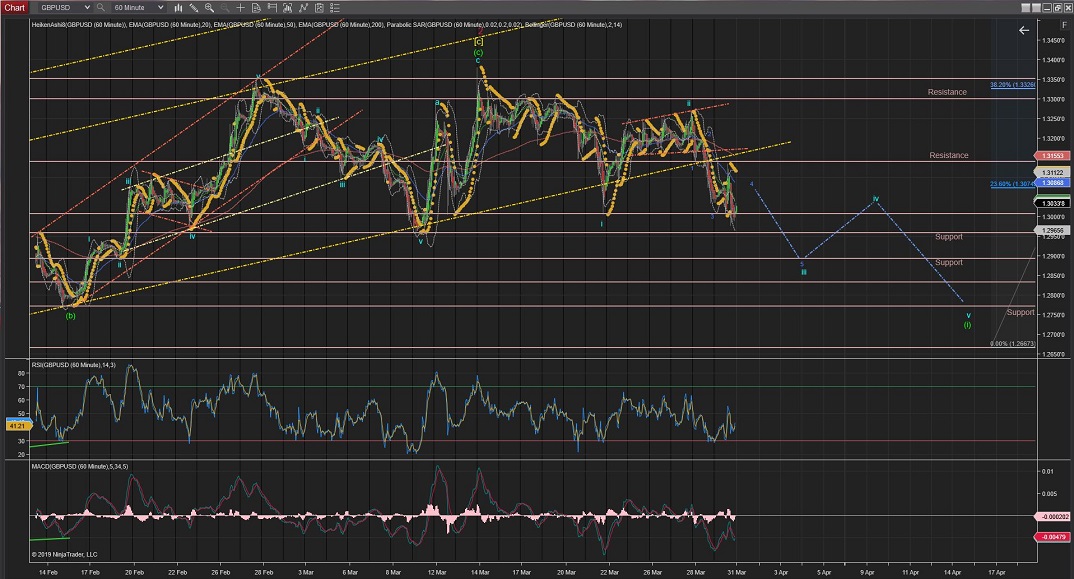
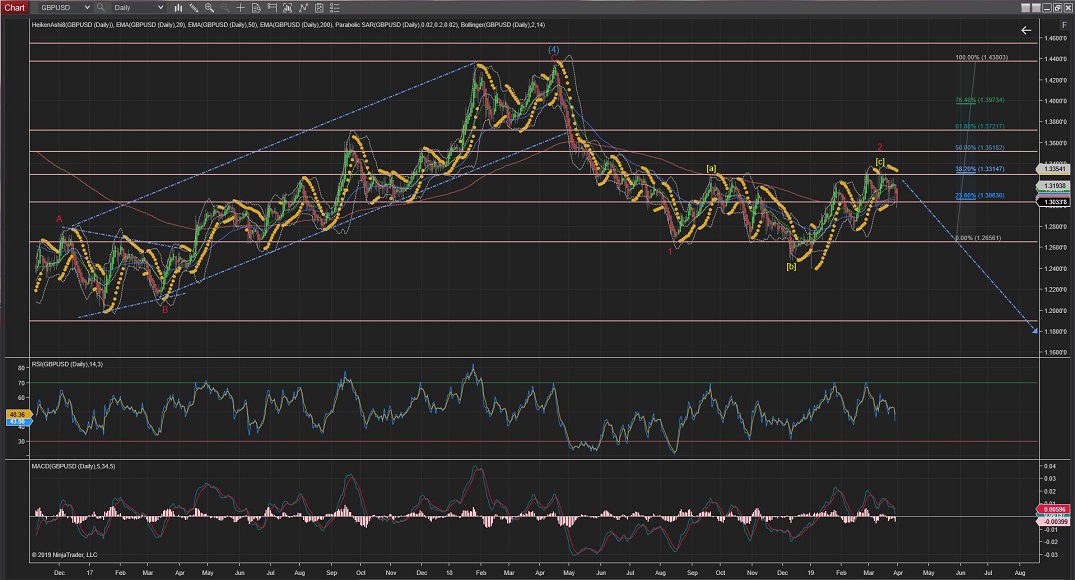
GBPUSD
GBPUSD has shown the start of Wave 4 (blue) correction (of Wave iii) on the way up.
The lowest of Wave 1(blue) at 1.3141 resistance level should not be crossed for this count to remain valid.
Upon Wave 4 completion, Wave 5 should carry the price across support levels where Wave (iii) should be completed.
60Mins
4Hours
Daily
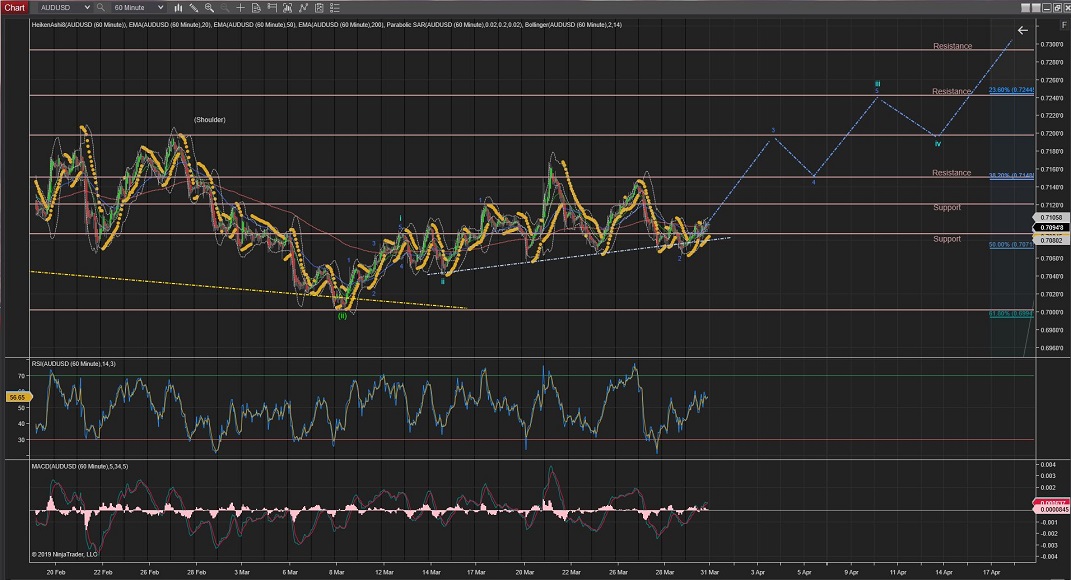
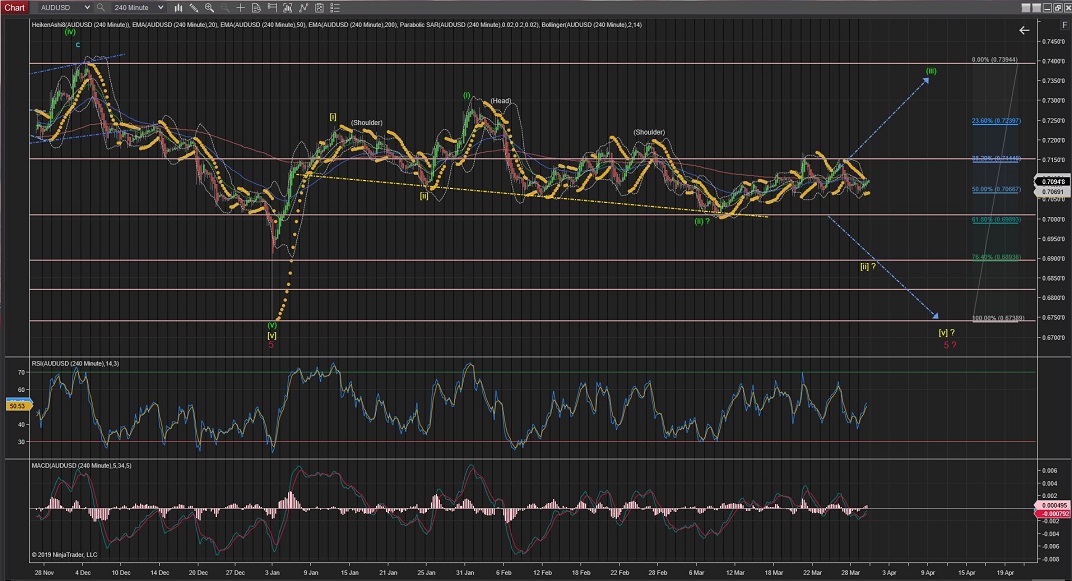
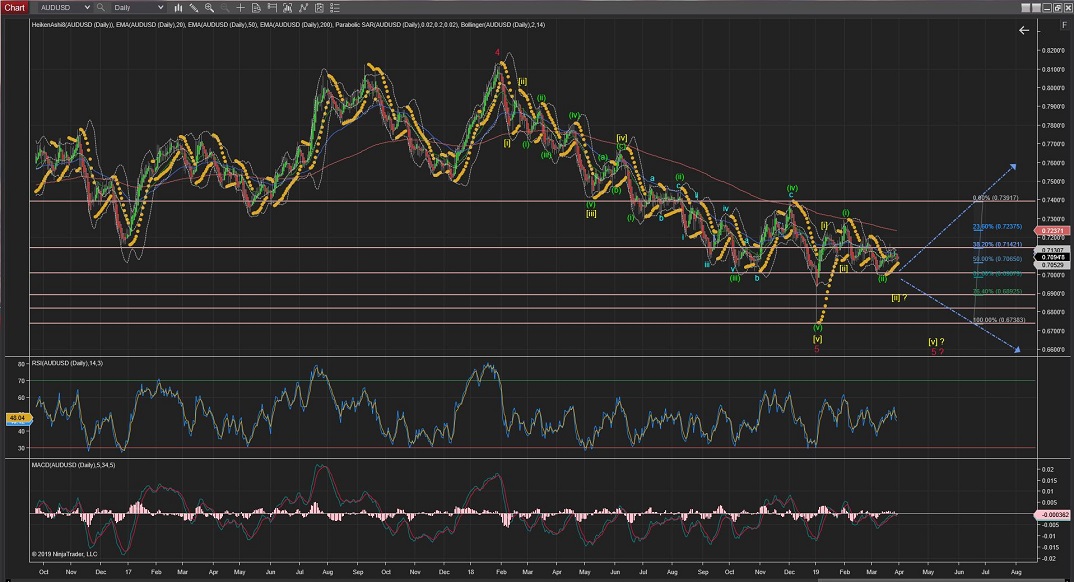
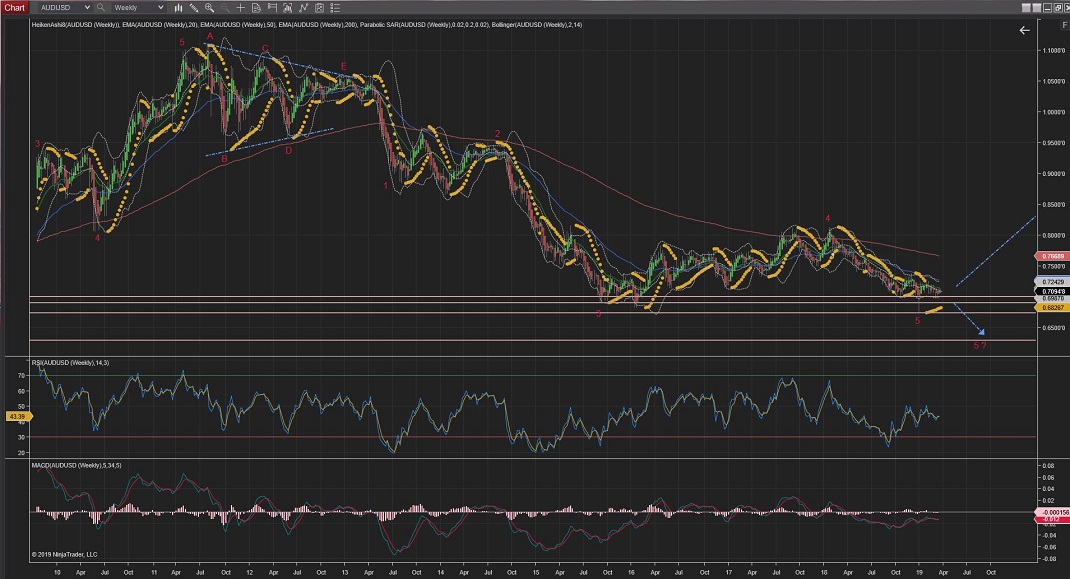
AUDUSD
Daily & 4Hour Charts:
AUDUSD 4Hour Chart is showing the price raising from the neckline of a clear Head & Shoulders pattern which is suggesting Wave (iii) could be finally making its way up.
Still not out of the woods yet, so further moves lower than this neckline would trigger the alternative count for an extended Wave [ii] going towards the %76 levels of support, although it is still possible an extended Wave [v] or even a further extended Wave 5, with not much resistance levels to stop the move down (best seen in the 4Hour and Daily charts) .
Hourly Chart:
The 60Min chart shows to ha completed a large Wave 2 correction for Wave iii, which suggest that Wave 3 now should continue the impulsive moves higher towards the 0.7200 area if this count is to be valid.
It has moved further up but still needs to pass resistance levels around 0.7150.
Further moves lower than the lowest of Wave 2 would invalidate the current count and start giving indications that the alternate counts (best shown in the 4Hour and Daily Charts) could take place instead.
60Mins
4Hours
Daily
Weekly
All the best for everyone.
Andres


 Trading Waves .org