Mon 25-03-2019
Hi everyone, hope you are all ok and had a nice weekend.
USDJPY
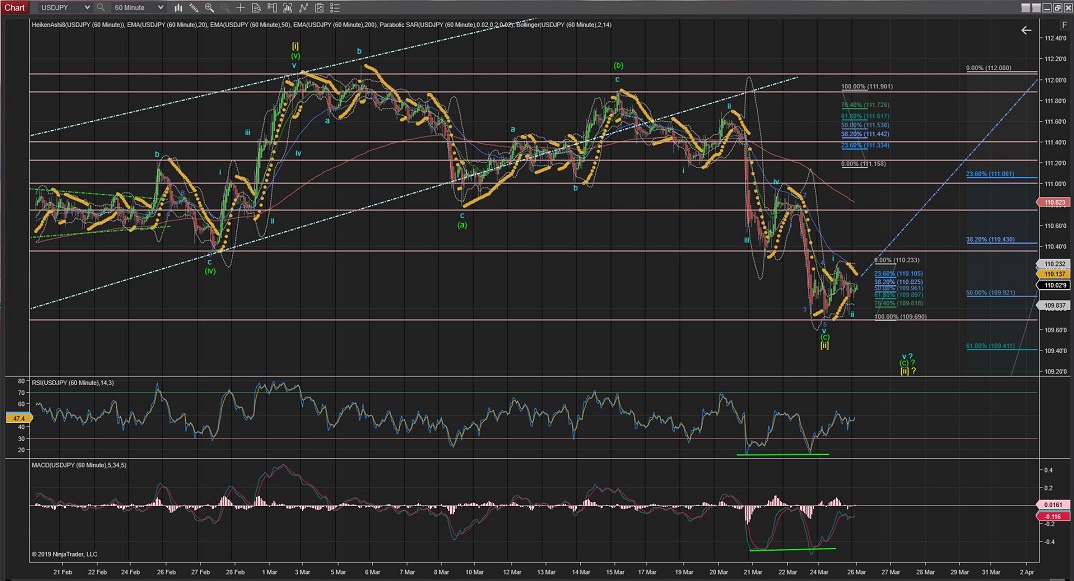
USDJPY seem to have completed Wave (c) of Wave [ii] with 5 waves within last Wave v of Wave (c).
Since then it has made Wave i up and a Wave ii correction making a higher lower.
And it is showing a divergence signal with the RSI and MACD indicators for the price to raise impulsively.
This could lead up to the start of Wave [iii] if Wave iii is confirmed by crossing the highest of Wave i at 110.23.
(I would expect this change of trend to carry the price higher with impulsive waves and further price drop from today's lowest would suggest Wave [ii] completion to go towards the %62Fib retracement instead).
60Mins
4Hours
Daily
Weekly
USDCAD
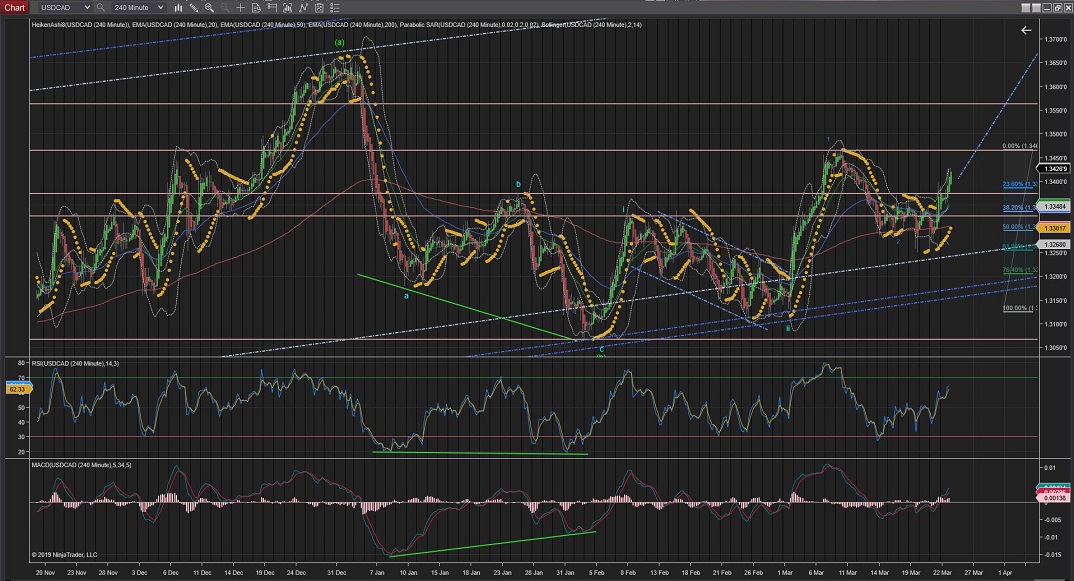
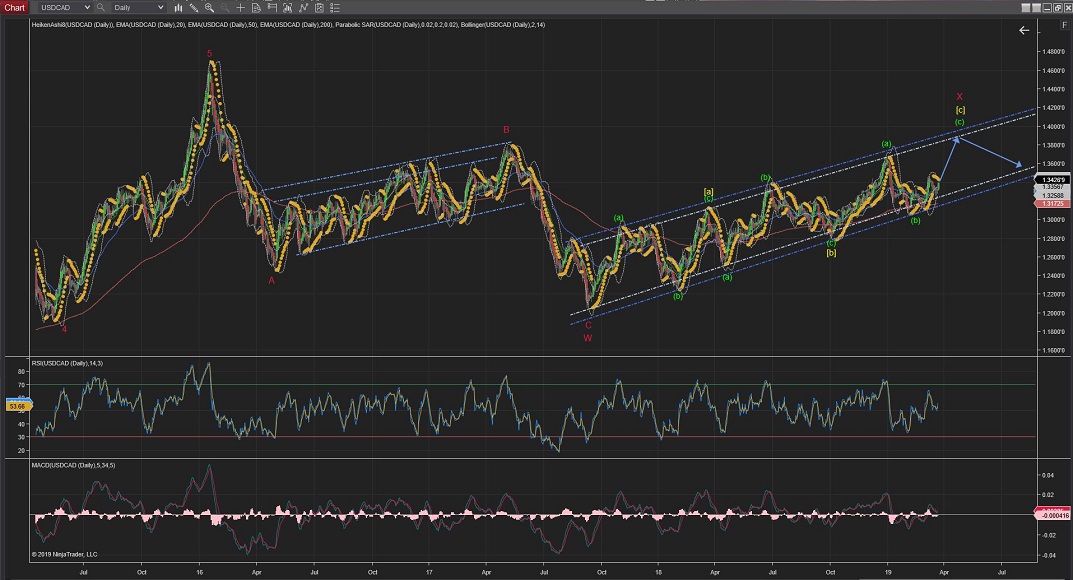
USDCAD has completed Wave (iii) and dropped lower for Wave (iv) correction.
Wave (iv) is still underway and the highest of Wave (i) at 1.3341 should hold the price.
Once Wave (iv) is completed, Wave v should carry the price higher again.
Wave 3(blue) will be confirmed as soon as it crosses the highest of Wave 1(blue) at 1.3466 (so I would expect a large impulsive Wave (v) to cross the next resistance level).
60Mins
4Hours
Daily
USDCHF
USDCHF has not shown much price action today and is still showing a correction to the upside at the now %50Fib level and 200EMA(Daily Chart),
Although most indications are pointing that the price still will be heading down towards the lower long-term trend line again to complete Wave [ii] at the %62 Fib retracement (best shown in the 4Hour Chart).
60Mins
4Hours
Daily
EURUSD
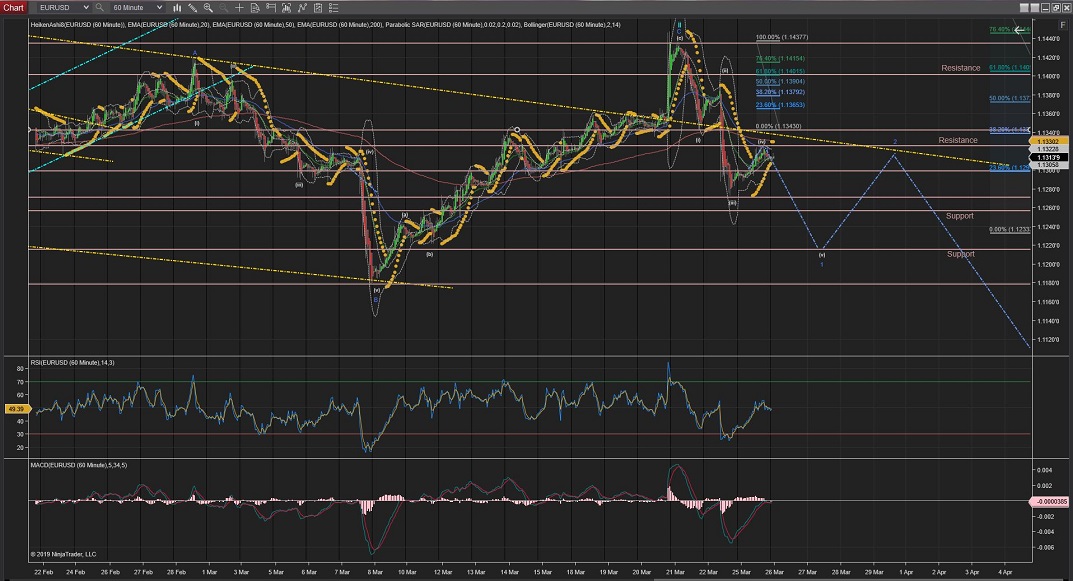
EURUSD seemed to have completed Wave (iv) correction but has not shown yet impulsive waves to the downside to initiate Wave (v).
Any time now, or possibly a further move up towards the yellow trend should complete Wave (iv)
(The lowest of Wave (i) at 1.3430 should stop the price from going higher for this count to be valid)
From there Wave (v) should take over for another impulsive Wave v to the downside to complete Wave 1 (blue).
Once Wave 1(blue) is completed, Wave 2 correction should take form of 3 Waves to the upside towards the yellow trend again.
60Mins
4Hours
Daily
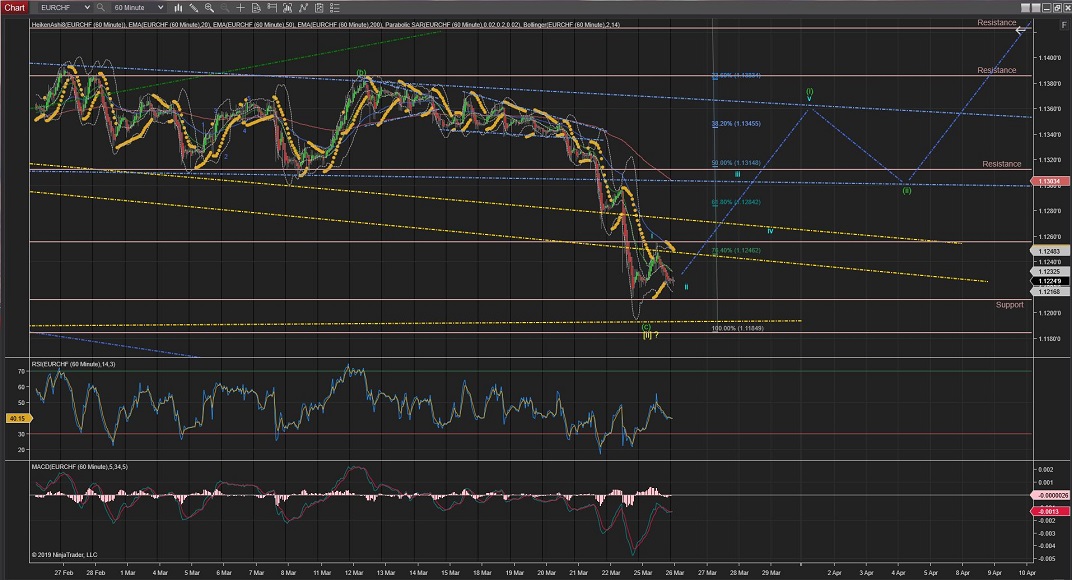
EURCHF
EURCHF has crossed the %76Fib level of retracement and possibly heading lower towards the lower yellow trend, which is just before the 0Fib level of retracement, to complete Wave [ii].
(any move lower would invalidate the current count)
Since then it has developed what appears to be a Wave i up and now might be completing its Wave ii correction; If Wave iii continues higher and crosses the highest of Wave i at 1.1255 it will signal that Wave (i) is underway and Wave[ii] possibly completed..
From Wave [ii] completion we should start seeing impulsive waves to the upside which would offer an opportunity to enter Wave [iii] to the upside.
60Mins
4Hours
Daily
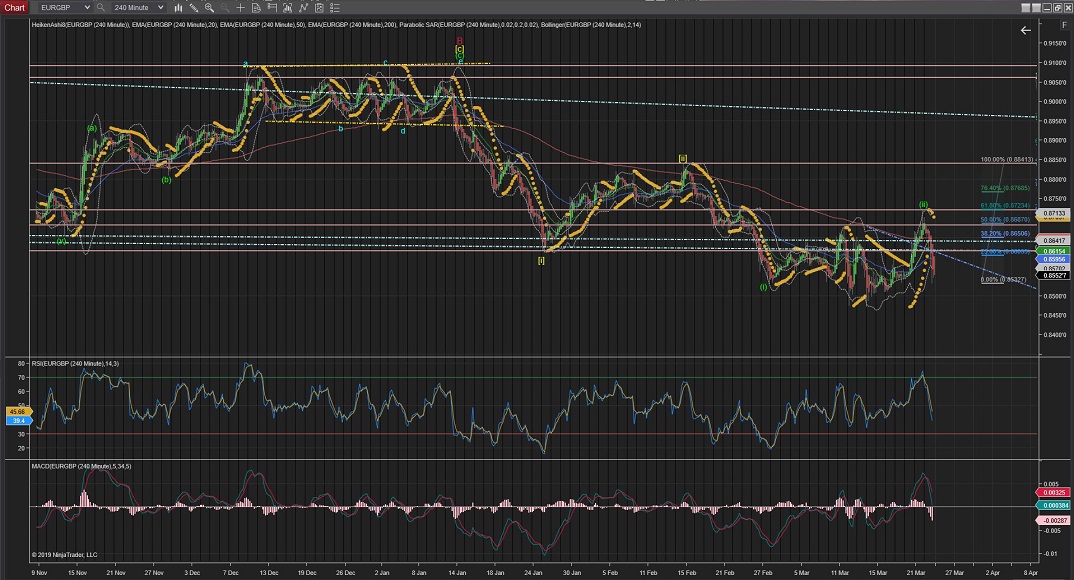
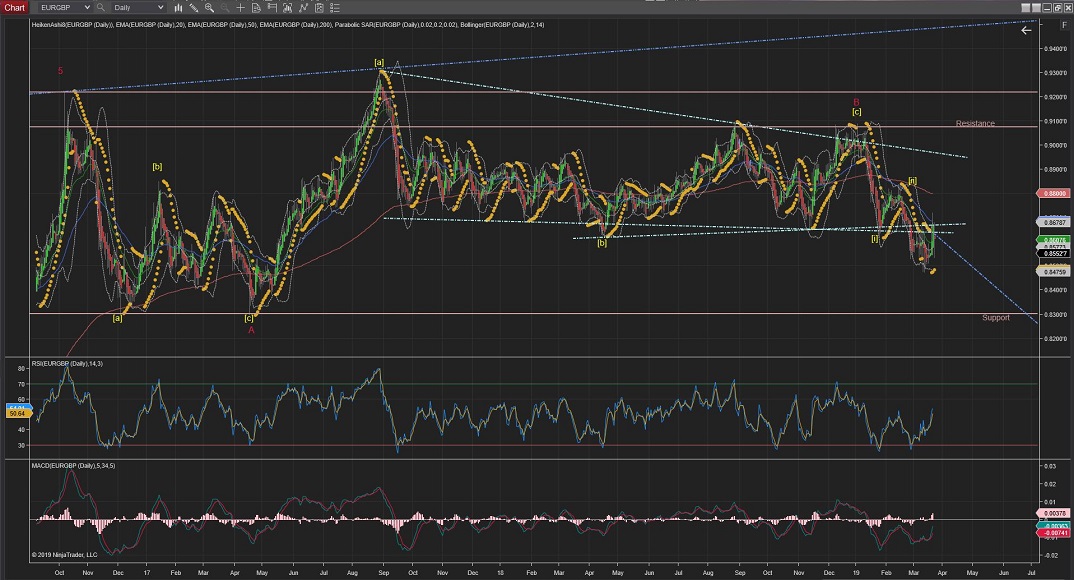
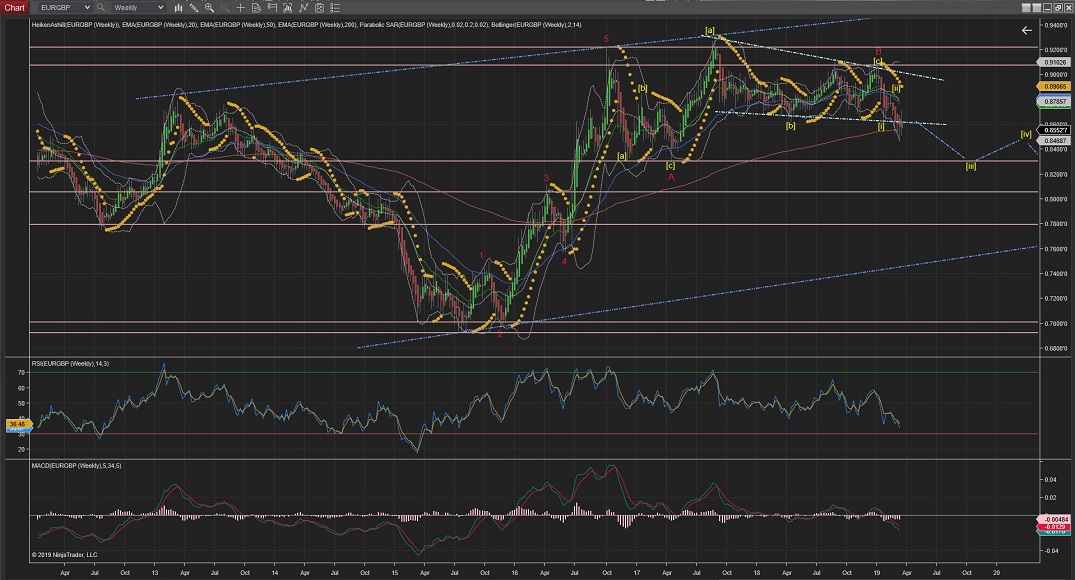
EURGBP
EURGBP is showing to have completed 3 Waves to the downside and now having Wave 4 correction could be completed.
Next Wave v should drop the price lower, possibly towards the next level of support (0.8473) to complete Wave i.
Once Wave i is completed, possibly at the next big area of support (0.8473 area), Wave ii correction will take place.
60Mins
4Hours
Daily
Weekly
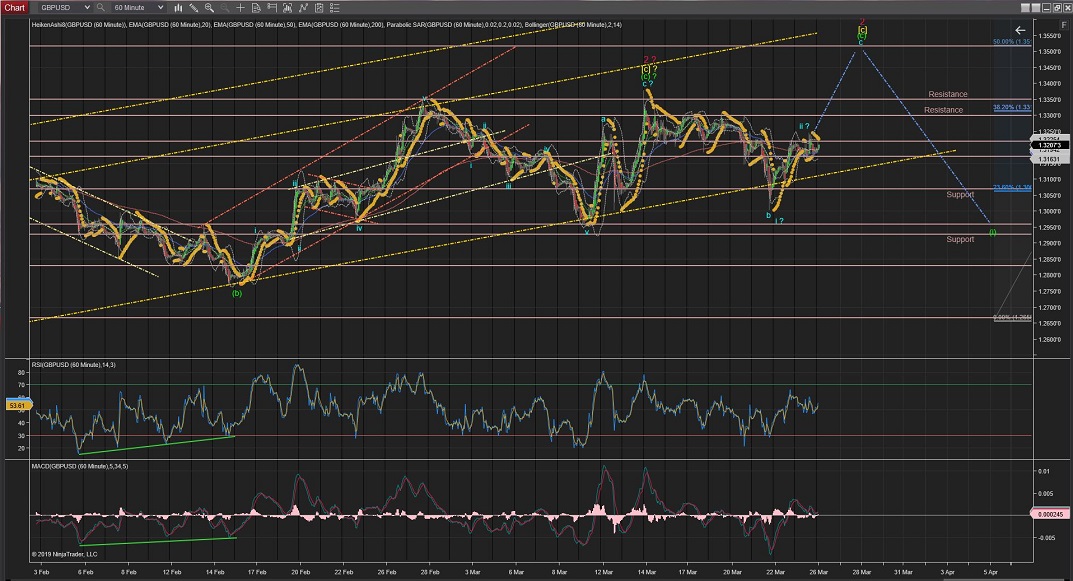
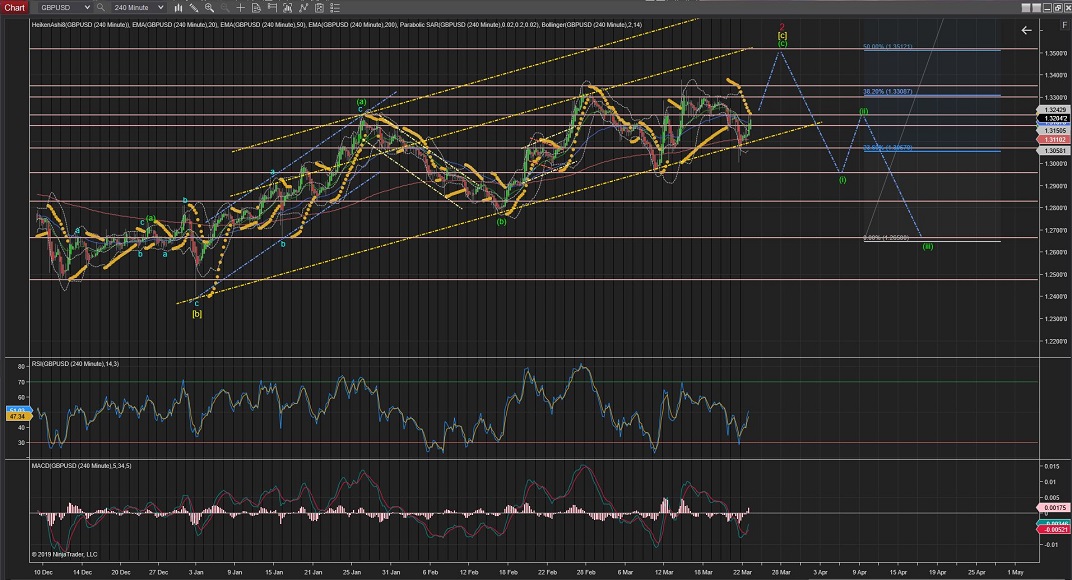
GBPUSD
GBPUSD although has not shown much price action today (a sign of correction) is still showing further moves upwards on current Wave c to complete Wave 2(red) in the upper yellow trend.
The alternative count is for an already completed Wave 2(red) which will be triggered if the price now breaks through the lower yellow trend line and confirms that Wave (i) is already underway.
Further moves up would be expected for the current Wave c towards t
60Mins
4Hours
Daily
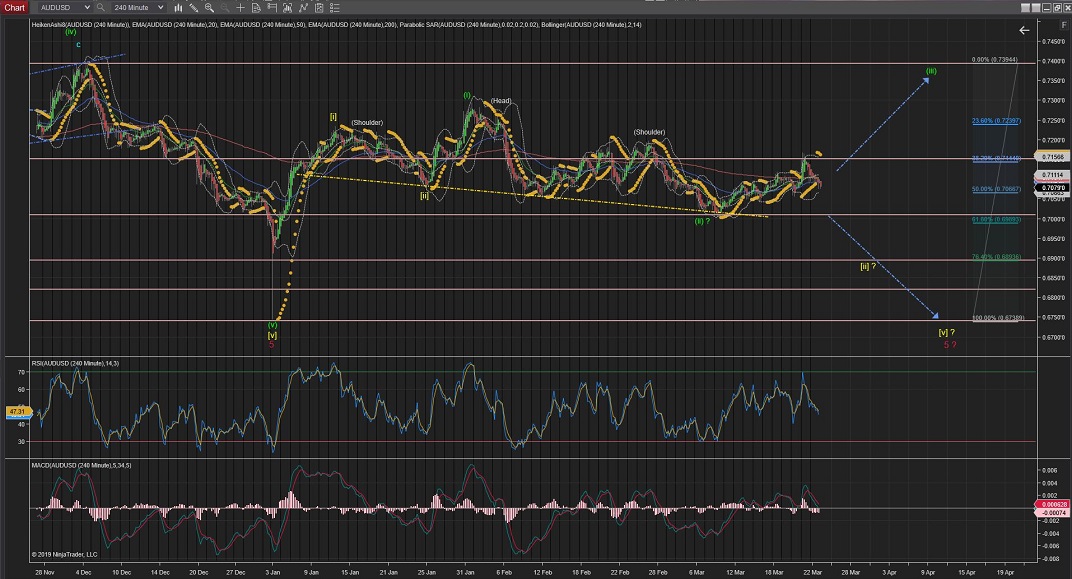
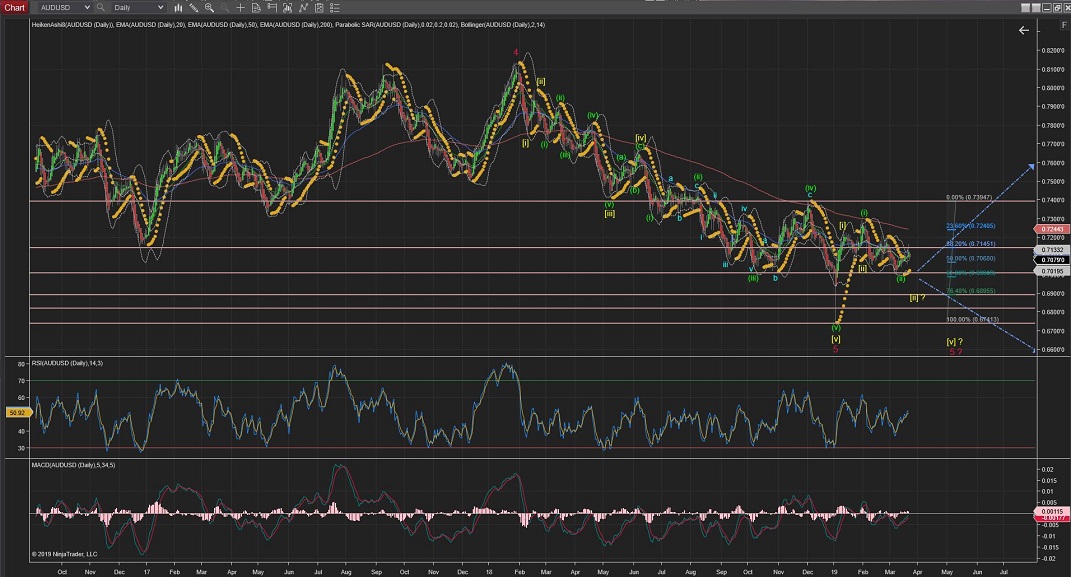
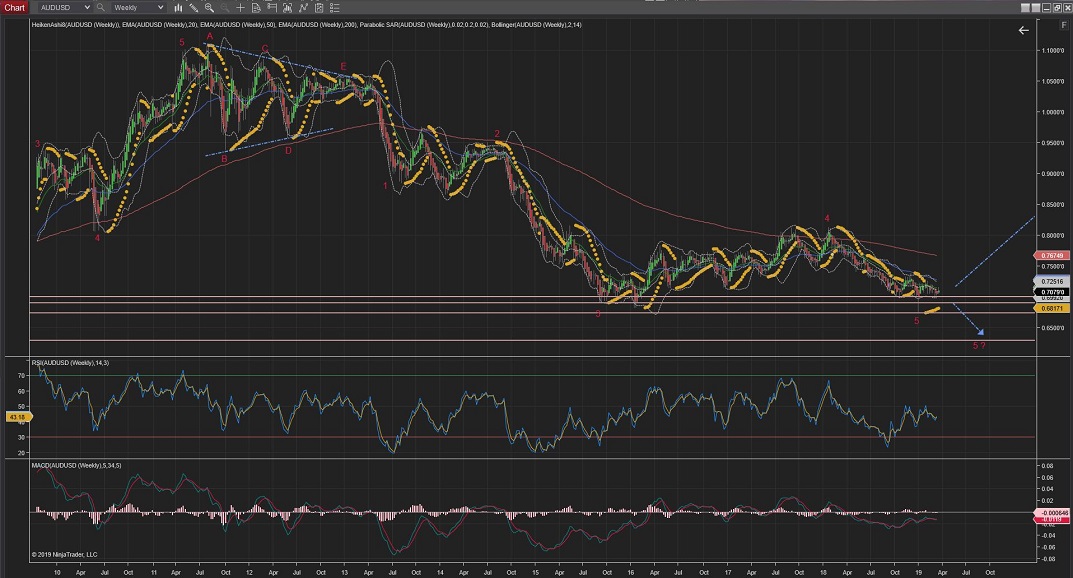
AUDUSD
Daily & 4Hour Charts:
AUDUSD 4Hour Chart is showing the price raising from the neckline of a clear Head & Shoulders pattern which is suggesting Wave (iii) could be finally making its way up.
Still not out of the woods yet, so further moves lower than this neckline would trigger the alternative count for an extended Wave [ii] goingtowards the %76 levels of support, although it is still possible an extended Wave [v] or even a further extended Wave 5, with not much resistance levels to stop the move down (best seen in the 4Hour and Daily charts) .
Hourly Chart:
The 60Min chart shows to ha completed a large Wave 2 correction for Wave iii, which suggest that Wave 3 now should continue the impulsive muves higher towards the 0.7200 area if this count is to be valid.
Further moves down would invalidate the current count and start giving indications that the alternate counts (best shown in the 4Hour and Daily Charts) could take place instead.
60Mins
4Hours
Daily
Weekly
All the best for everyone.
Andres


 Trading Waves .org