Thu 21-03-2019
Hi everyone, hope you are all ok.
USDJPY
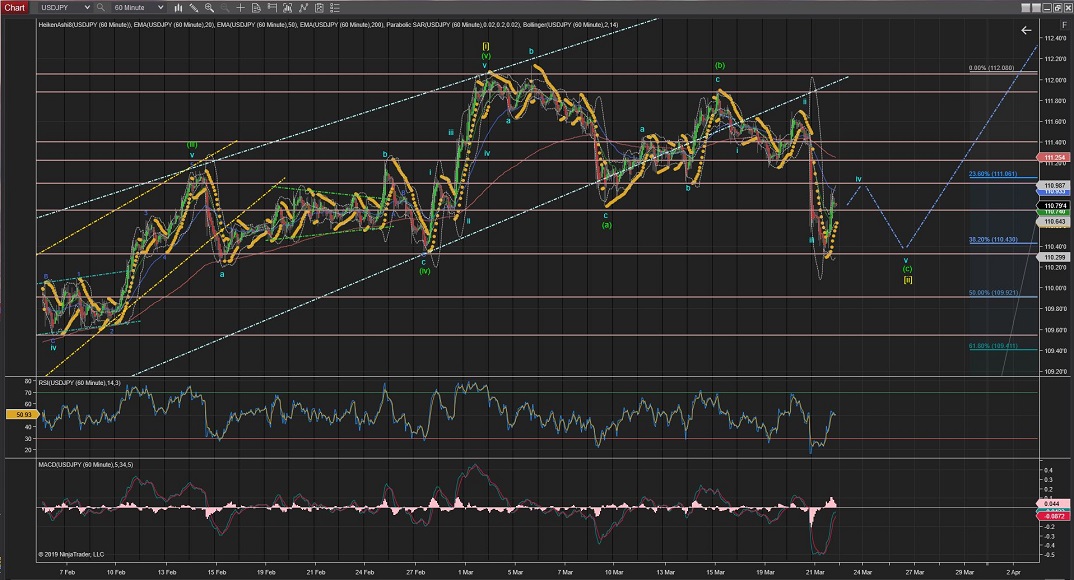
USDJPY has completed Wave iii of corrective Wave (c) (of Wave [ii]), as shown in the 60Min and 4Hour Charts).
Now corrective Wave iv is underway (possibly towards the 111.00 area).
Upon Wave iv completion, Wave v should drop lower towards lower support levels (%38Fib at 110.40 or %50Fib at the 110.00 levels).
60Mins
4Hours
Daily
Weekly
USDCAD
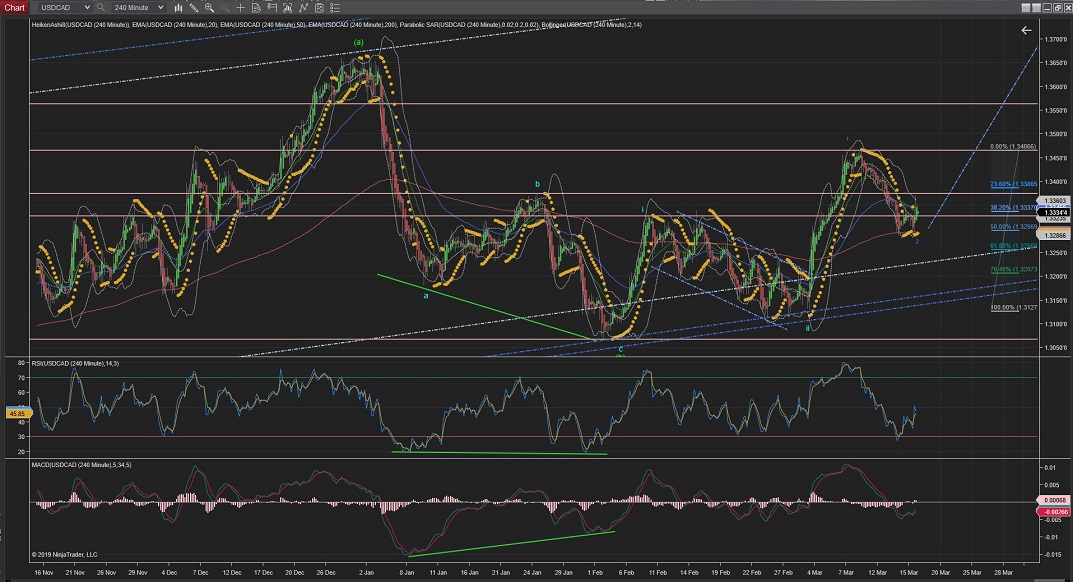
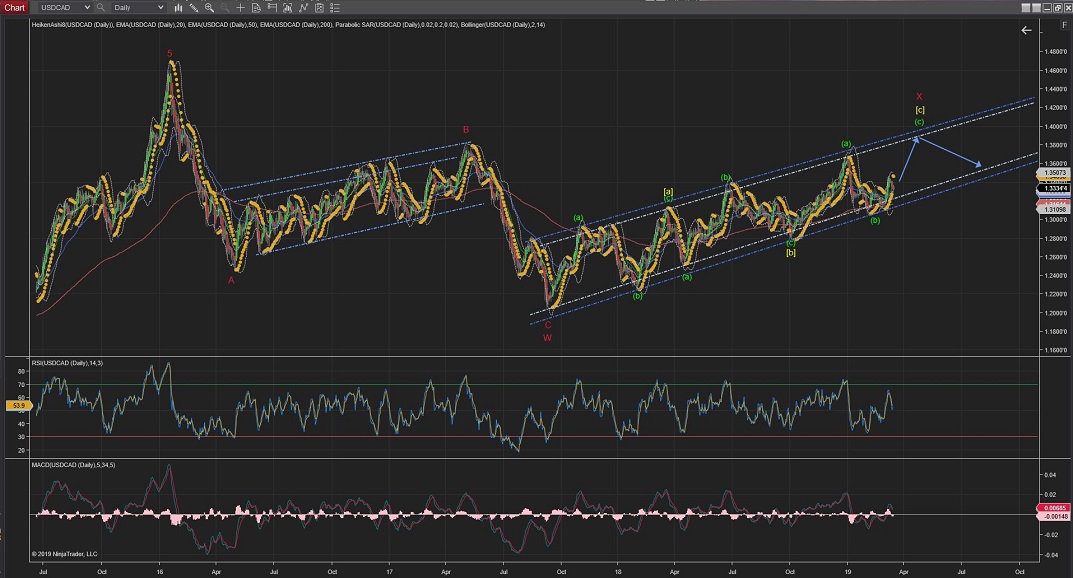
USDCAD completed Wave (ii) of Wave 3 and Wave (iii) should carry the impulsive moves up pass the current Resistance.
Wave 3(blue) will be confirmed as soon as it crosses the highest of Wave 1(blue) at 1.3466.
60Mins
4Hours
Daily
USDCHF
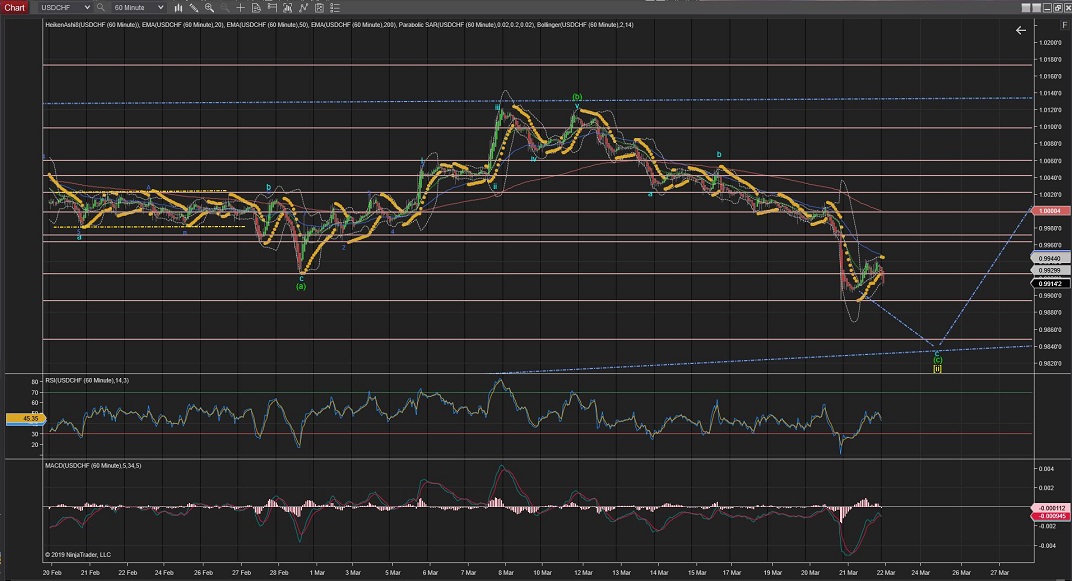
USDCHF triggered the alternative count for a larger Wave [ii] yesterday.
And the price is still heading down towards the lower long-term trend line again to complete Wave [ii] at the %62 Fib retracement (best shown in the 4Hour Chart).
60Mins
4Hours
Daily
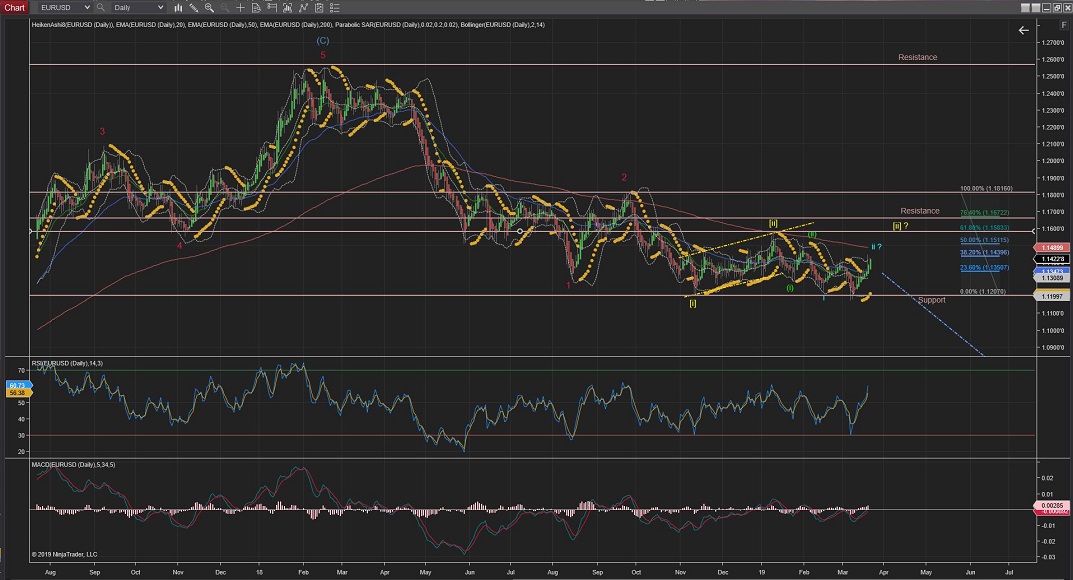
EURUSD
EURUSD today's impulsive move to the downside after Wave ii correction reached the %76 Fib retracement signalled Wave iii started..
If the price carries on moving downwards impulsively, after the current Wave (ii) correction it would signal strongly that Wave iii down has finally started and a move lower from the lowest of today's Wave (i) would confirm Wave (iii) of Wave iii.
Although, if the price carries on raising it would call for an extended Wave [ii] correction (best shown on the 4Hour and Daily Charts) towards the %62 Fib retracement (at the 1.1584 area).
60Mins
4Hours
Daily
EURCHF
EURCHF has made me to change the count again what a consider a very frustrating corrective Wave [ii].
The wedge has breakout to the downside and pierced through the first level trend line (yellow) at the %62 Fib level and, possibly heading towards the second trend level at the %76 Fib levels.
Strong impulsive waves up from that trend would confirm that Wave [ii] is complete and Wave [iii] would take over to the upside..
60Mins
4Hours
Daily
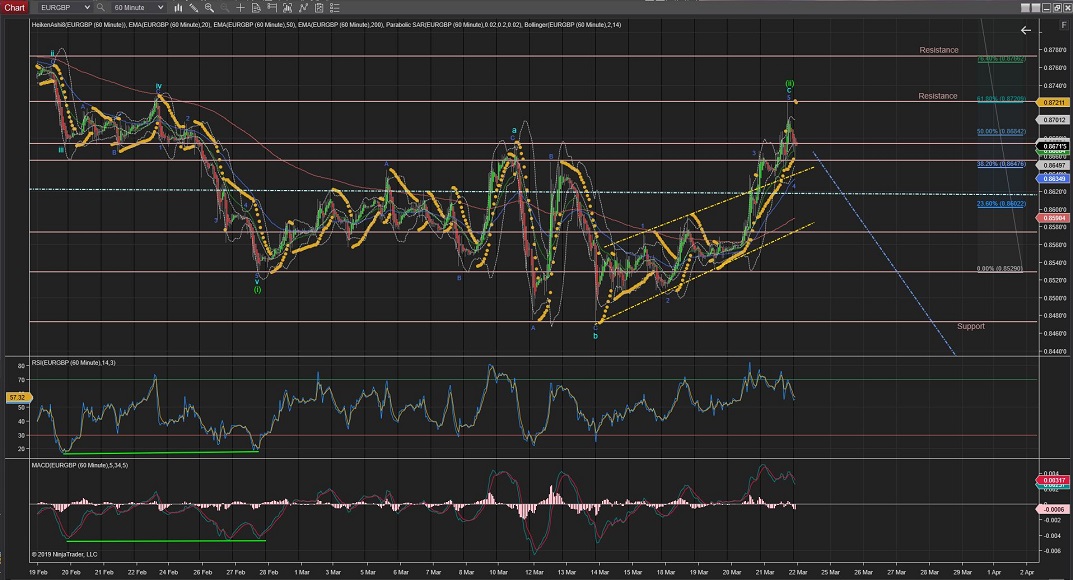
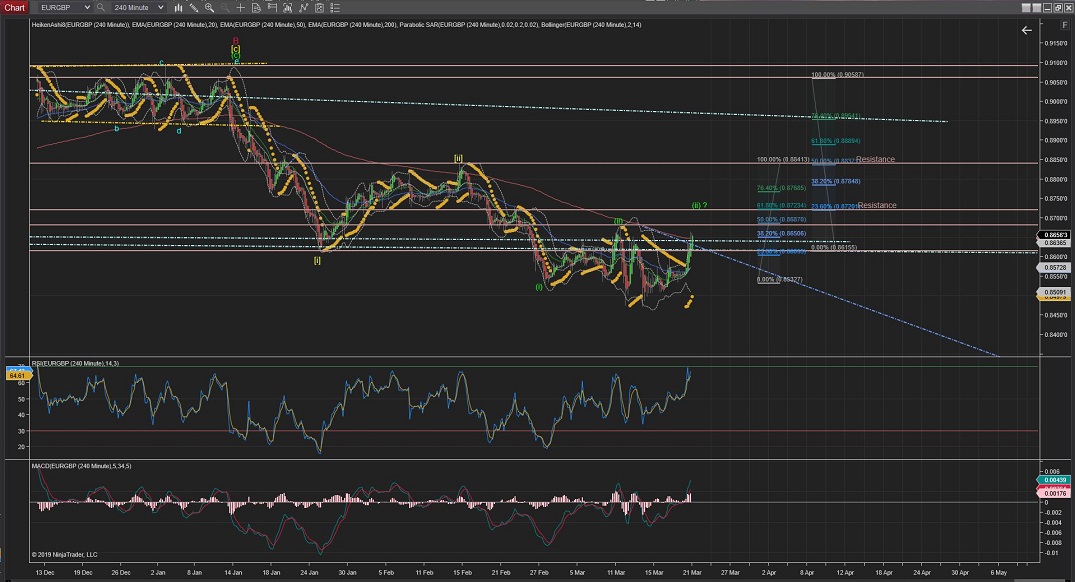
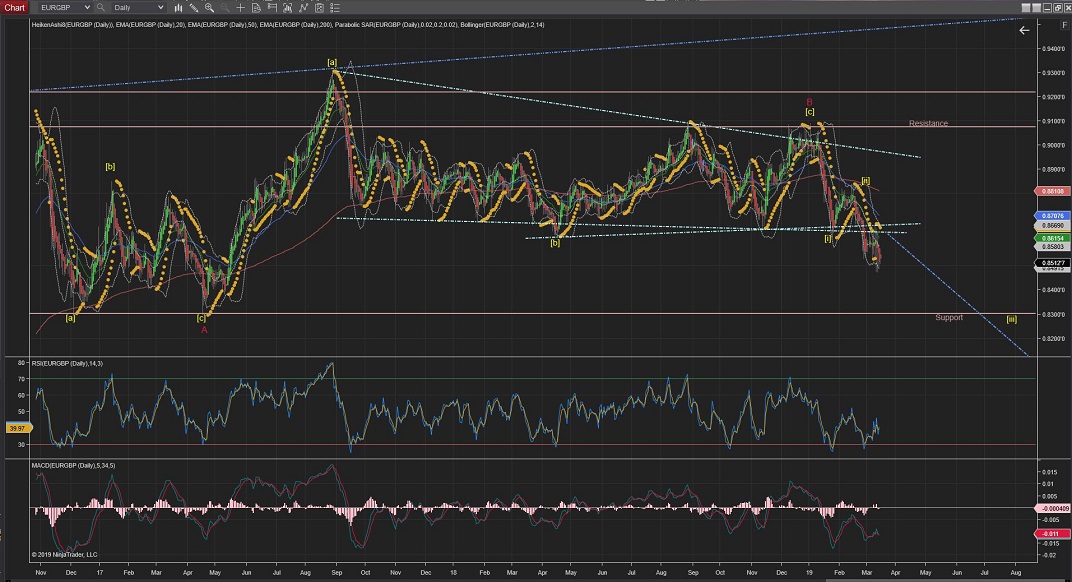
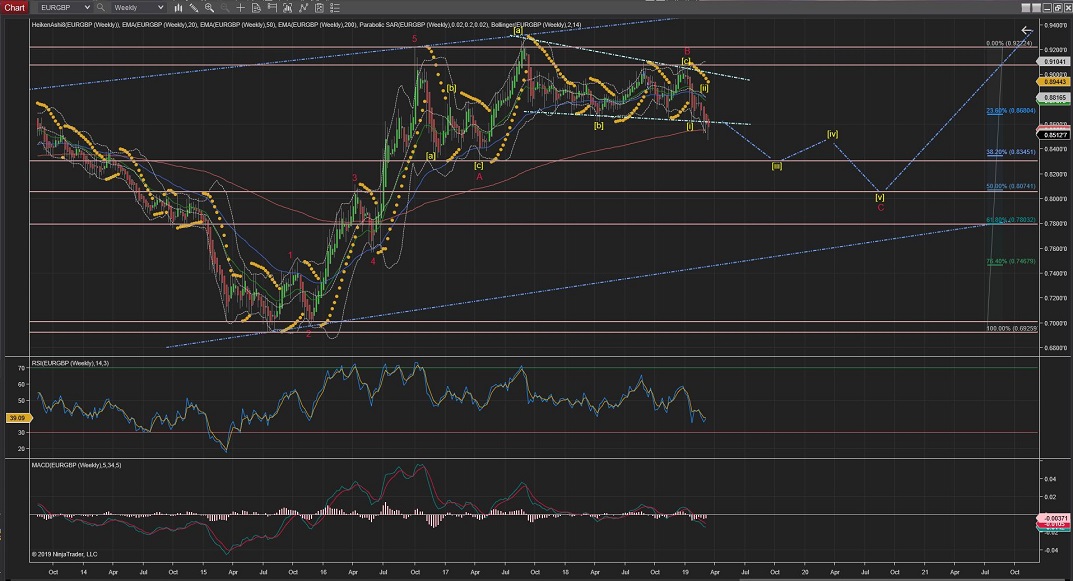
EURGBP
EURGBP invalidated the previous count and has shown to have completed a Wave (ii) in a Flat correction (3,3,5) (as shown in the current 60Min Chart count).
This count calls for Wave (ii) to have completed at the %62Fib Level and Wave (iii) to start the impulsive moves either now or after a further raise towards the %76Fib area.
60Mins
4Hours
Daily
Weekly
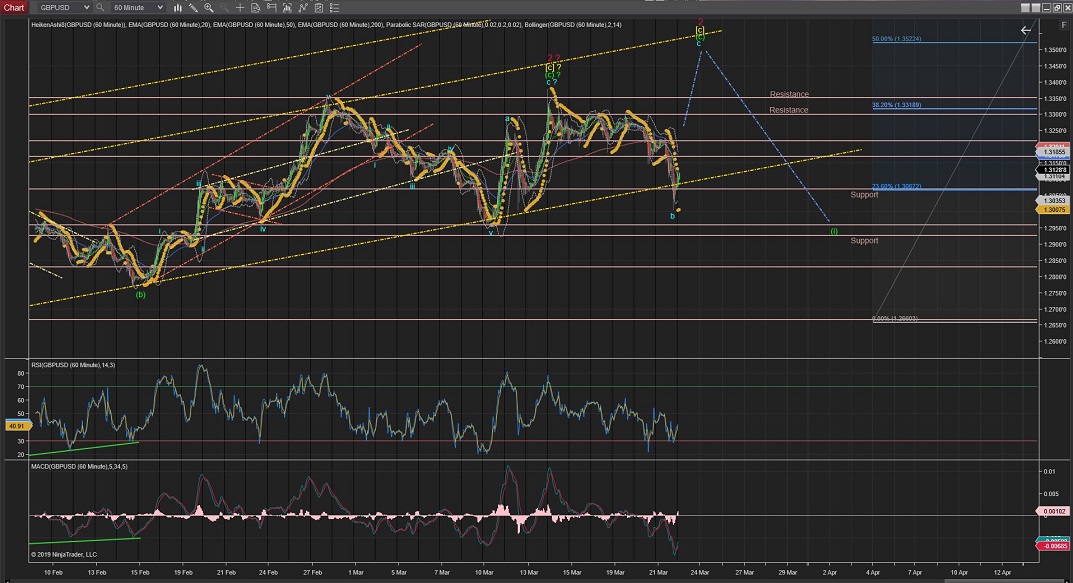
GBPUSD
GBPUSD move down still seemed corrective in nature and the bounce from support indicates another raise to complete Wave c before Wave (i) starts.
Only impulsive waves to the downside will give a good suggestion that the trend has changed to the downsideand Wave 2(red) has been completed.
The alternative count is for an already completed Wave 2(red) which will be triggered if the price now fails to raise for its completion and confirms that Wave (i) is already underway.
60Mins
4Hours
Daily
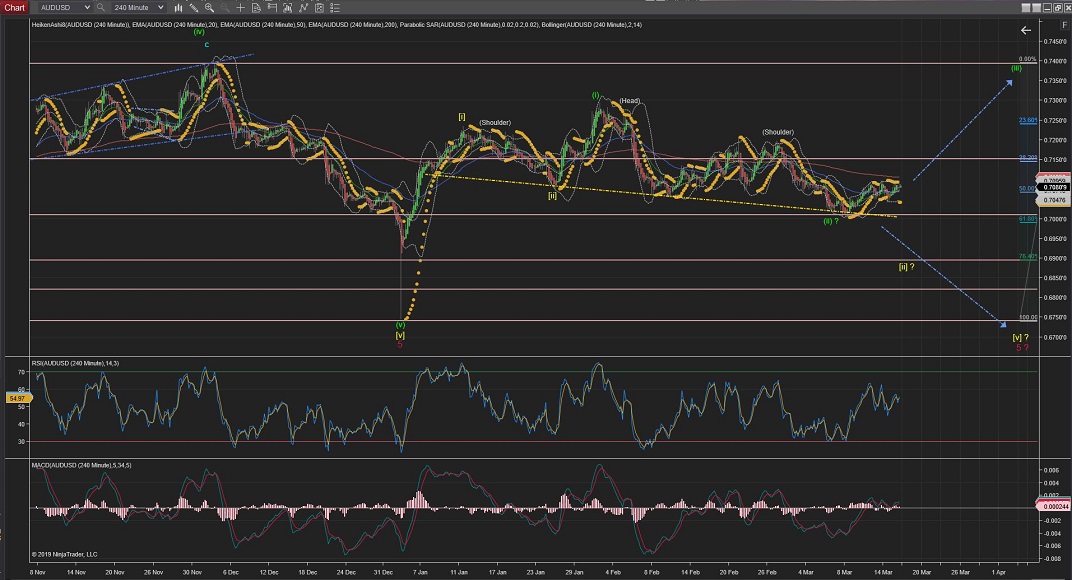
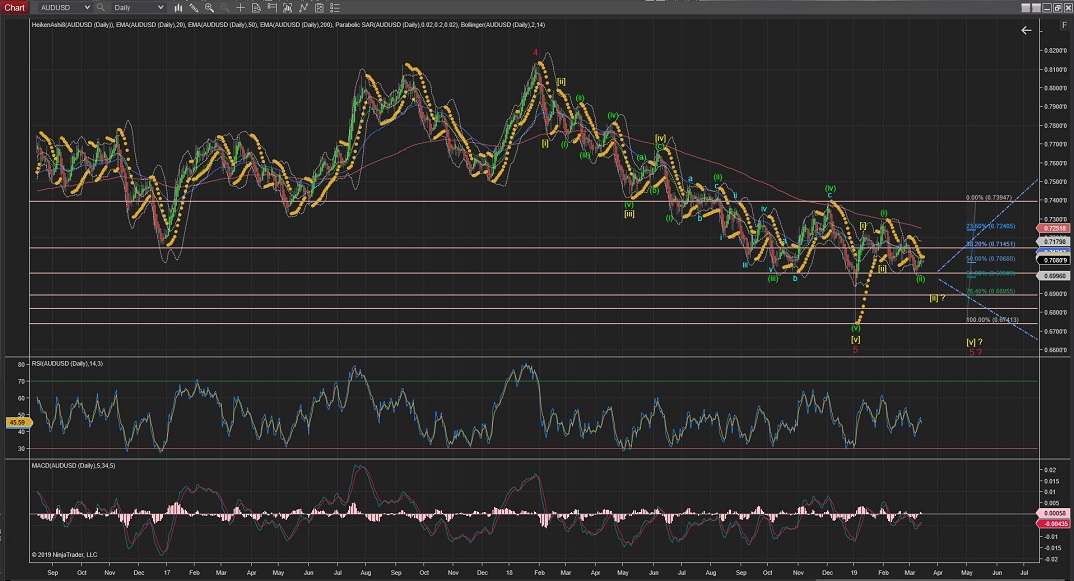
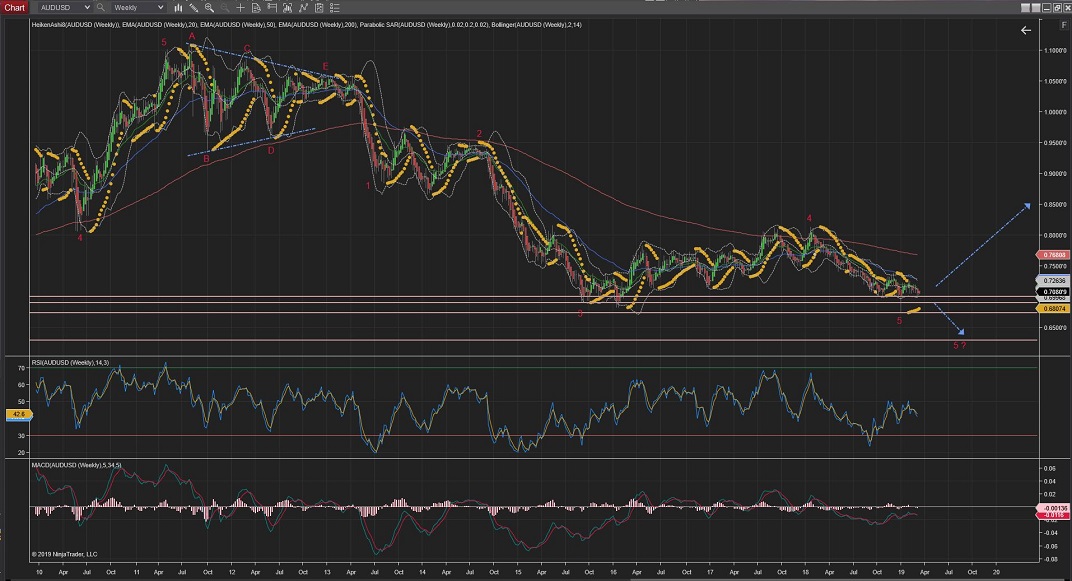
AUDUSD
Daily & 4Hour Charts:
AUDUSD 4Hour Chart is showing the price raising from the neckline of a clear Head & Shoulders pattern which is suggesting Wave (iii) could be finally making its way up.
Still not out of the woods yet, so further moves lower than this neckline would trigger the alternative count for an extended Wave [ii] going towards the %76 levels of support, although it is still possible an extended Wave [v] or even a further extended Wave 5, with not much resistance levels to stop the move down (best seen in the 4Hour and Daily charts) .
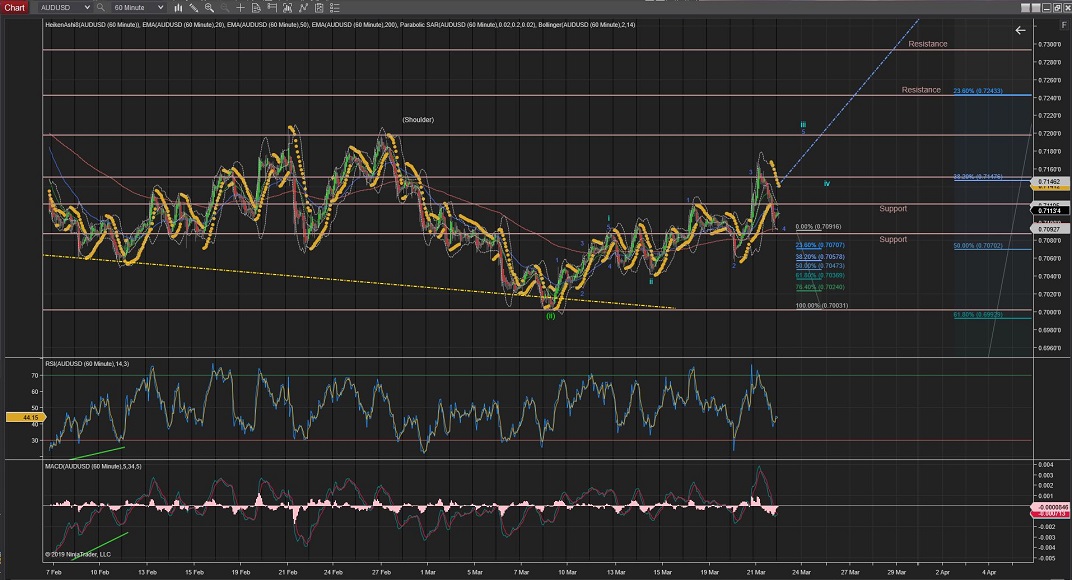
Hourly Chart:
The 60Min chart shows to have completed an internal 5 wave structure for the first Wave i up.
Completed a correction for Wave ii between the %50 and %62 Fib retracement.
And now has completed a further Wave 1, Wave 2, Wave 3 and Wave 4 (blue) for Wave iii with a target at the 0.7200 Resistance above.
Once Wave iii is completed we should see a Wave iv correction take place towards supports above previous lower degree Wave 4(blue).
60Mins
4Hours
Daily
Weekly
All the best for everyone.
Andres


 Trading Waves .org