Wed 13-03-2019
Hi everyone, hope you are all ok.
USDJPY
USDJPY broke out of the trend after hitting the last resistance.
I have changed the count after this corrective move for a double correction where the price is now going through Wave Y correction to complete Wave ii.
Further moves lower than the 0 Fib would invalidate the current count and call for the alternate count of Wave [iv].
60Mins
4Hours
Daily
Weekly
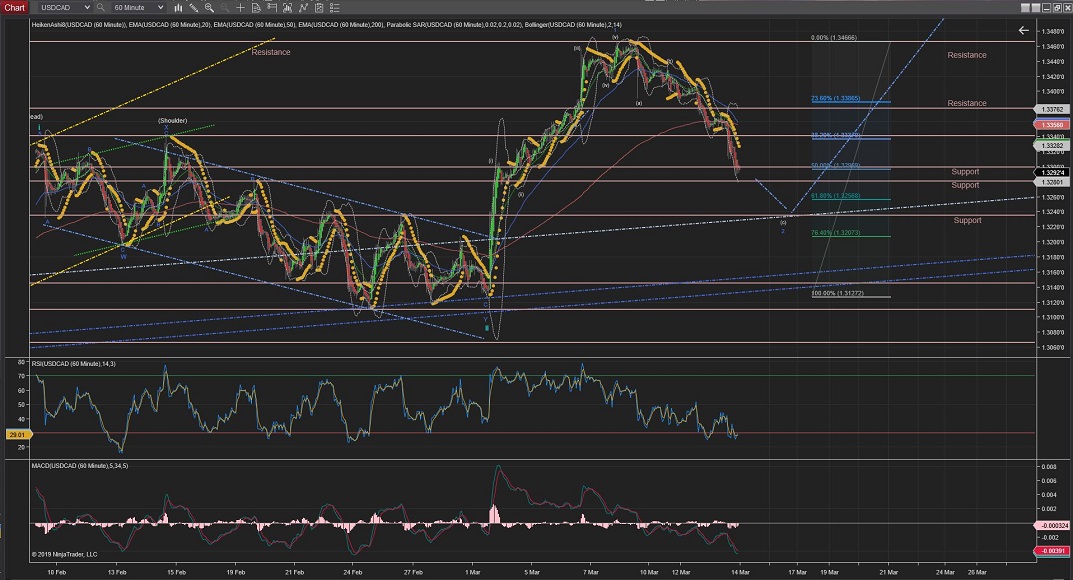
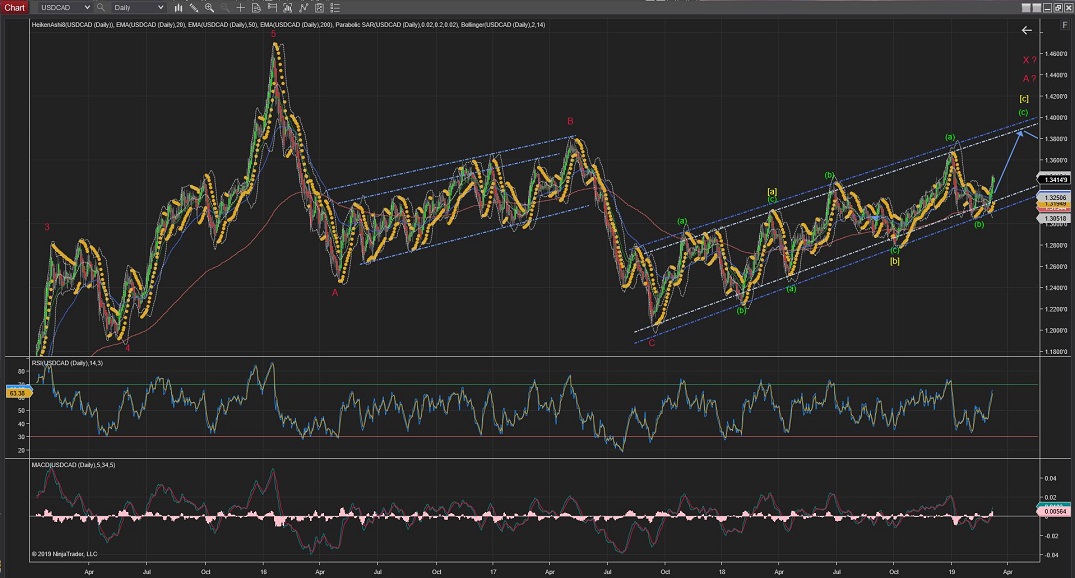
USDCAD
USDCAD triggered an alternate count for an extended Wave 2 within Wave iii.
The price has stopped at the %50 Fib Retracement level, although it could be heading towards the lower trend line (light blue) for a %62 or %76 Fib retracment level before it concludes this correction and starts Wave 3 to the upside.
60Mins
4Hours
Daily
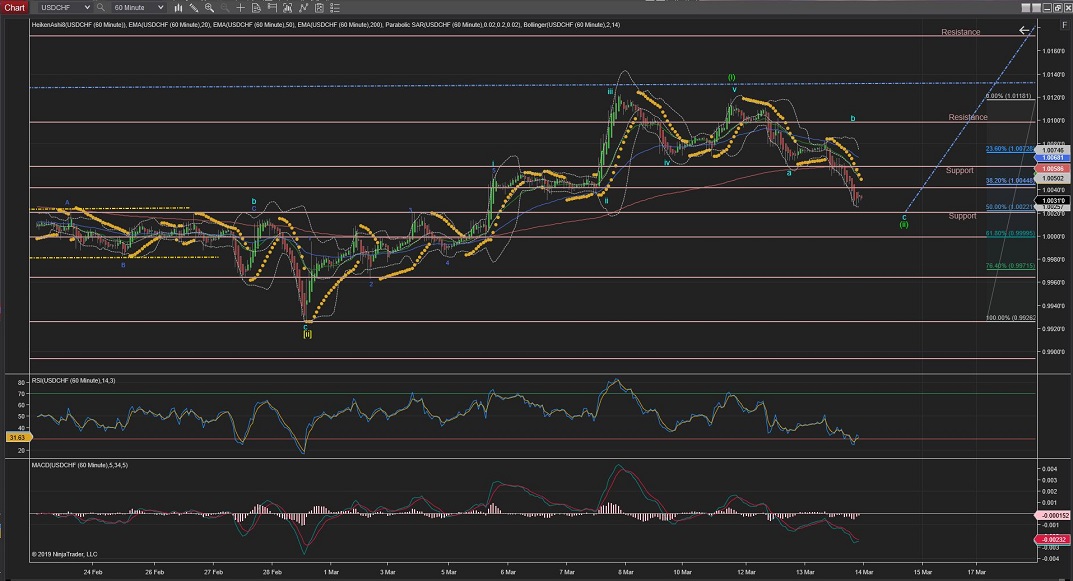
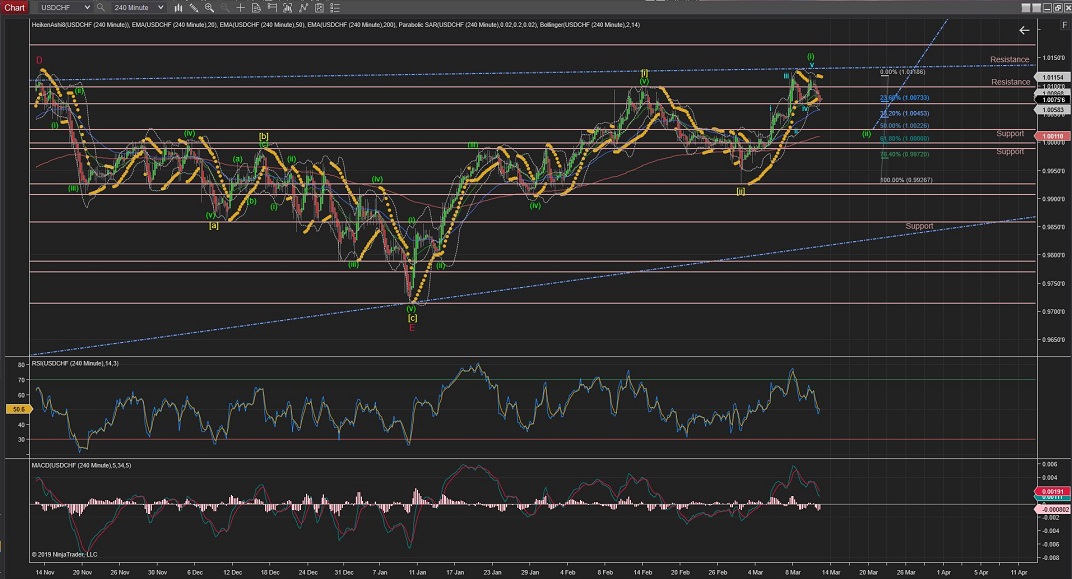
USDCHF
USDCHF is now going through the last leg of Wave c to complete Wave (ii) ZigZag (5,3,5) correction.
Once Wave (ii) is completed the price should raise in impulsive waves to continue with Wave (iii).
60Mins
4Hours
Daily
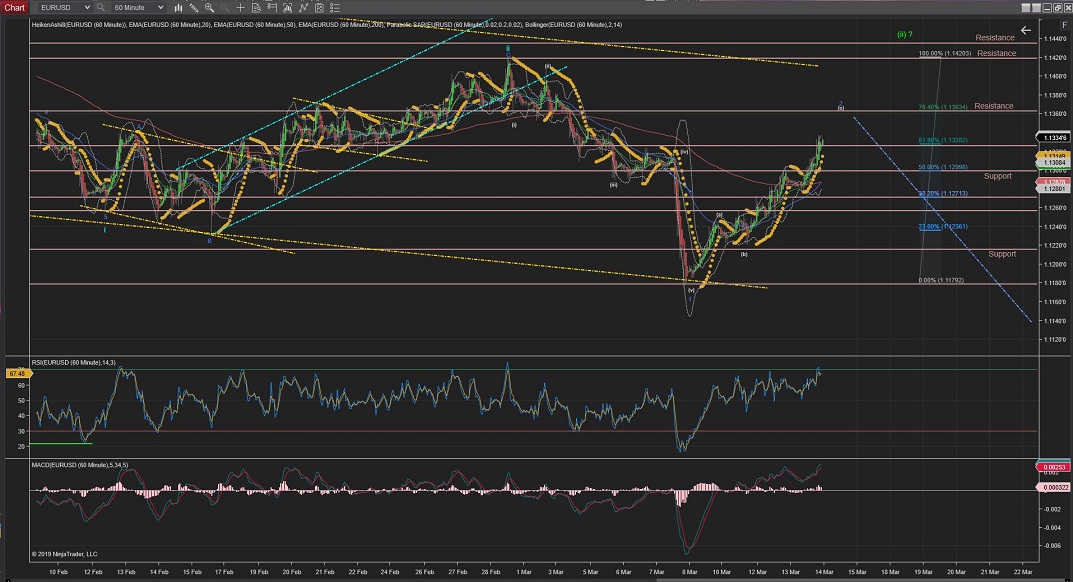
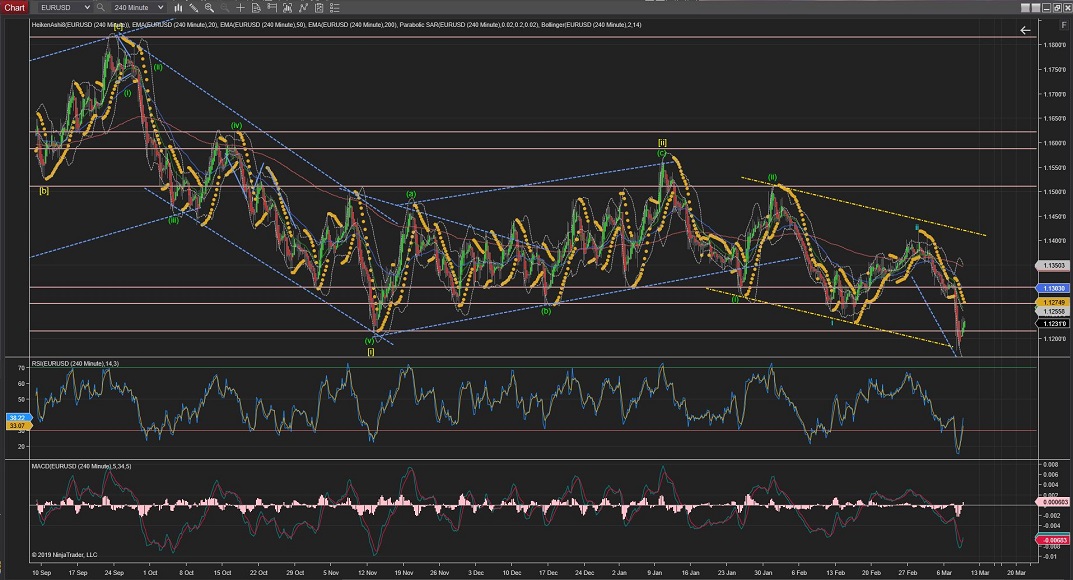
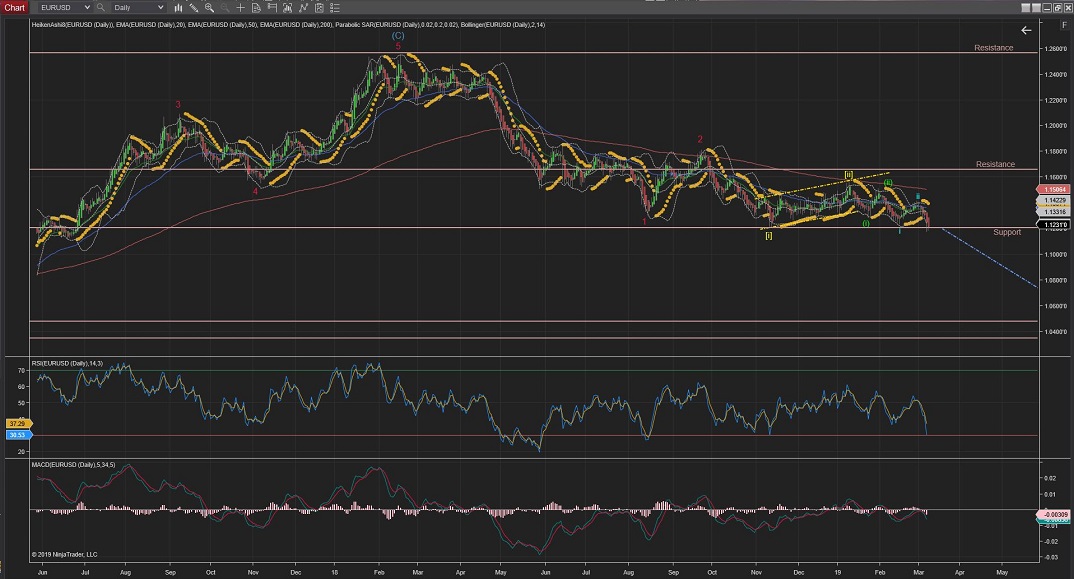
EURUSD
EURUSD keeps raising and, against what I thought yesterday, has not yet completed Wave 2 correction at the %50 or the %62 Fib retracement levels.
Instead it is heading towards the %76, although could also be heading to trigger the alternate count for an extended Wave (ii)
(that would not be triggered unless the price crosses the 0 Fib retracement of Wave 1 (blue)).
As per current count; Once Wave 2 is completed, Wave 3 should continue the impulsive Waves down and break through the lower trend line (yellow) and lower support levels.
60Mins
4Hours
Daily
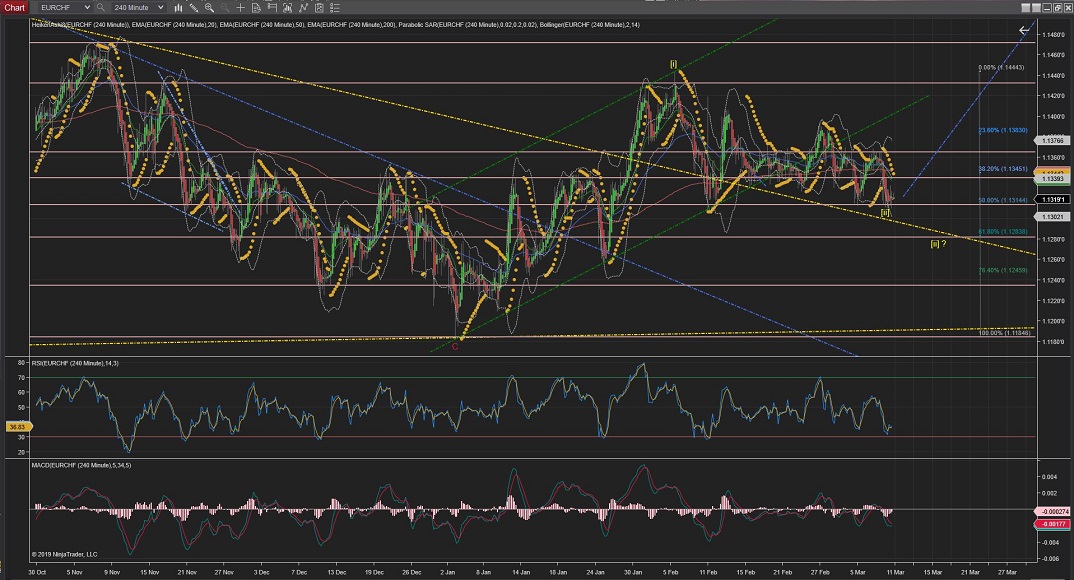
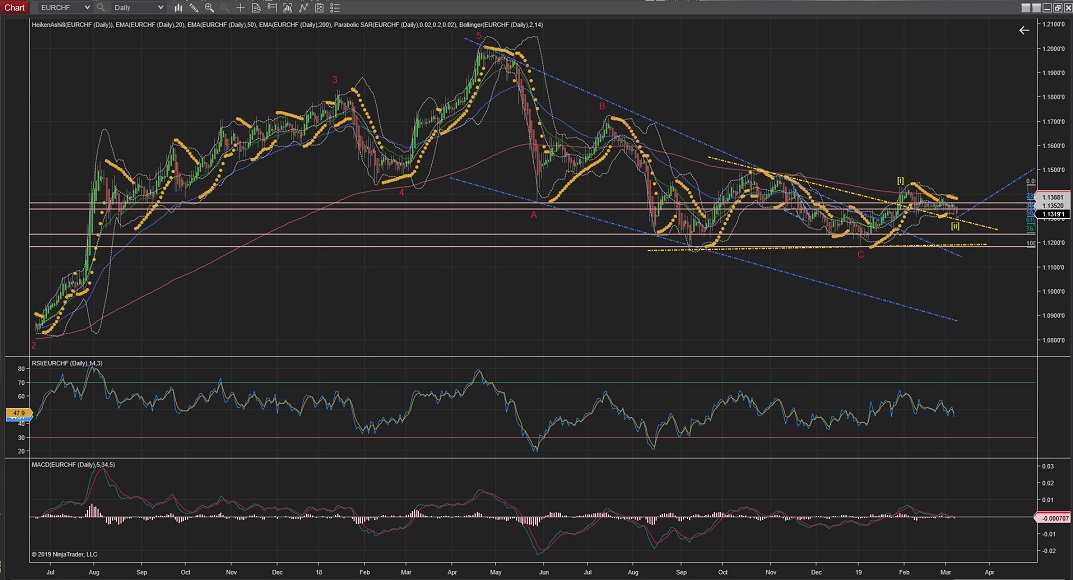
EURCHF
EURCHF has moved very impulsively on Wave iii through its internal Wave 3.
And it has now completing a small correction for Wave 4 within a triangle formation.
So, once Wave 4 is finally completed, I would expect the price to rally again towards the upper trend line to complete Wave iii.
Once, Wave iii is completed the price should drop back again towards previous lower degree Wave 4 levels.
60Mins
4Hours
Daily
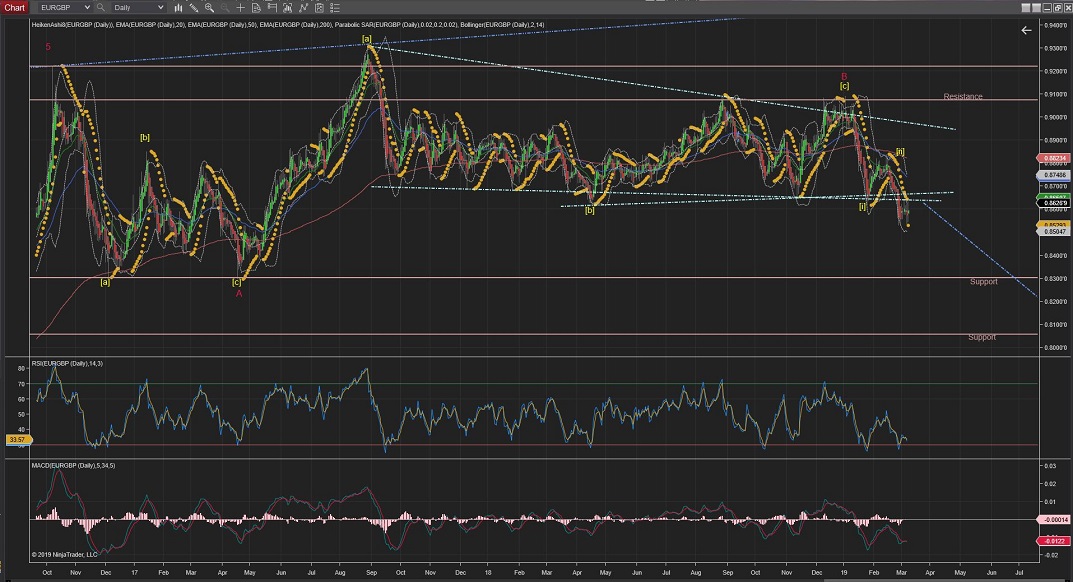
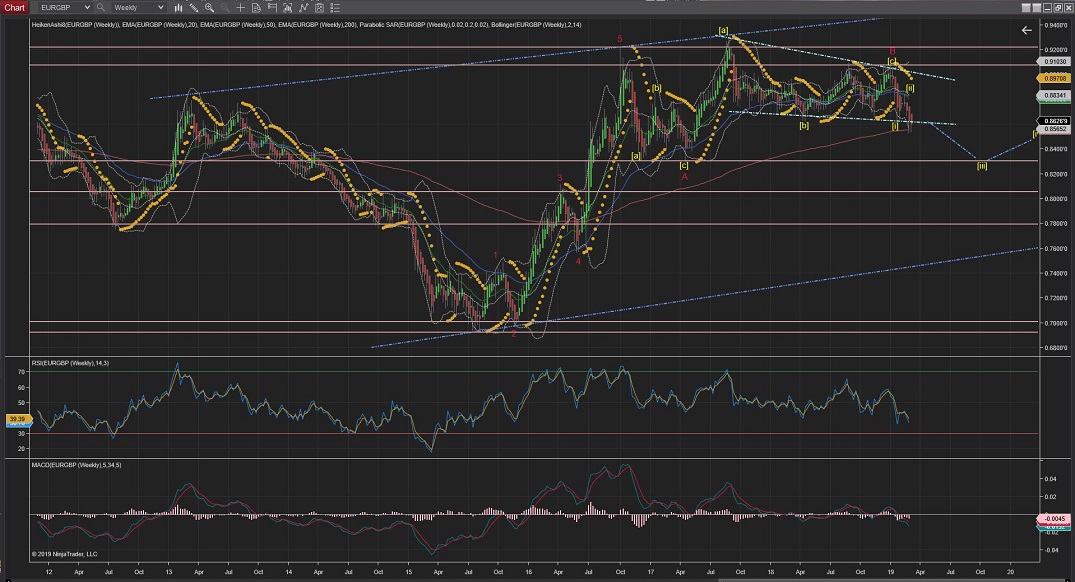
EURGBP
EURGBP seem to have completed the corrective Wave 2 between the %76 and the 0 Fib retracement area.
Any move up further than the highest of Wave (ii) would trigger the alternate count for an extended Wave (ii).
As the current count stands I would expect to see a drop in the price for Wave 3 to continue its way down through Wave (iii).
(this count would only be confirmed once it crosses the lowest of Wave 1).
60Mins
4Hours
Daily
Weekly
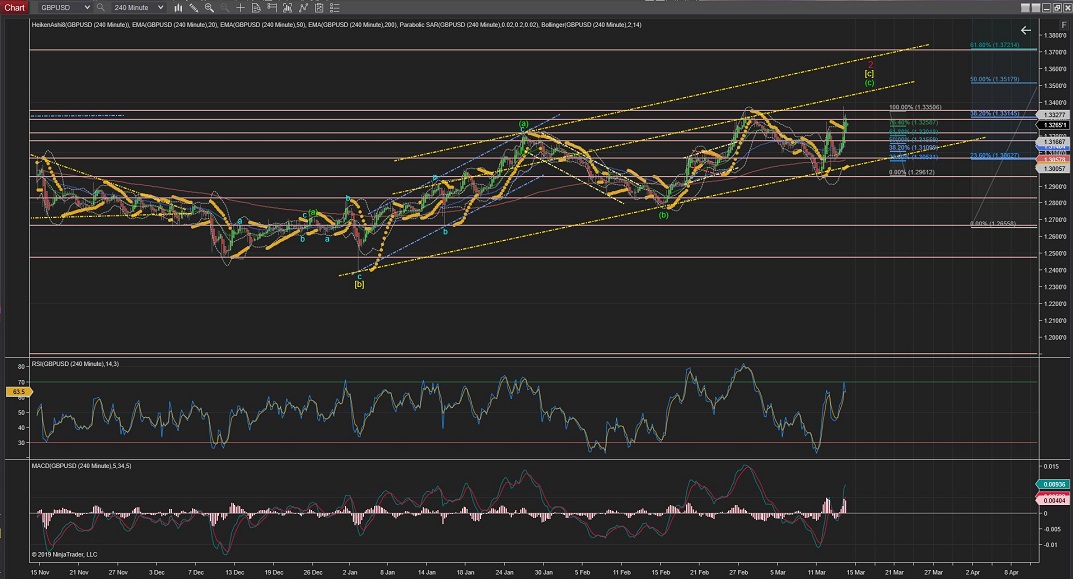
GBPUSD
GBPUSD today has triggered the alternate count for an extended Wave 2(red) and heading up towards the 1.3500 area (best pictured in the daily and 4Hour Charts) for the %50 Fib retracement area, although could also go higher for %62, if it breaks through the trade line (yellow).
If it resumes the rasing now it would have completed Wave 2(red) just above the %38.
Once the correction is completed, the price should start showing impulsive waves to the down side for Wave 3 (red) to start.
60Mins
4Hours
Daily
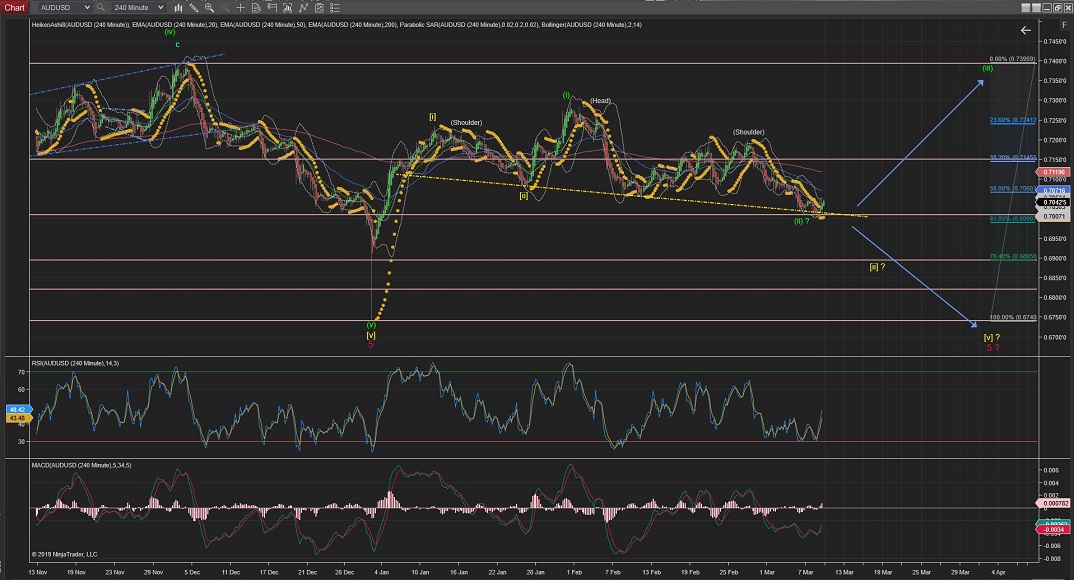
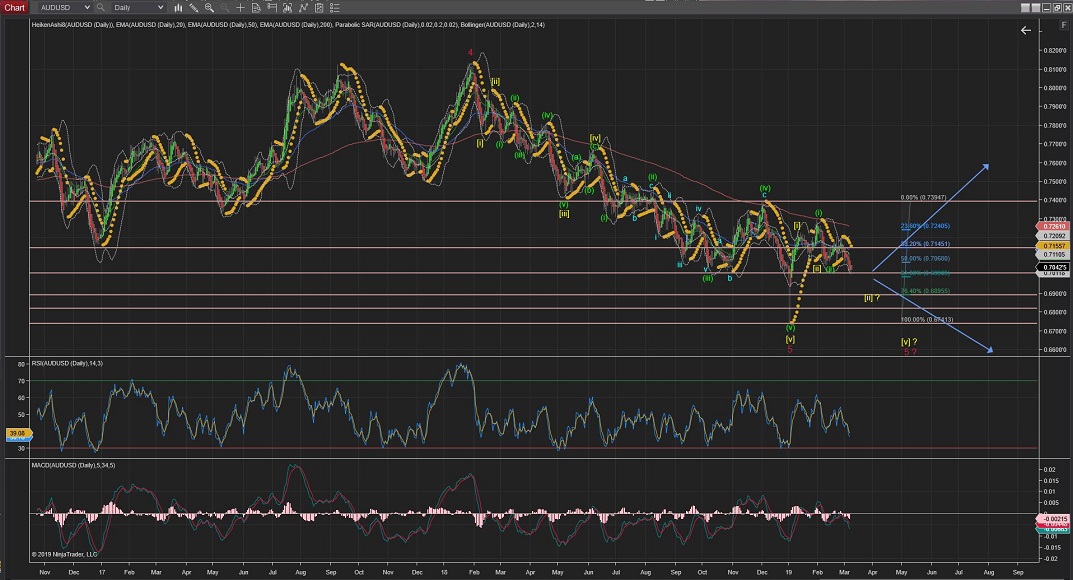
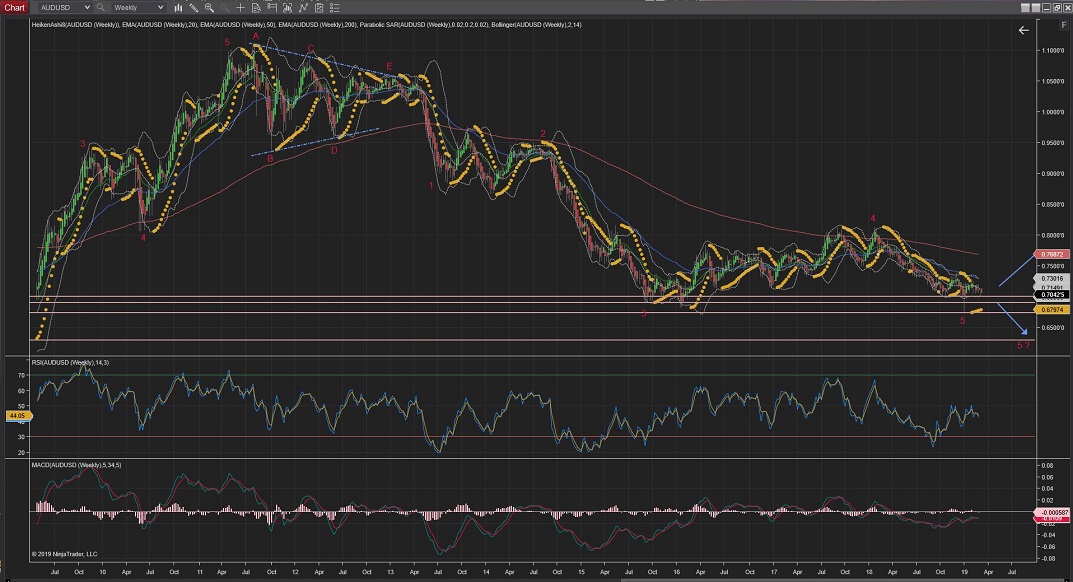
AUDUSD
AUDUSD 4Hour Chart is showing the price raising from the neckline of a clear Head & Shoulders pattern which is suggesting Wave (iii) could be finally making its way up.
Still not out of the woods yet, so further moves lower than this neckline would trigger the alternative count for an extended Wave [ii] goingtowards the %76 levels of support, although it is still possible an extended Wave [v] or even a further extended Wave 5, with not much resistance levels to stop the move down (best seen in the 4Hour and Daily charts) .
And, in the 60Min chart it shows to have completed an internal 5 wave structure for the first Wave i up.
and now completing a correction for Wave ii towards the %50 Fib retracement.
If this count is correct, we should start seeing the price to raise in wave iii upon Wave ii completion.
60Mins
4Hours
Daily
Weekly
All the best for everyone.
Andres


 Trading Waves .org