Tue 12-03-2019
Hi everyone, hope you are all ok and had a good start of the week.
USDJPY
USDJPY has completed Wave ii with an extended Wave C that reached the %76 Fib Retracement by crossing the lower trend line.
For the last 3 days the price has been entering and exiting the trend line following it alone and creating higher lows and higher highs. Which gives a bullish outlook but has not started the expected impulsive waves up for a clear start to the expected Wave iii upwards.
It might continue to do so until the next near resistance at 111.41, but once it breaks out that resistance the impulsive waves should follow as there are not further resistances until the 112.05 area.
Wave iii (of Wave (iii)) has the target at the upper trend line around the 113.06 area (best pictured in the 4Hour Chart).
60Mins
4Hours
Daily
Weekly
USDCAD
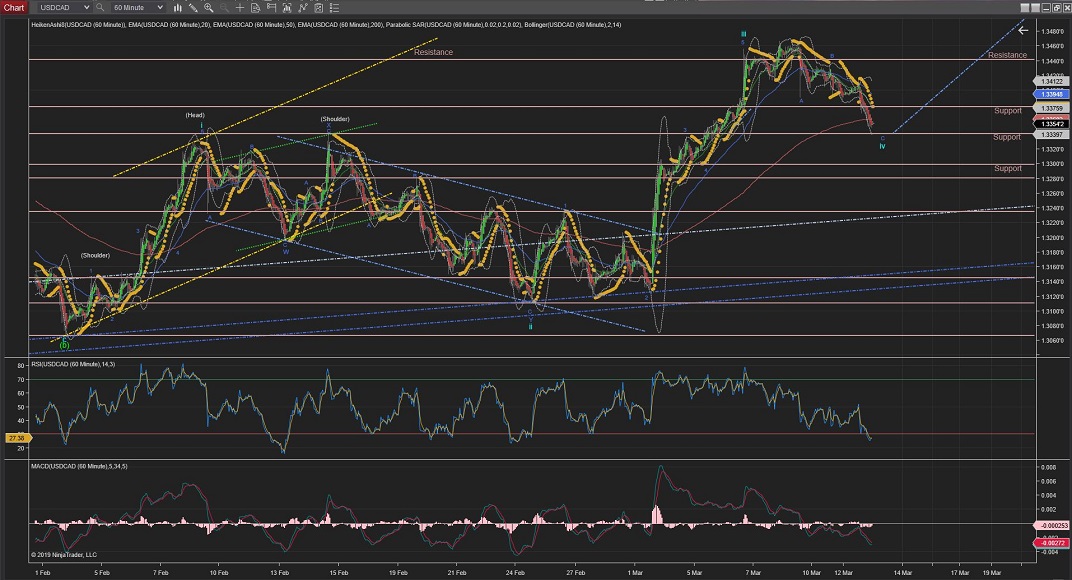
USDCAD is about to complete the Wave C of Wave iv towards Support area of 1.3340.
This support area should hold for being the highest point of Wave i for this count to be correct.
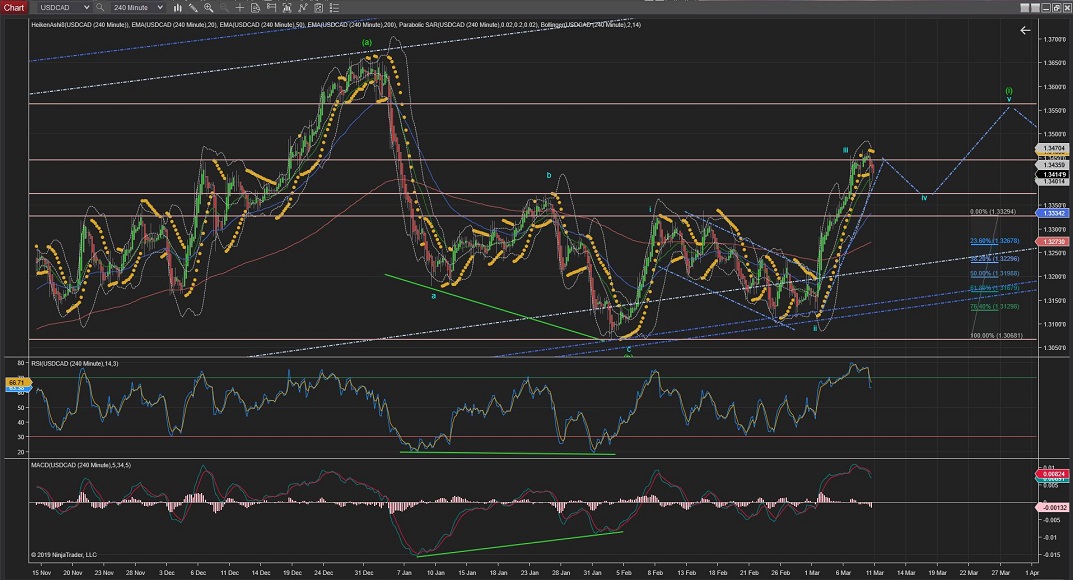
Once Wave iv completed, Wave v should start raising impulsively towards the 1.3562 area, as the next resistance area after the highest of Wave iii (best pictured in the 4Hour Chart).
60Mins
4Hours
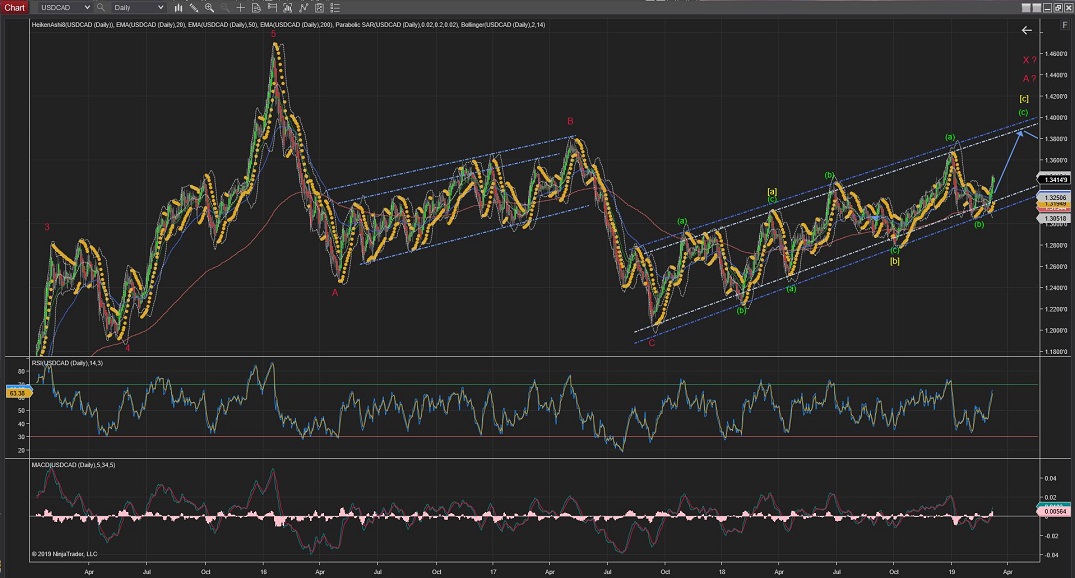
Daily
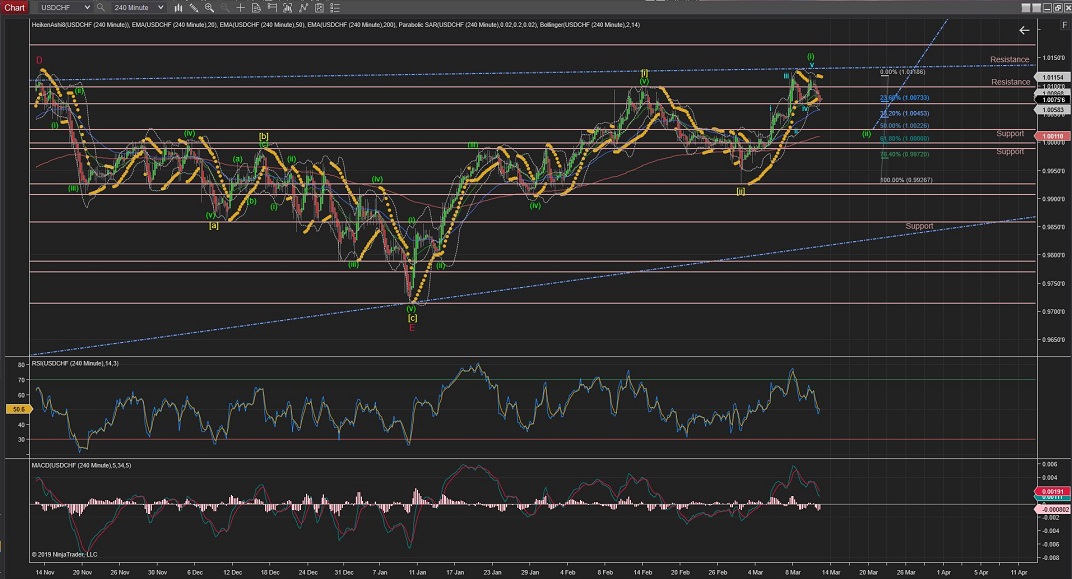
USDCHF
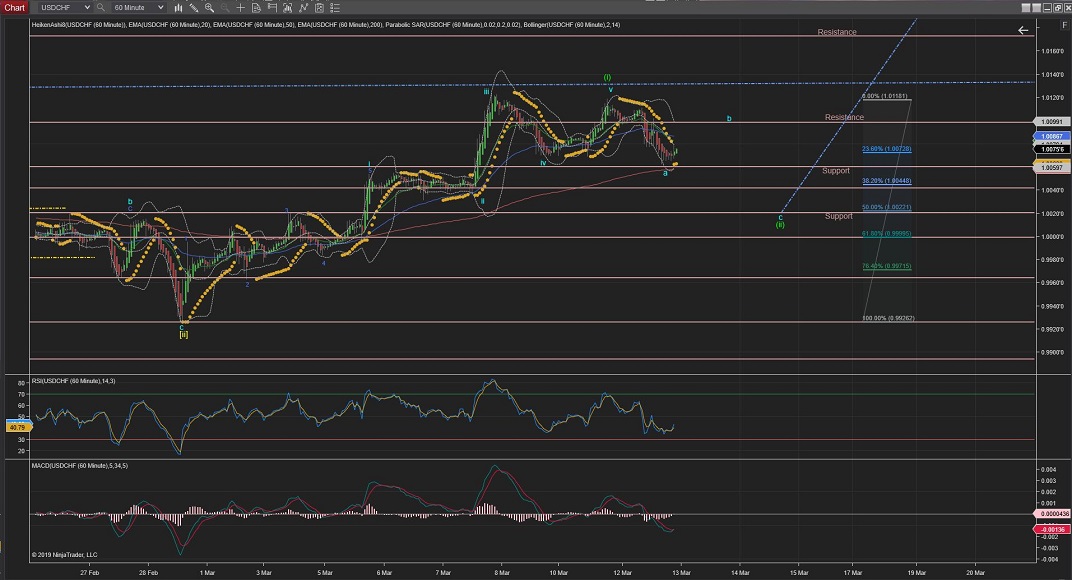
USDCHF... Apologies as yesterday I mistakenly labelled the completion of 5 waves yesterday as Wave (iii) where it should be Wave (i) of Wave [iii].
Having clear the confusion, what it is next expected is Wave (ii) correction.
And it has just completed Wave a in 5 waves, which suggest a ZigZag (5,3,5) correction.
Next would be a raise for Wave b to complete in 3 Waves and then another 5 waves for Wave c with similar length as Wave a to complete Wave (ii) around the %50 Fib retracement level
60Mins
4Hours
Daily
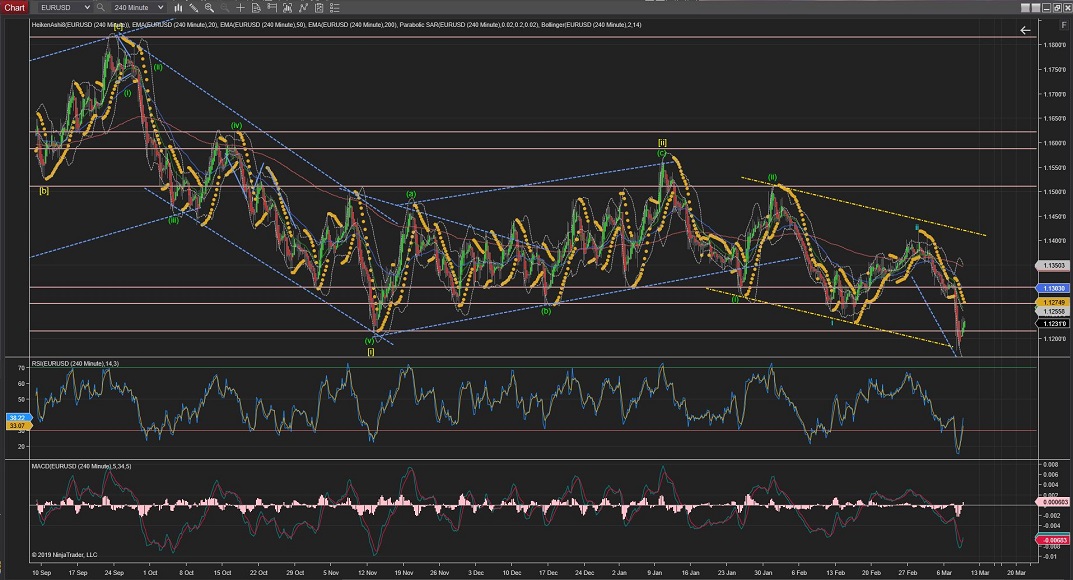
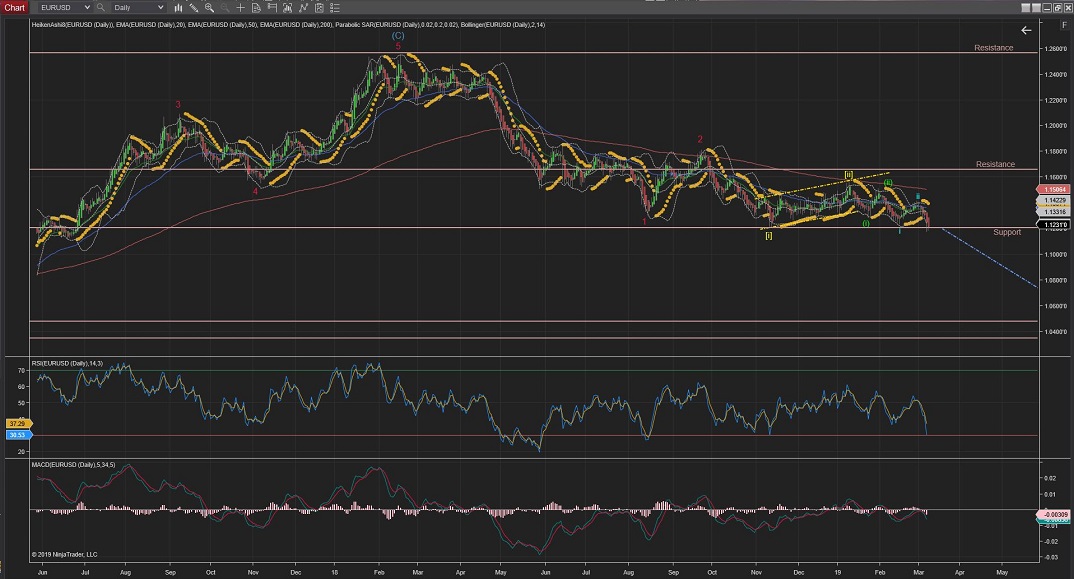
EURUSD
EURUSD seem to have completed Wave 2 correction at the %50 Fib retracement level as expected.
There is an alternative count for an extended Wave ii although that would not be triggered unless the price crosses the 0 Fib retracement of Wave 1 (blue).
As per current count; Wave 3 should continue the impulsive Waves down and break through the lower trend line (yellow) and lower support levels.
60Mins
4Hours
Daily
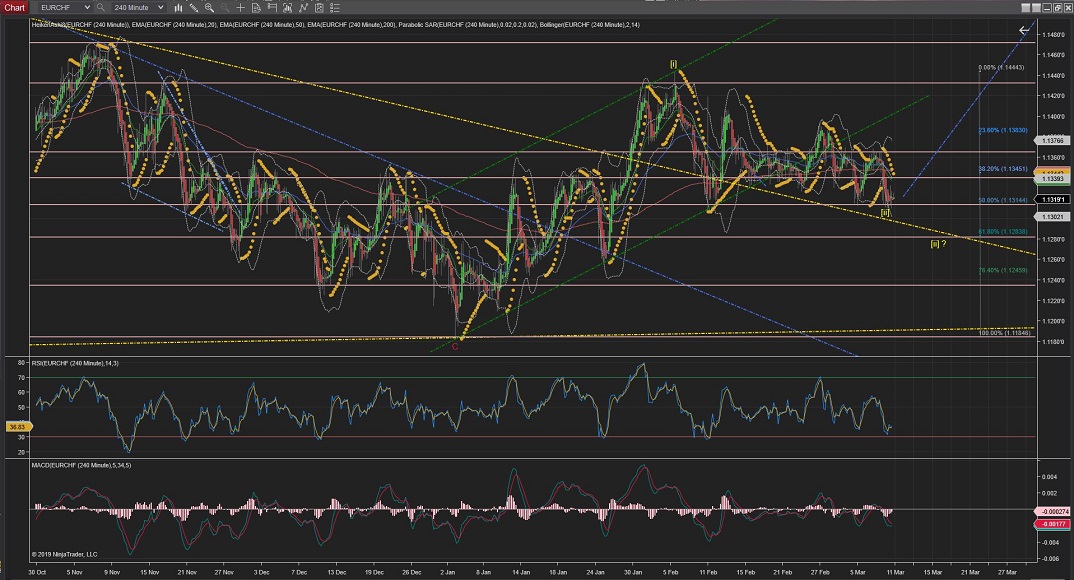
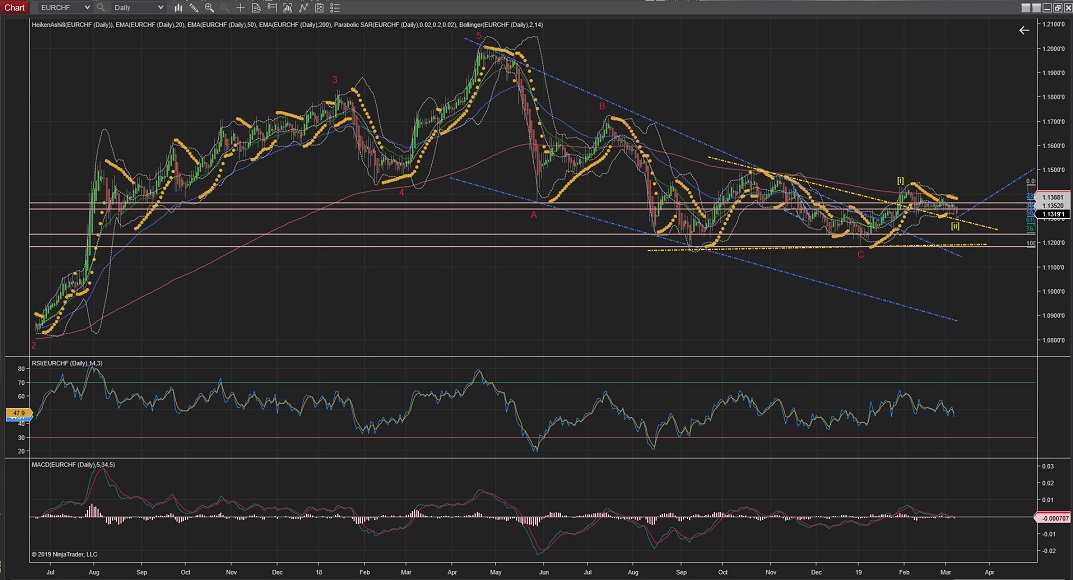
EURCHF
EURCHF has moved very impulsively on Wave iii through its internal Wave 3.
And it has now completed a small correction for Wave 4.
So I would expect the price to rally again towards the upper trend line to complete Wave iii.
Once, Wave iii is completed the price should drop back again towards previous lower degree Wave 4 levels.
60Mins
4Hours
Daily
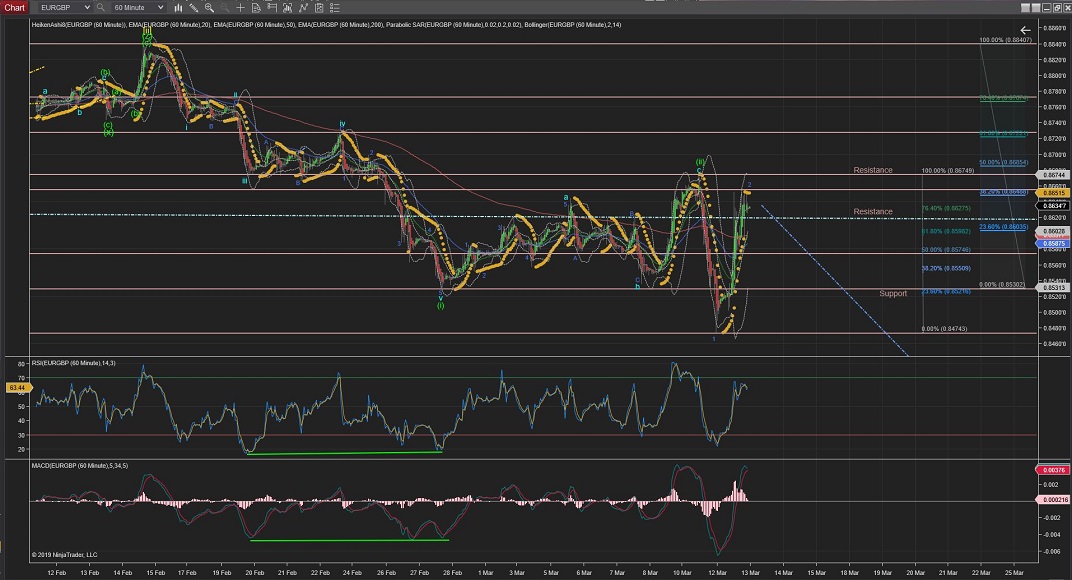
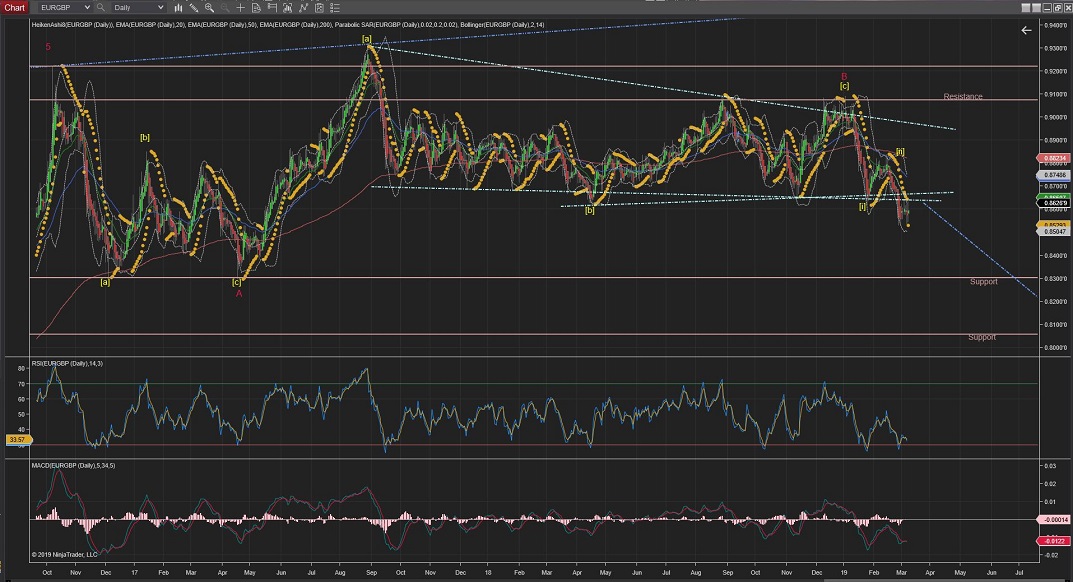
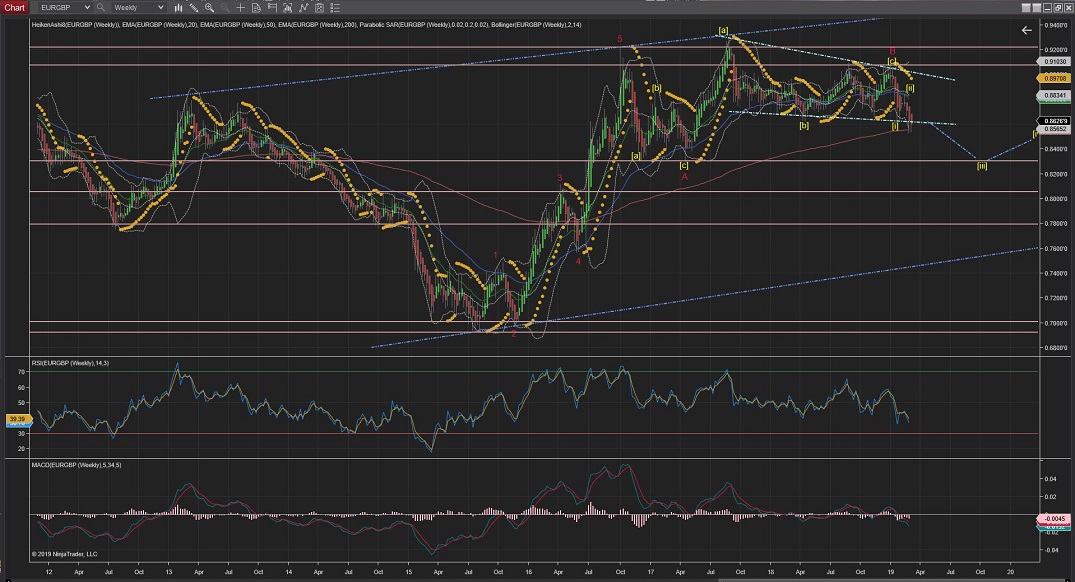
EURGBP
EURGBP seem to have completed the corrective Wave 2 between the %76 and the 0 Fib retracement area.
Any move up further than the highest of Wave (ii) would trigger the alternate count for an extended Wave (ii).
As the current count stands I would expect to see a drop in the price for Wave 3 to continue its way down through Wave (iii).
(this count would only be confirmed once it crosses the lowest of Wave 1).
60Mins
4Hours
Daily
Weekly
GBPUSD
GBPUSD has made a 5 wave structure for Wave a of current Wave (ii) correction and then a 3 wave structure for Wabe b and it has now started Wave c upwards to complete this ZigZag(5,3,5) Wave (ii) correction.
Although, if the price keeps raising it would trigger the alternative count for an extended Wave 2 (red).
As per current count; once Wave (ii) is completed, I would expect impulsive waves downwards to initiate Wave (iii) and breakthrough the lower trend (yellow).
60Mins
4Hours
Daily
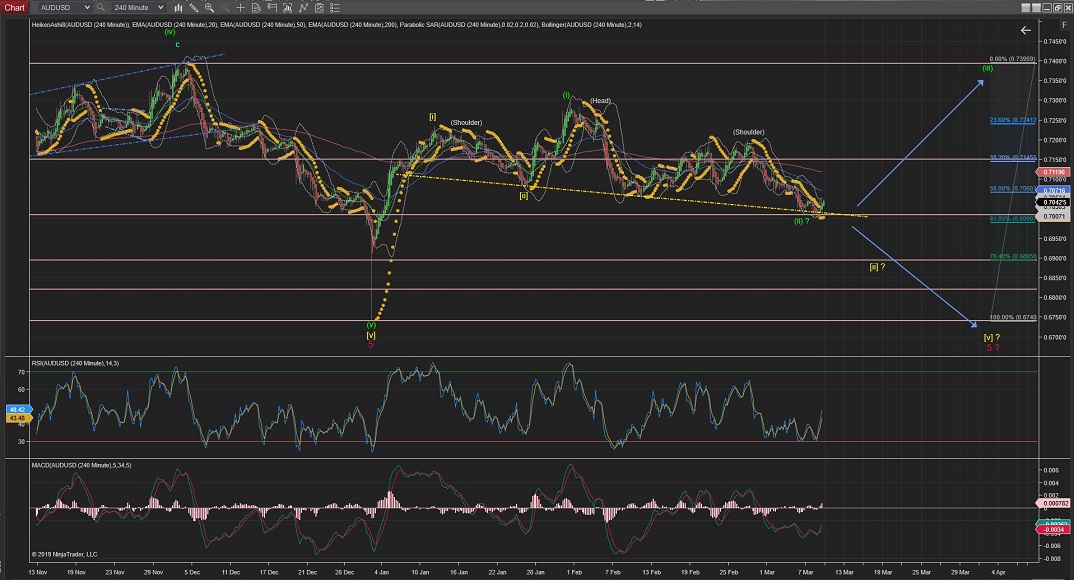
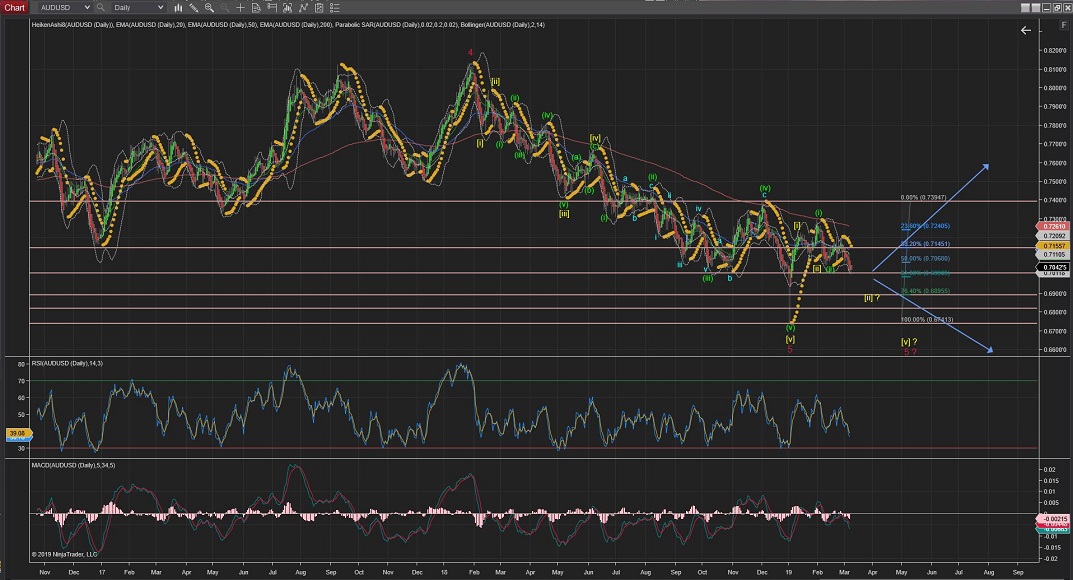
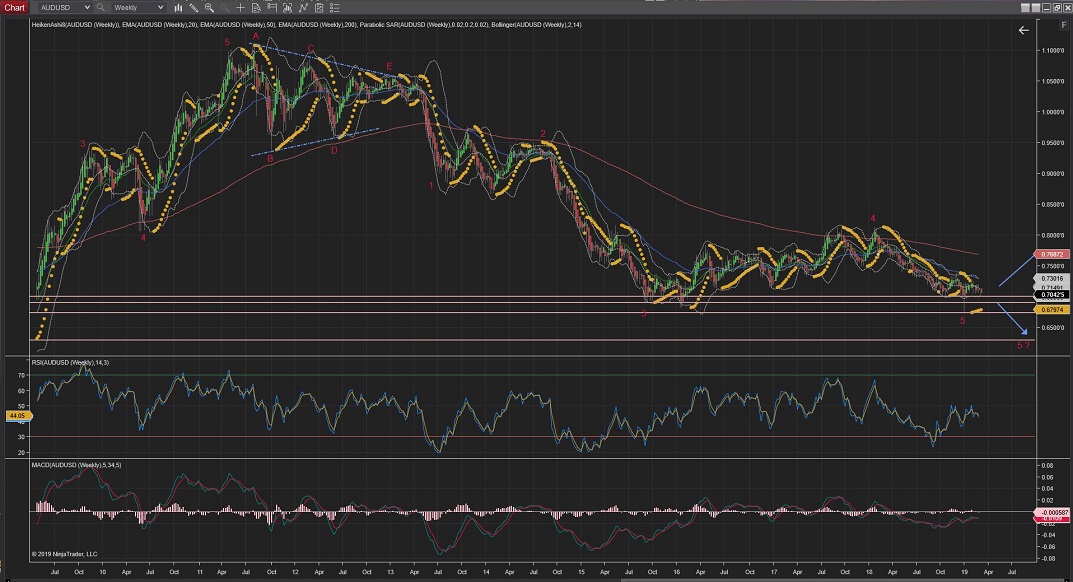
AUDUSD
AUDUSD 4Hour Chart is showing the price raising from the neckline of a clear Head & Shoulders pattern which is suggesting Wave (iii) could be finally making its way up.
Still not out of the woods yet, so further moves lower than this neckline would trigger the alternative count for an extended Wave [ii] going towards the %76 levels of support, although it is still possible an extended Wave [v] or even a further extended Wave 5, with not much resistance levels to stop the move down (best seen in the 4Hour and Daily charts) .
And today it seem to have completed an internal 5 wave structure for the first Wave i up.
So I would expect next to be a correction for Wave ii
60Mins
4Hours
Daily
Weekly
All the best for everyone.
Andres


 Trading Waves .org