Mon 04-03-2019
Hi everyone, hope you are all ok.
USDJPY
USDJPY is going through Wave ii correction and there are good areas of support at the %50 and %62 Fib retracement levels (111.20).
So it is likely that the drop will stall find there the end of the correction and prices would start moving up impulsively again on Wave iii of Wave (iii).
60Mins
4Hours
Daily
Weekly
USDCAD
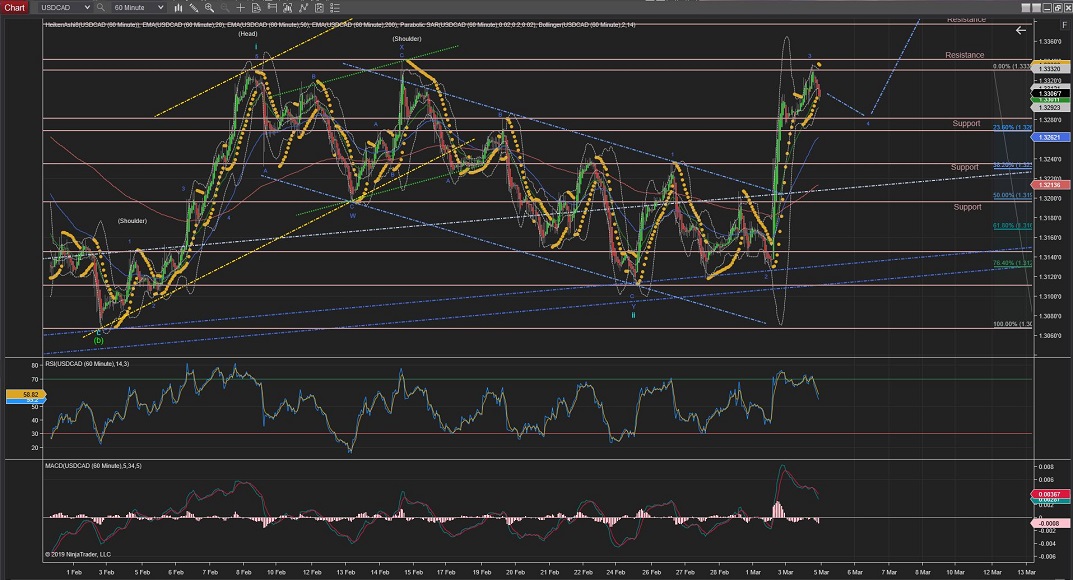
USDCAD completed Wave 3 and t is now going through Wave 4 correction down towards the nearby support levels made by previous Waves A and B.
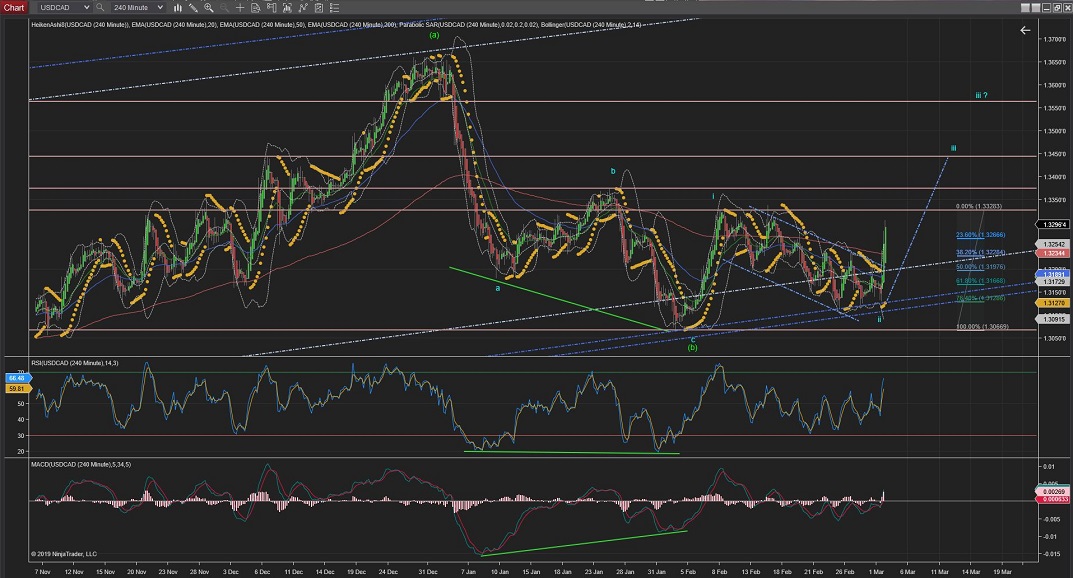
After Wave 4 correction prices should carry on raising again until Wave iii completion to at least the 1.3450 area but possibly above the 1.3550 (best shown on the 4Hour Chart).
60Mins
4Hours
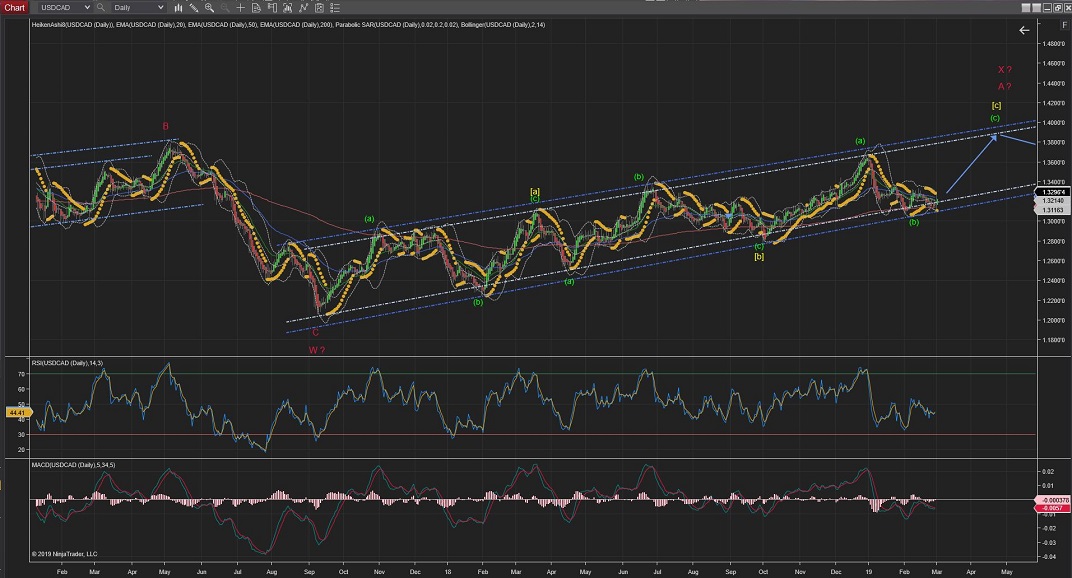
Daily
USDCHF
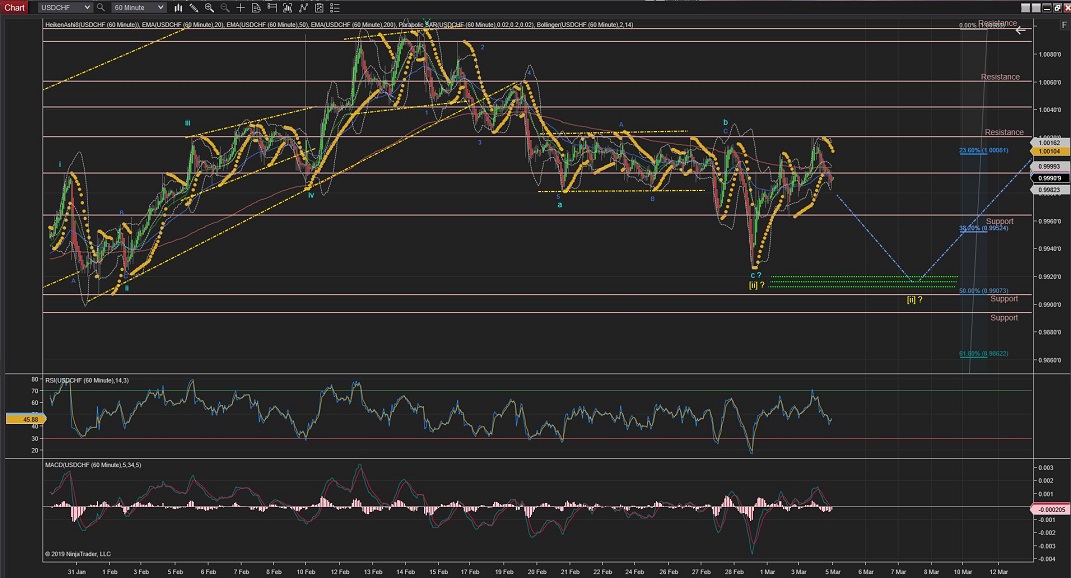
USDCHF Wave [ii] correction started with a clear 5-wave Wave a and then a 3-Wave Wave b for a 5-3-5-Fig-Zag correction...
However it is hard to make sense of the current Wave c as the price has kept raising and it has not shown the clear 5-Wave structure that I was expecting for the last leg of the correction.
So I find it hard to assume that the correction is finished.
Hence, I am still expecting prices to drop towards the %50 Fib retracement area, although if they keep raising further and impulsive waves start showing up, it would confirm that Wave [iii] has started on the way up.
60Mins
4Hours
Daily
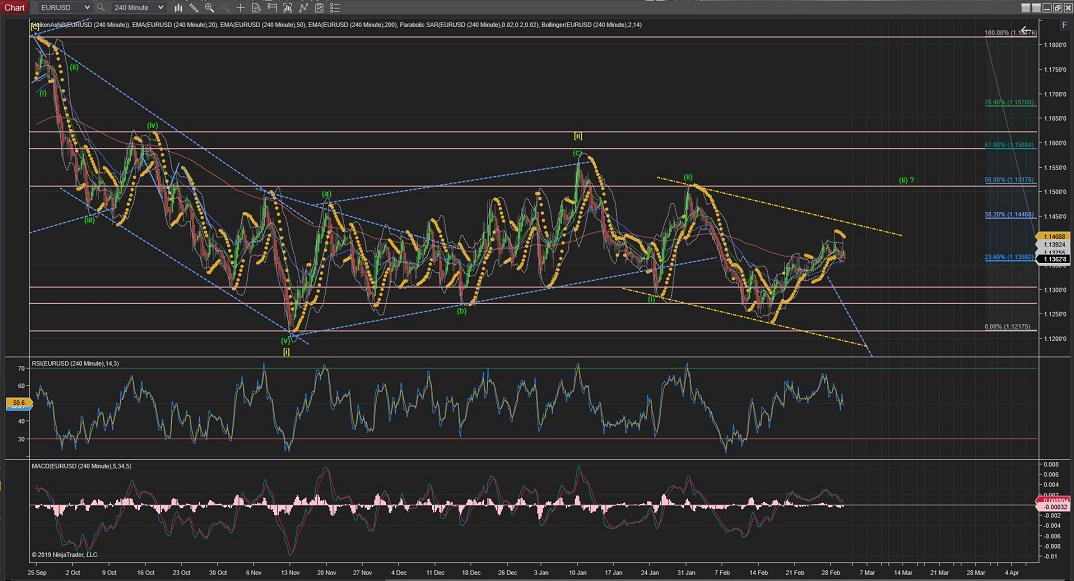
EURUSD
EURUSD has continued the moves to the downside slowly and it is now through Wave 4 correction.
The previous Wave 1 lowest point should serve as a good resistance (further moves up would invalidate that count).
Once Wave 4 is completed prices should continue down towards the next levels of support between 1.1280 and 1.1260 area.
60Mins
4Hours
Daily
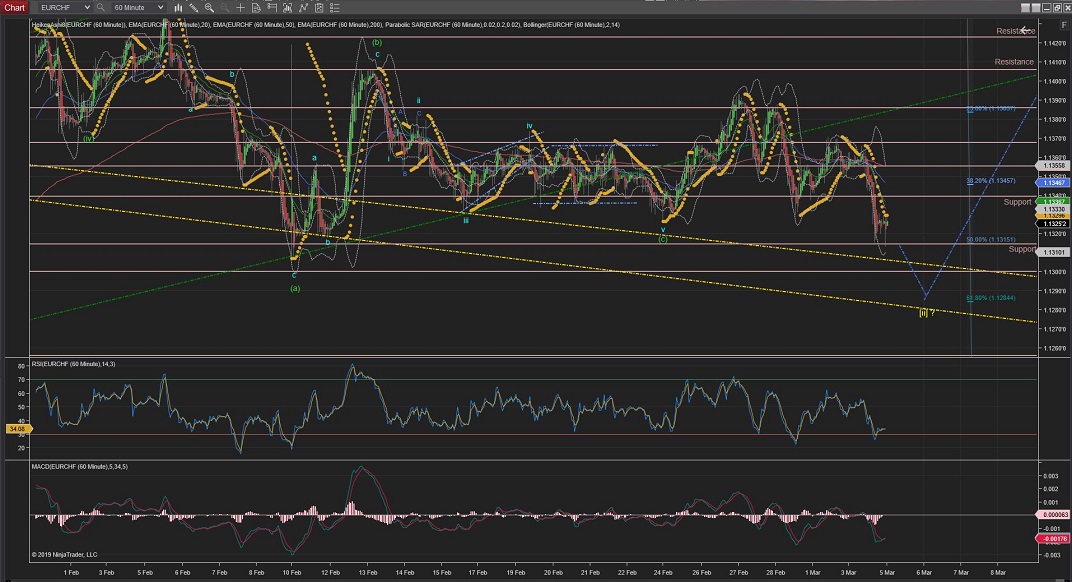
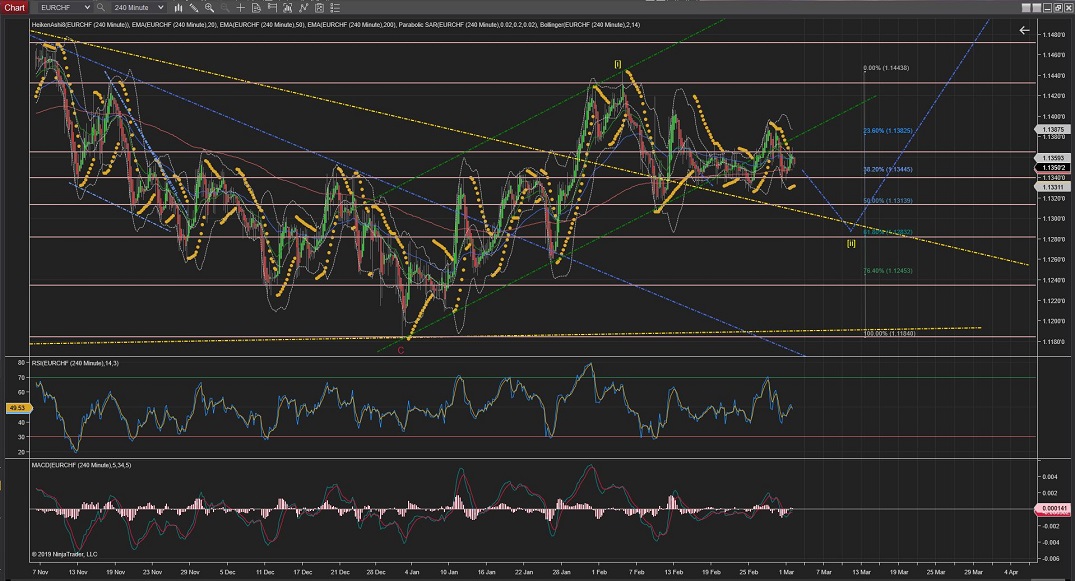
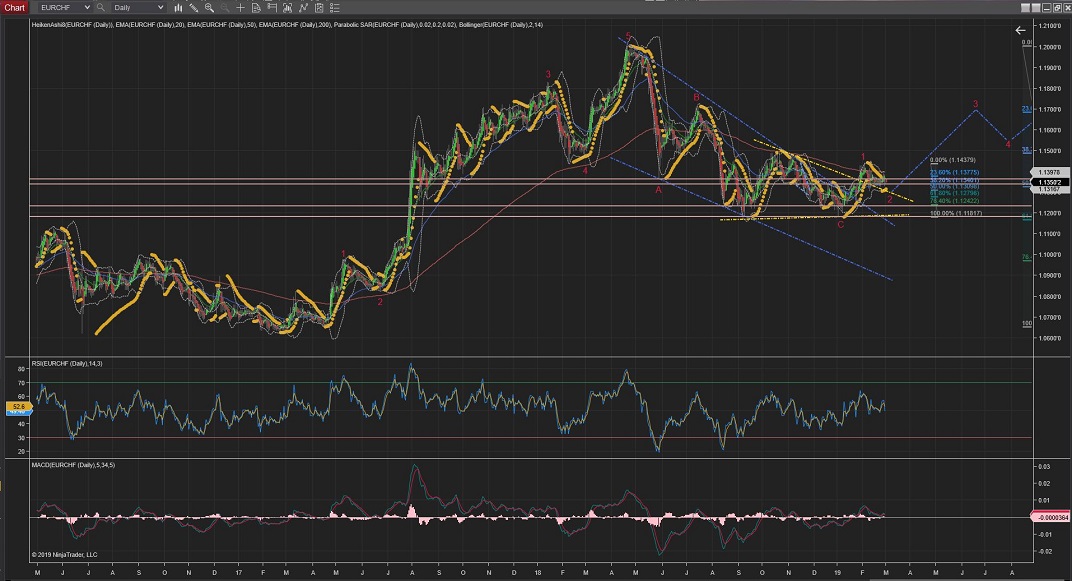
EURCHF
EURCHF might still be developing a complex correction for Wave [ii].
Its price nearly touched the outer long-term trend (yellow) again at the %50 but the price did not bounced up from there.
The inner long-term trend (yellow) stands at the %62 Fib retracement and hence that could be the next target for Wave [ii] completion should the prices failed to raise next.
60Mins
4Hours
Daily
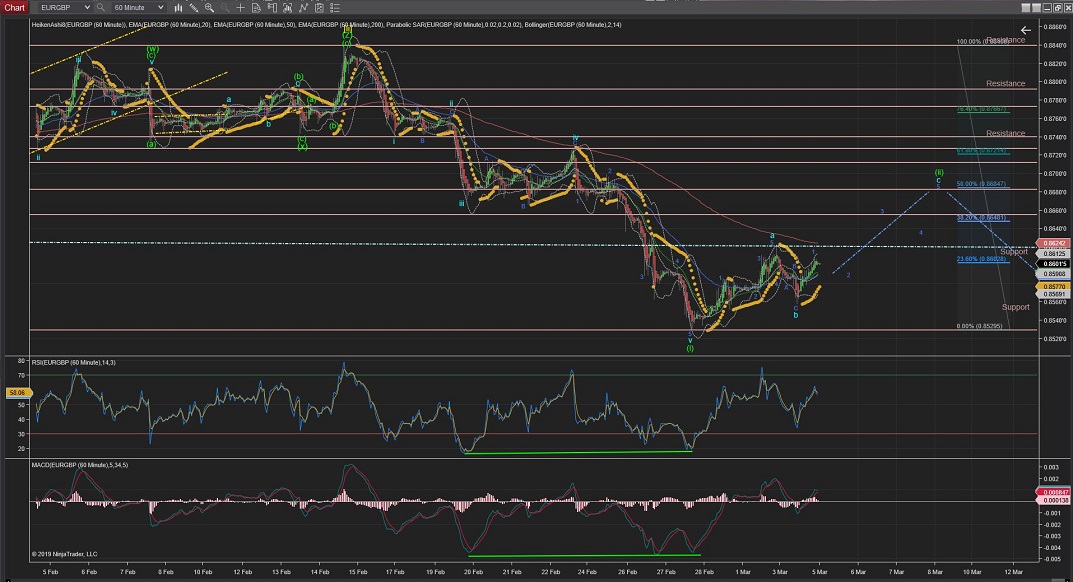
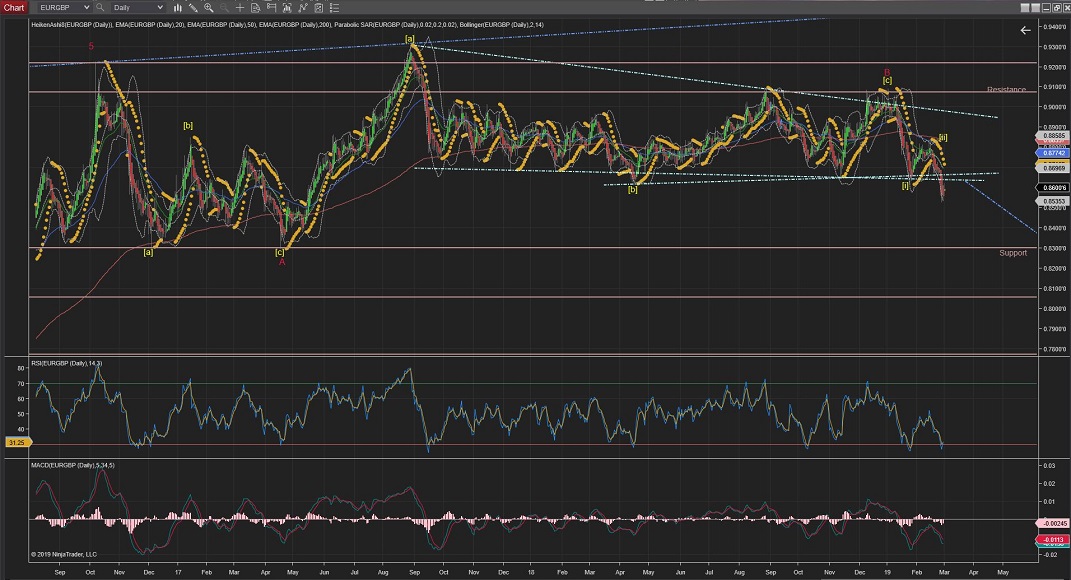
EURGBP
EURGBP has completed a 5-Wave structure for Wave a of Wave (ii).
Then completed a 3-Wave structure for Wave b.
Which suggest that should now go ahead for a 5-Wave structure for Wave c for a ZigZag correction (5,3,5).
It seemed to have completed what appears to be Wave 1 for the current Wave c; so 4 more waves should complete this Wave (ii) ZigZag correction, with a target at the %50 Fib retracement of Wave (i) (0.8684 price area).
Prices should start dropping impulsively again from there.
60Mins
4Hours
Daily
Weekly
GBPUSD
GBPUSD has stopped at the 200EMA right after crossing the trend channel while completing Wave b of Wave ii correction.
For this count to remain valid , Wave C should carry on higher to complete at the trend line.
Although I see unlikely at this stage; If price moves higher than this trend, it would suggest the completion of Waves [c] and Wave 2 would be at the next parallel trend formed with the highest of Wave (a) above the 1.3500 price (%50 Fib retracement - As shown on the Daily Chart).
As per current count, once Wave ii is completed, price should drop lower in impulsive moves throughout Wave iii.
60Mins
4Hours
Daily
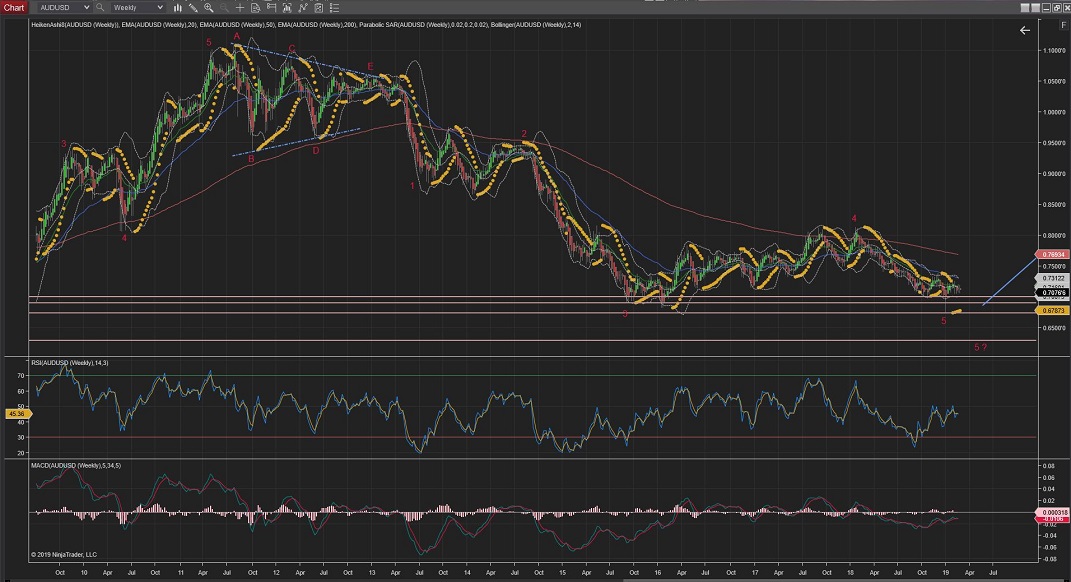
AUDUSD
AUDUSD; The current move, after extended Wave (ii), should start picking up now to the upside on Wave iii going towards the first level of resistance made by previous Wave [i] at 0.7237.
Further moves lower than 0.7069 would trigger the alternative count for an extended Wave [ii] towards the %50 or %60 levels of support with not much resistance levels to stop the move down (best seen in the daily chart) .
Note that further moves to the downside could also trigger a continuation of Wave 5 (red), as can be seen in the Weekly Chart
60Mins
4Hours
Daily
Weekly
All the best for everyone.
Andres


 Trading Waves .org