Fri 01-03-2019
Hi everyone, hope you are all ok and had a good weekend.
USDJPY
USDJPY rally almost reached to the resistance level at 112.20 to complete a very impulsive Wave 1 of Wave (iii) upwards.
There is a possibility that this Wave i continues slightly higher towards that resistance before Wave ii correction takes place on Monday.
Once Wave ii starts; I would not expect this correction to go lower than the %50 Fib retracement, which at the moment stands at the highest of previous Wave (i) at the 11.20 area.
And prices should raise impulsively again to retake Wave's (iii) trend on its Wave iii.
60Mins
4Hours
Daily
Weekly
USDCAD
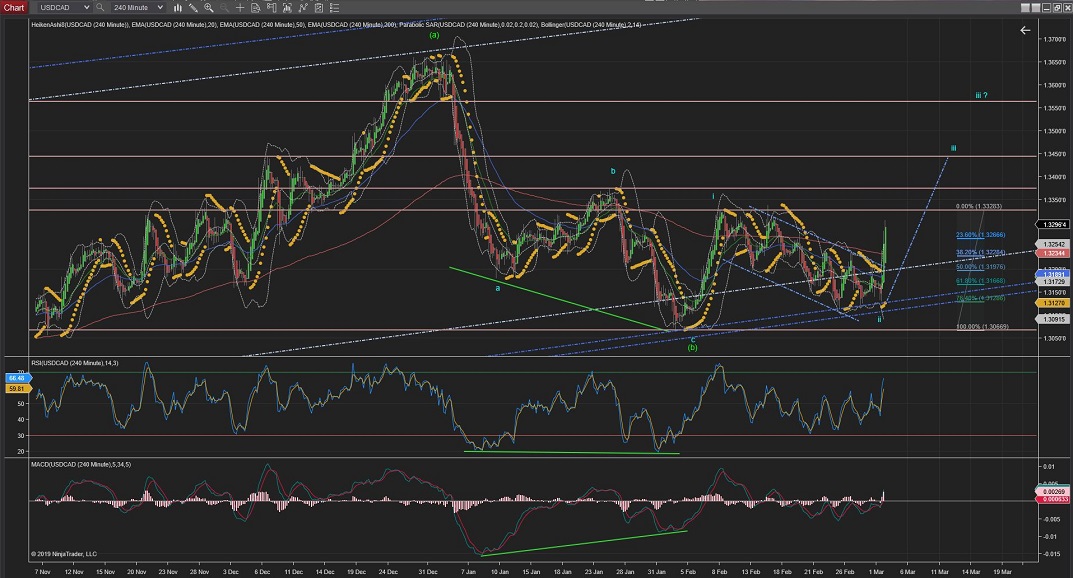
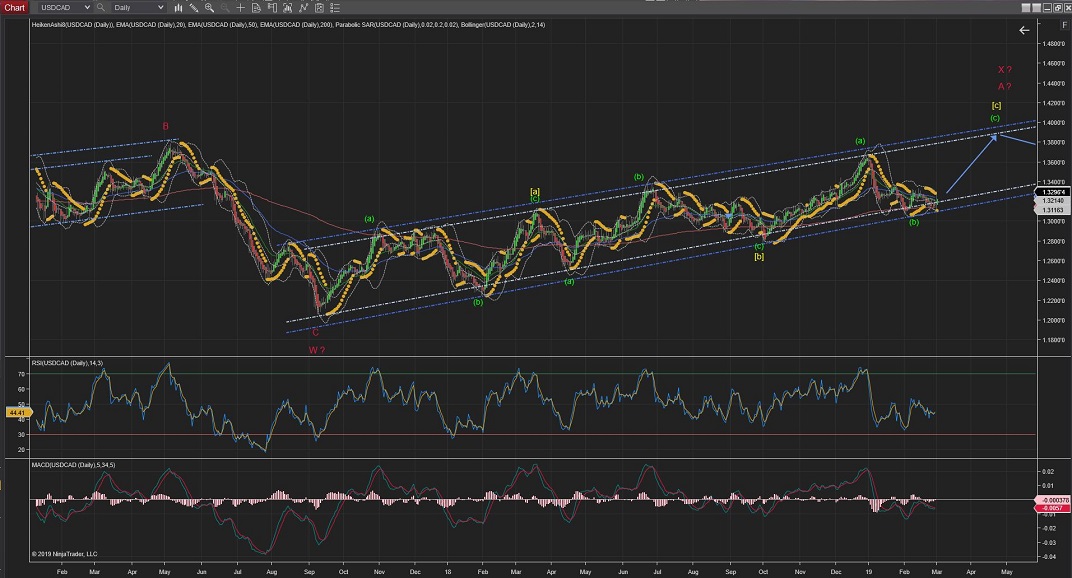
USDCAD has made a very impulsive move up on Wave iii up to what seems to be its Wave 3(blue) towards the next level of resistance at 1.3340 area, where Wave iv could take place for a short correction before prices carry on raising again until Wave iii completion to at least the 1.3450 area but possibly above the 1.3550 (best shown on the 4Hour Chart).
60Mins
4Hours
Daily
USDCHF
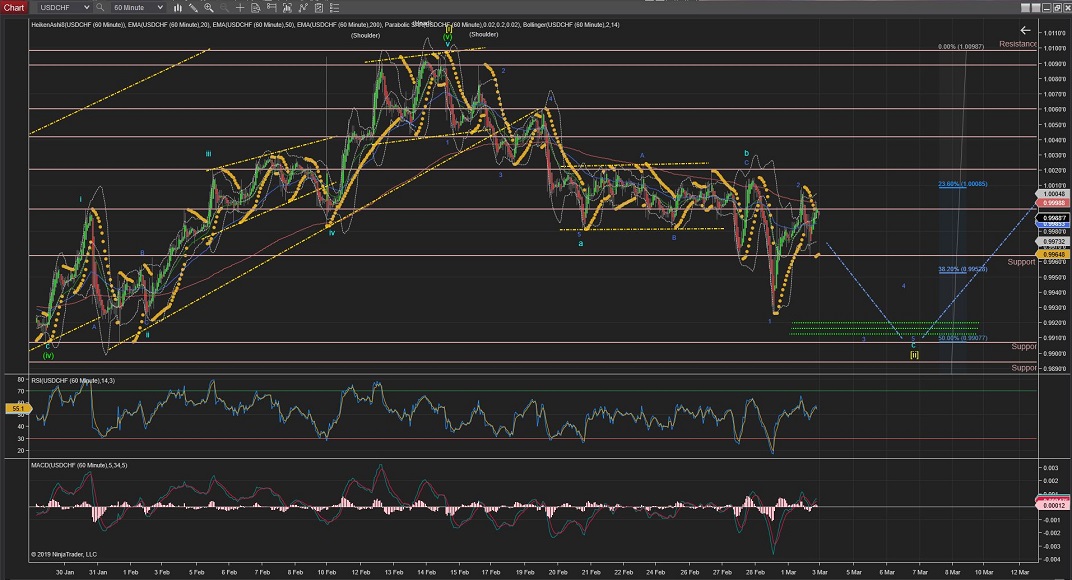
USDCHF is still going through correction waves in Wave c to the downside with its first 2 waves completed and now Wave 3 (blue) pointing to go lower again until this ZigZag(5,3,5) correction completes Wave [ii].
There are good levels of support for Wave [ii] to be completed around the %50 Fib Retracement.
Once completed it shoul start raising on impulsive waves for the start of Wave [iii].
60Mins
4Hours
Daily
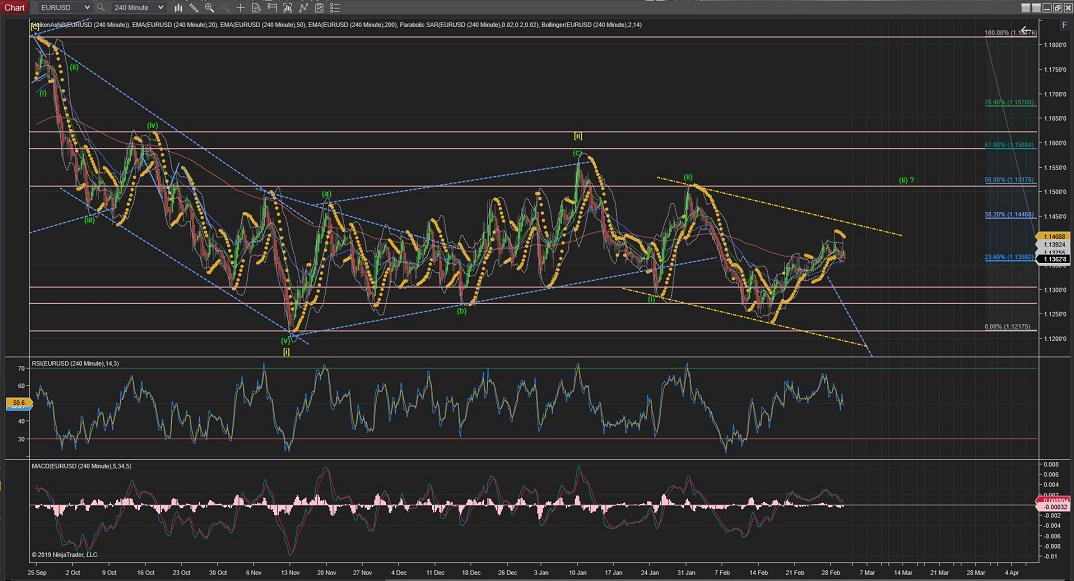
EURUSD
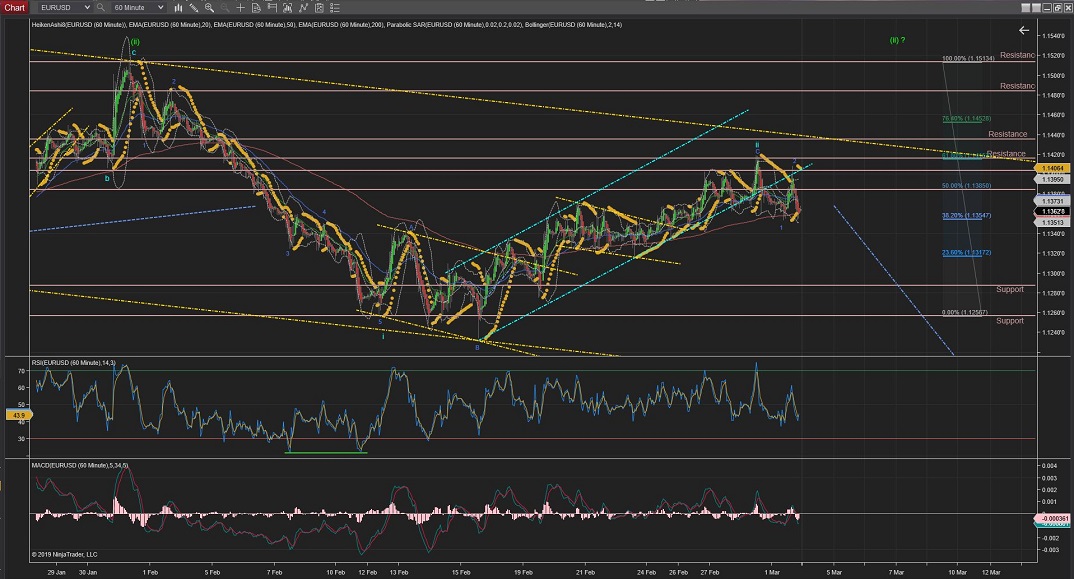
EURUSD has started Wave iii to the downside with two waves that broke the current trend (cyan).
There has been a lack of continuation, so I would expect the prices to go lower in impulsive waves for this count to remain and have a confirmation that Wave iii is on its way.
(if the price enters back in the trend channel and makes further moves up, it would suggest a larger Wave (ii) and a break from the 0 Fib retracement would confirm such alternative count).
60Mins
4Hours
Daily
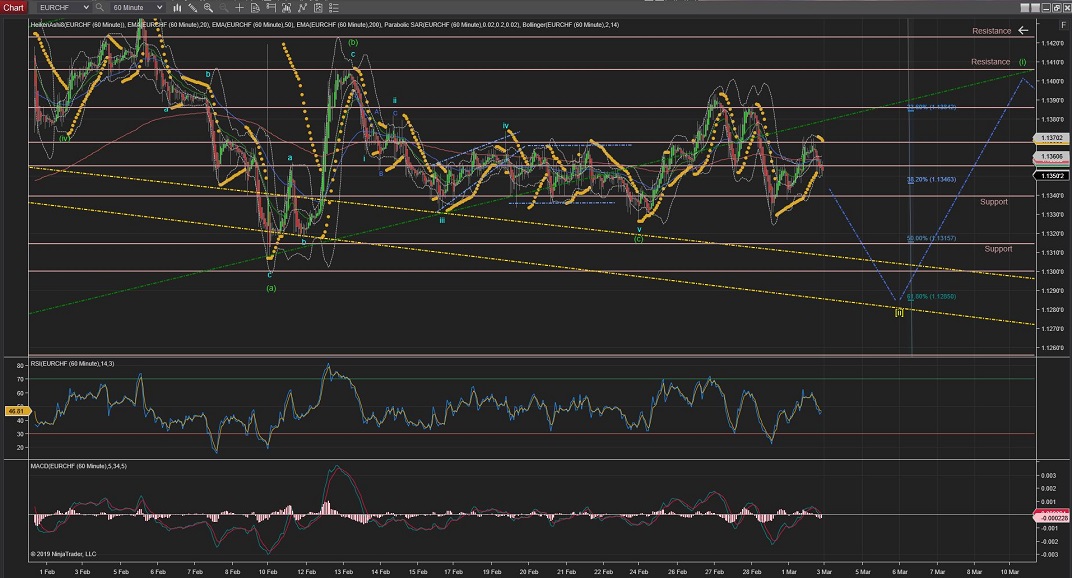
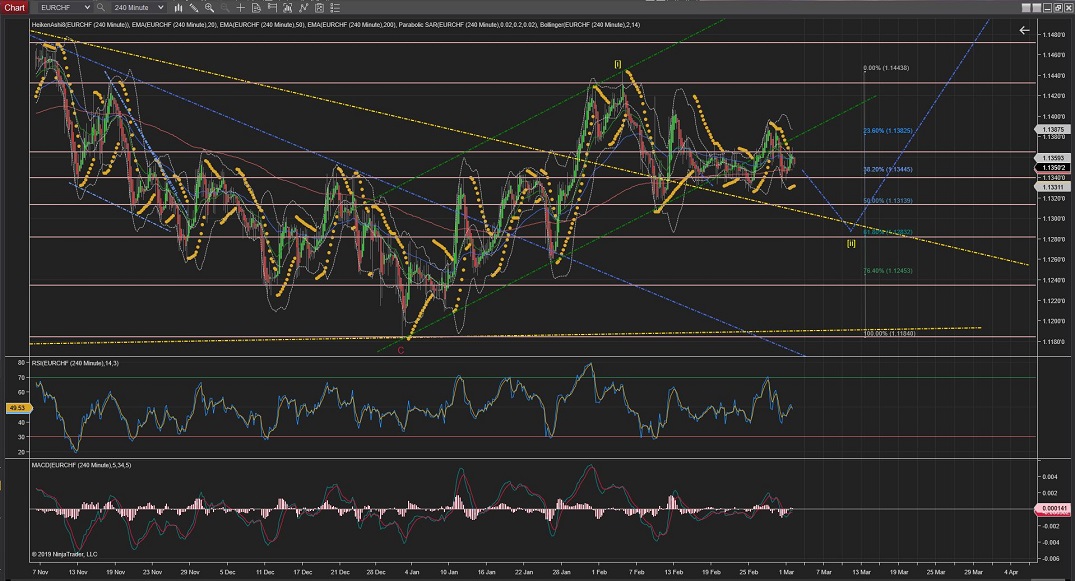
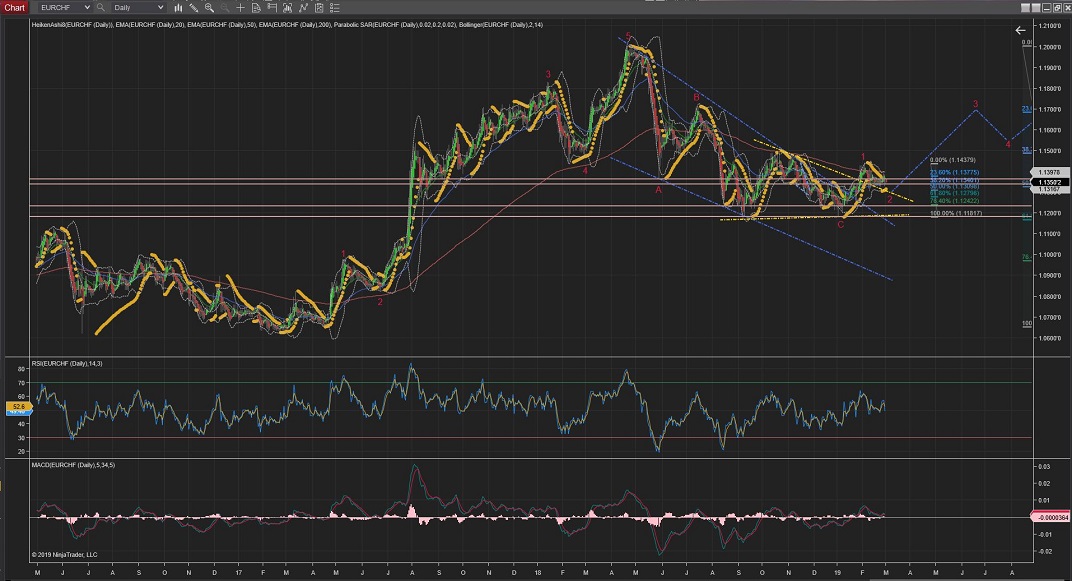
EURCHF
EURCHF is still developing a complex correction for Wave [ii].
Its price is heading towards the long-term trend (yellow) again and that would lead to the %50 or %62 Fib retracement.
Prices should start raising from there for Wave (i) start.
60Mins
4Hours
Daily
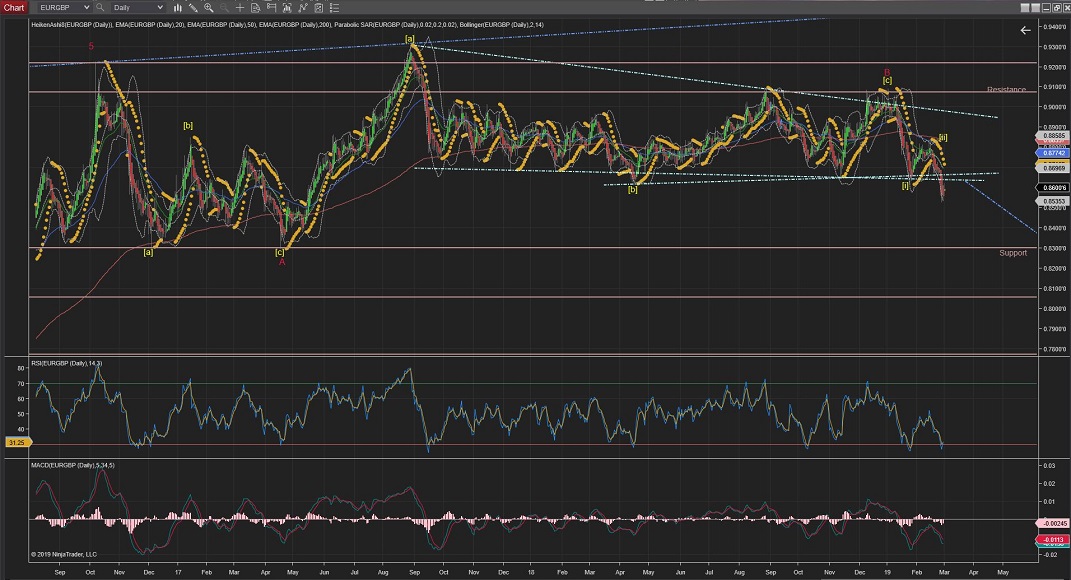
EURGBP
EURGBP is now continuing through Wave (ii) up towards previous levels of support and possibly the %50 Fib retracement area.
Once Wave (ii) correction is completed we should see the impulsive moves to the downside taking over again as Wave (iii) starts.
60Mins
4Hours
Daily
Weekly
GBPUSD
GBPUSD has shown what could be Wave i of Wave (i) to the downside.
There is not much impulsiveness so I would expect more strength to the downside after the first Wave ii correction is completed to be able to confirm the trend change.
If price moves higher than this trend, it would suggest the completion of Waves [c] and Wave 2 would be at the next parallel trend formed with the highest of Wave (a) above the 1.3500 price (%50 Fib retracement - As shown on the Daily Chart).
60Mins
4Hours
Daily
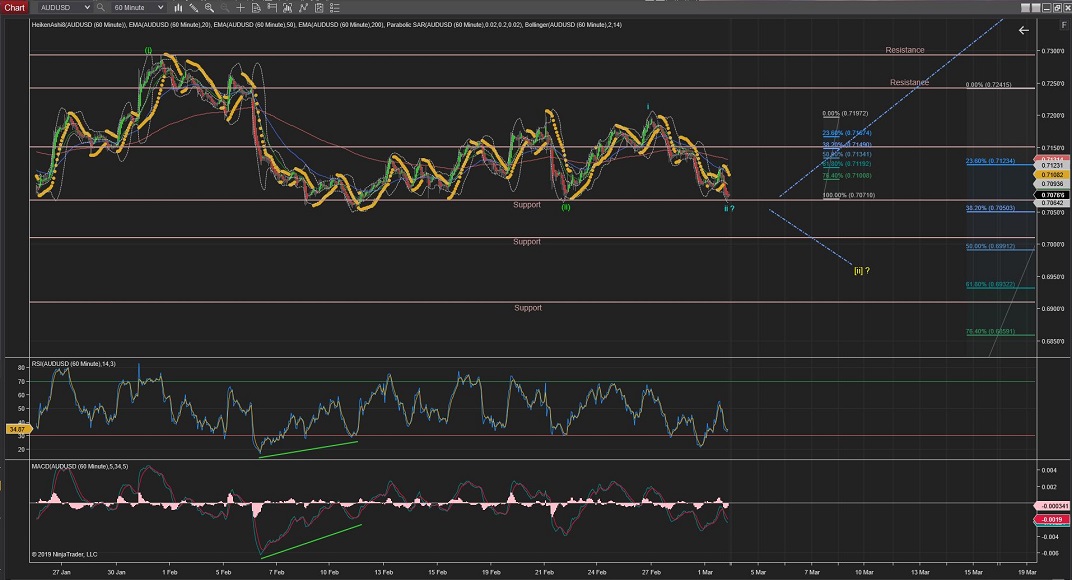
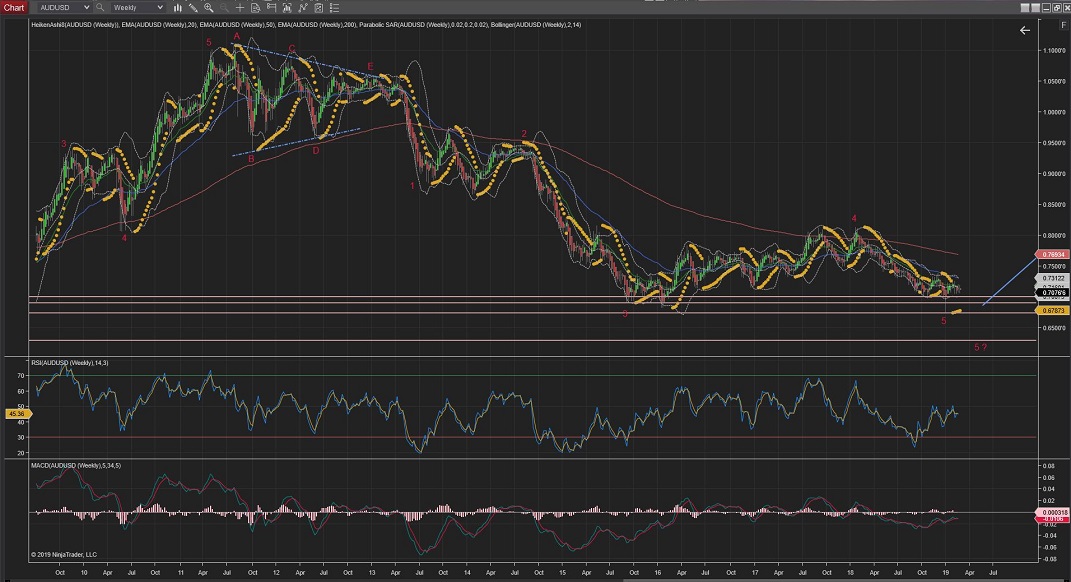
AUDUSD
AUDUSD; The current move after extended Wave (ii) should start picking up now to the upside on Wave 3 of Wave i going towards the first level of resistance made by previous Wave [i] at 0.7237 if this count is to remain a valid one.
Further moves lower than 0.7069 would trigger the alternative count for an extended Wave [ii] towards the %50 or %60 levels of support with not much resistance levels to stop the move down (best seen in the daily chart) .
Note that further moves to the downside could also trigger a continuation of Wave 5 (red), as can be seen in the Weekly Chart
60Mins
4Hours
Daily
Weekly
All the best for everyone.
Andres


 Trading Waves .org