Mon 25-02-2019
Hi everyone, hope you are all ok.
USDJPY
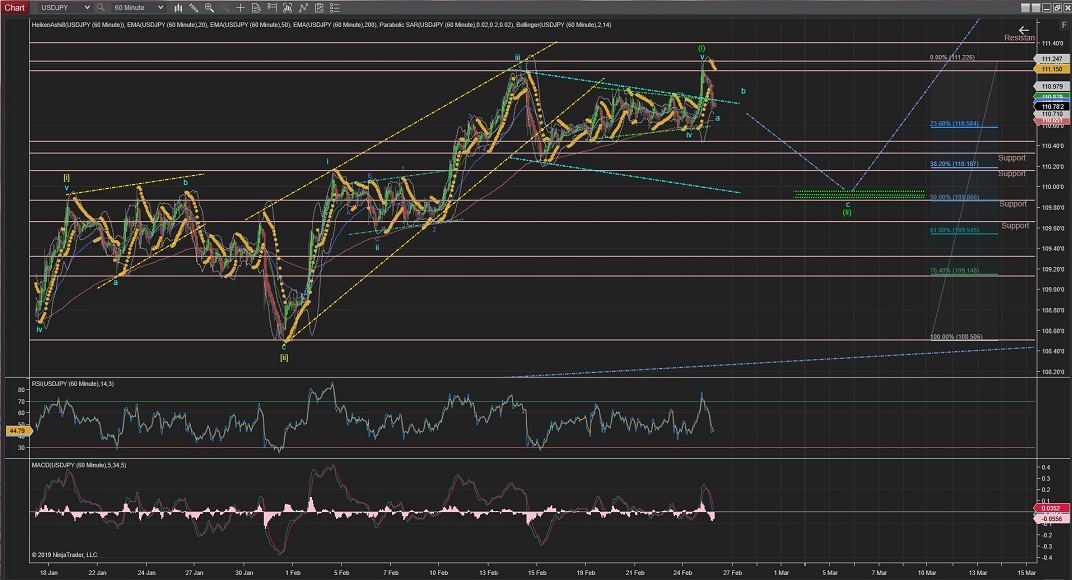
USDJPY has made a move up which made me change the count to what I had originally three days ago (now I know to stick to the current count).
The count, as it stands now calls for a Wave ii starting to correct now, probably to the %50 Fib Retracement support areas. Which has been made by previous Wave [i] high (at around 109.86).
60Mins
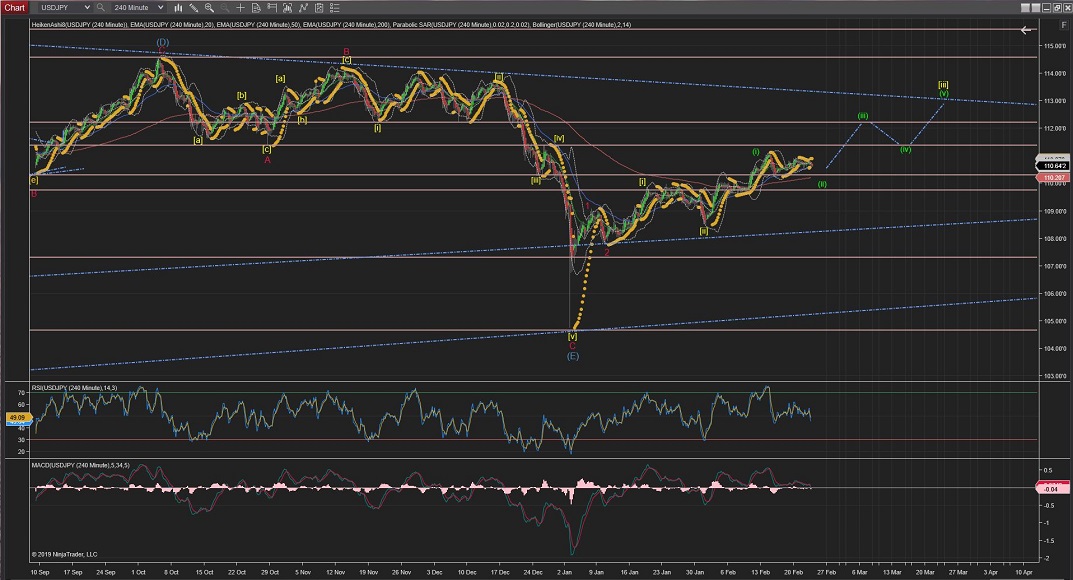
4Hours
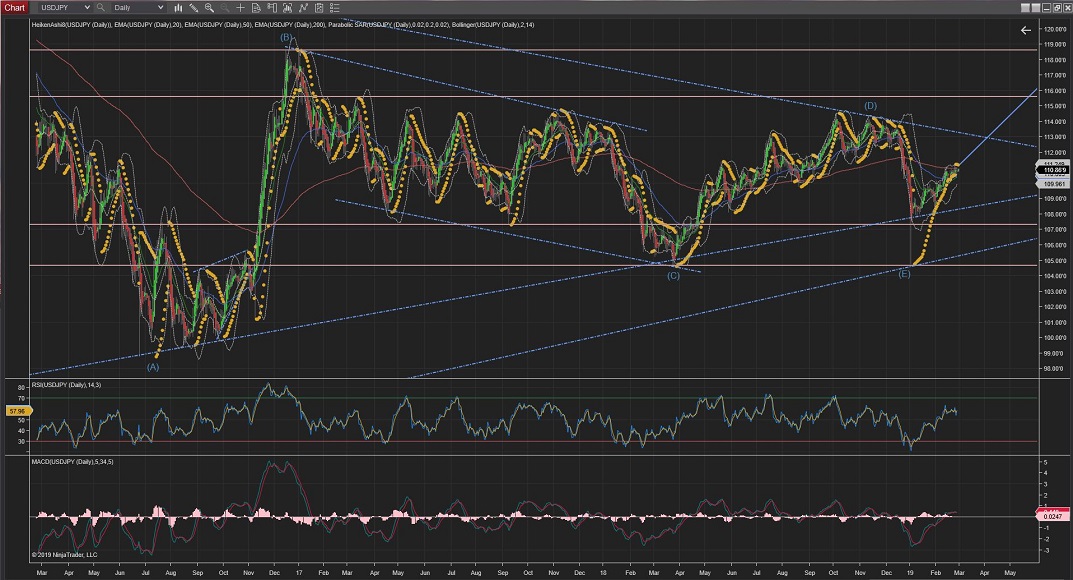
Daily
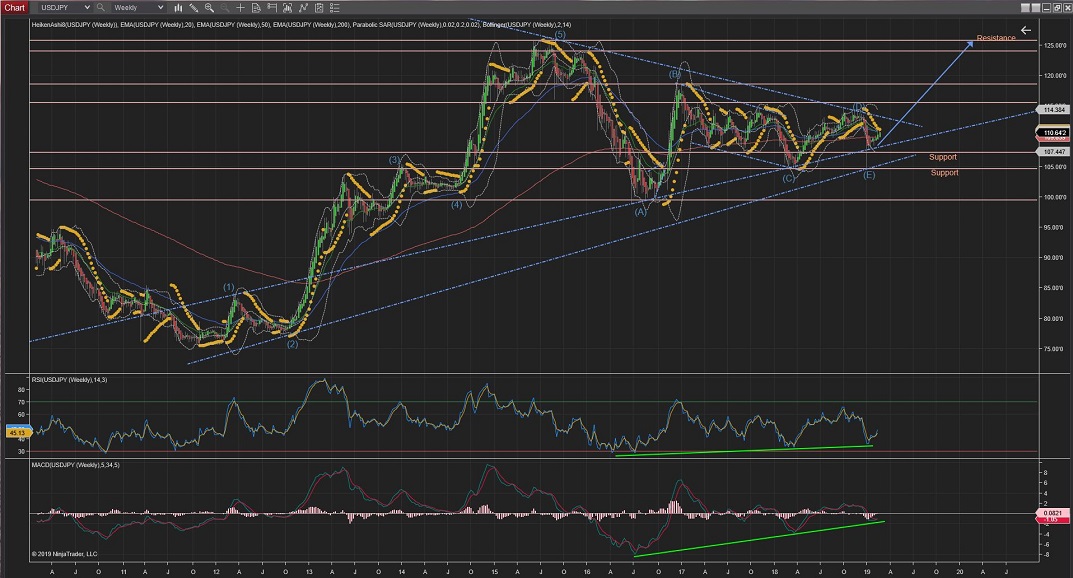
Weekly
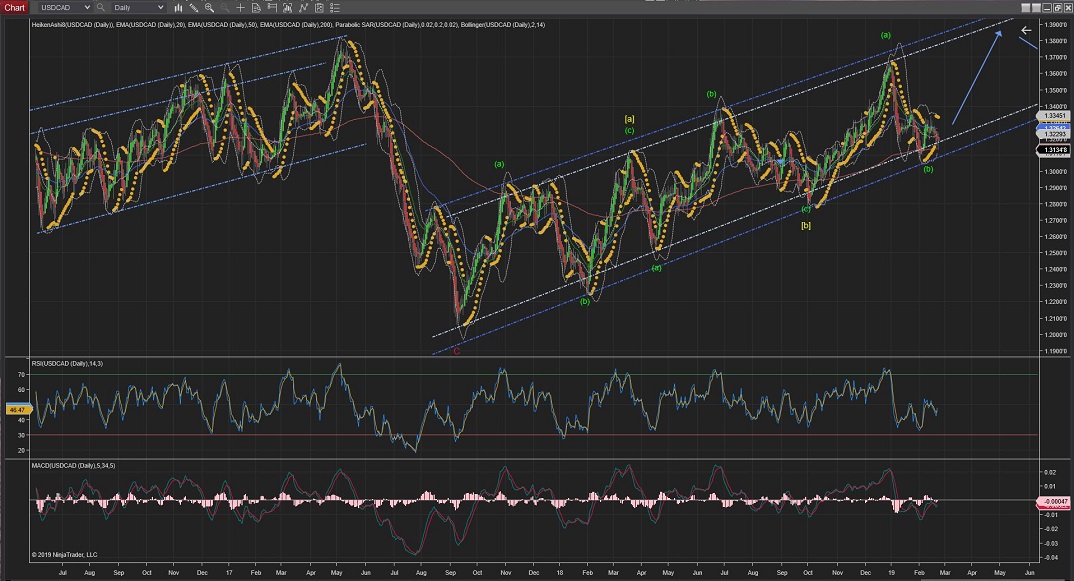
USDCAD
USDCAD hass lowered and crossed slightly the %76 Fib retracement of Wave i, and started an impulsive wave up (Wave 1).
As previous Waves 1 & 2 (blue), I would expect the current Wave 2 correction to retrace %50 and the impulsive waves to carry on up from there for Wave 3 of Wave i.
60Mins
4Hours
Daily
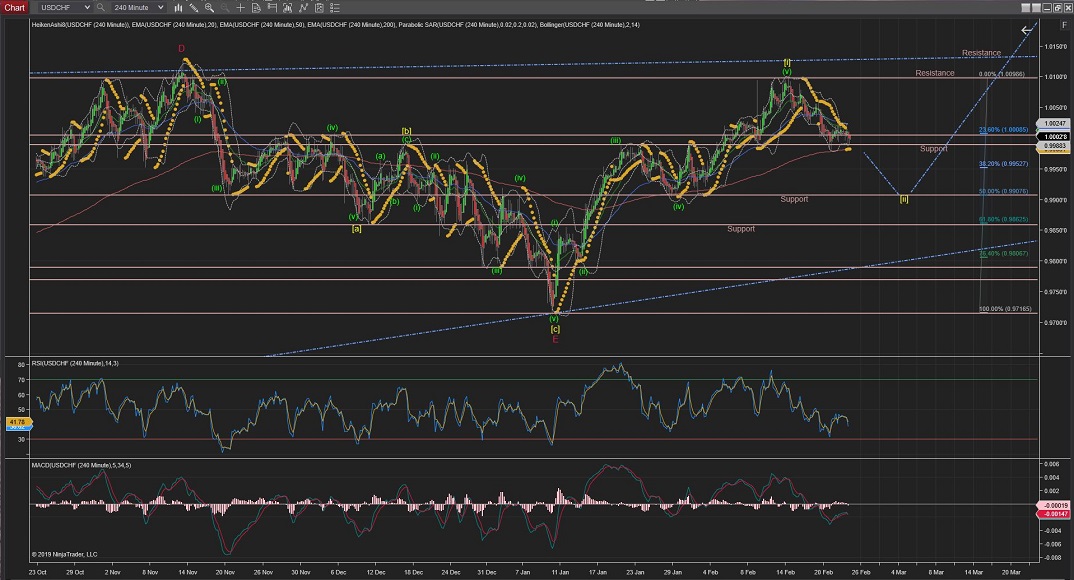
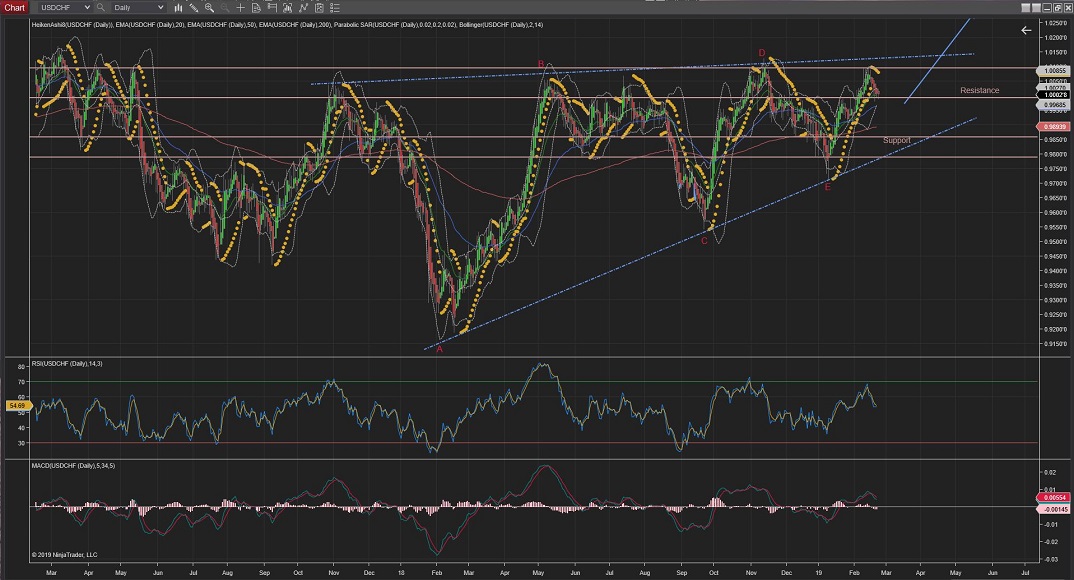
USDCHF
USDCHF is stack within a trend but continuing the ZigZag correction (5,3,5) on Wave [ii] on its Wave b and should start Wave c to the downside soon to complete Wave [ii].
From there, once completed around the %50 Fib Retracement of Wave [i], will start raising on impulsive waves for the start of Wave [iii].
60Mins
4Hours
Daily
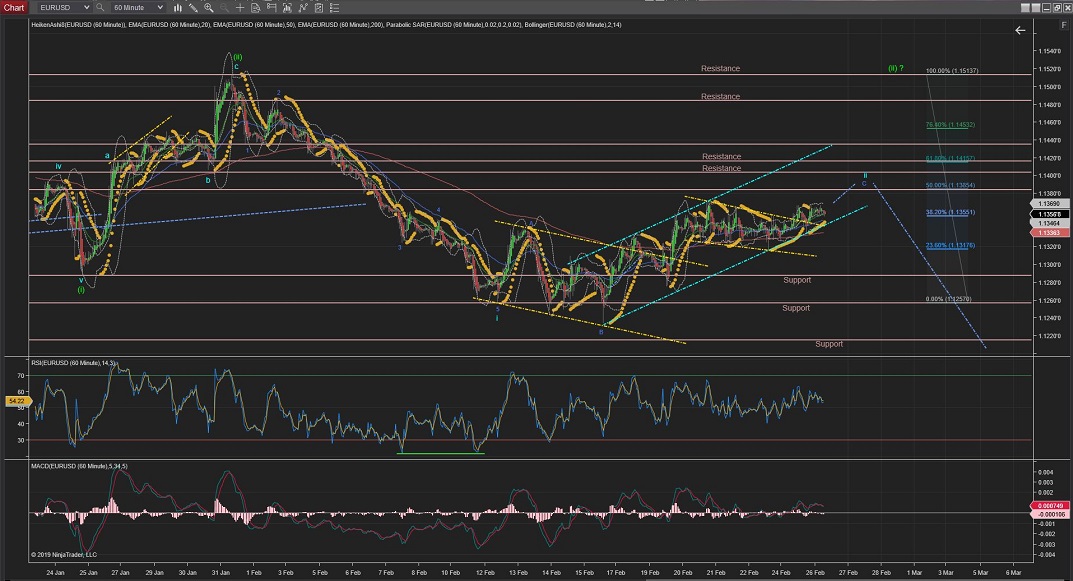
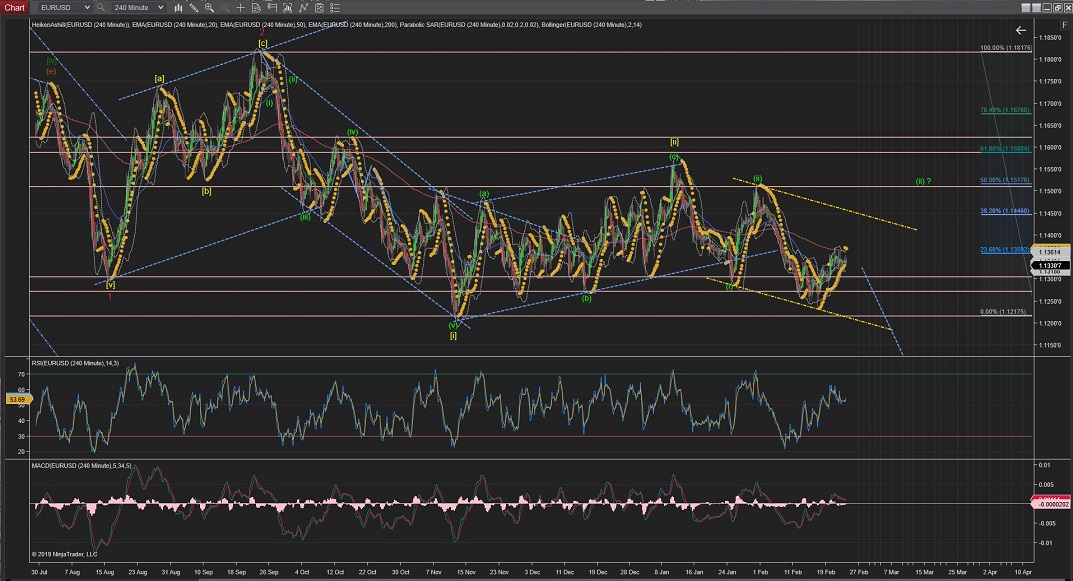
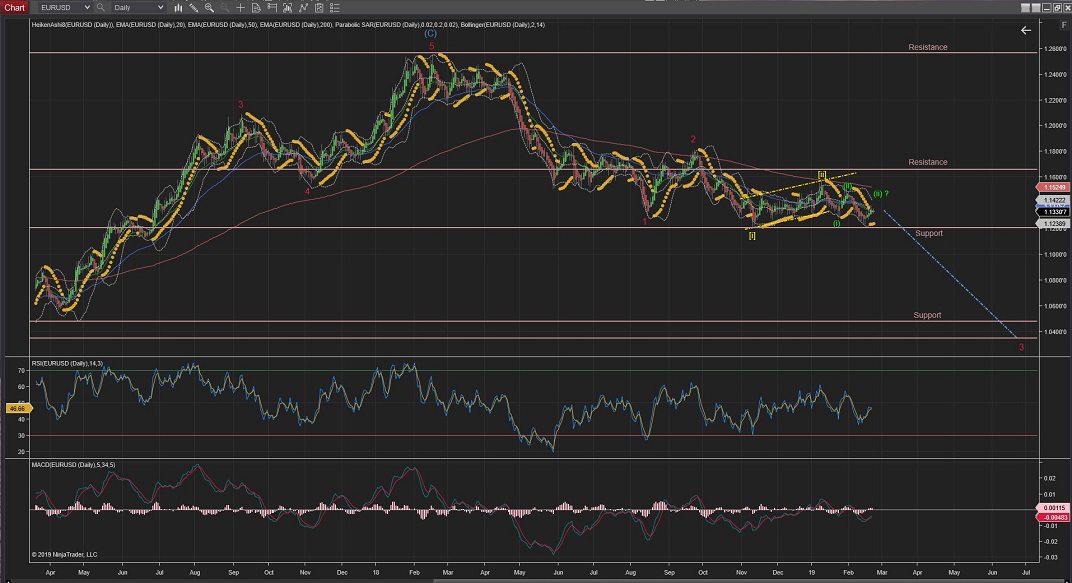
EURUSD
EURUSD has come out of a wedge (yellow) but followed a further trend (cyan) while completing Wave C of Wave ii which I suspect would breakout to the upside towards the %50 or %61 Fib retracement of Wave i.
(further moves up from this %61 Fib retracement would suggest a larger Wave (ii) and a break from the 0 Fib retracement would confirm such alternative count).
From Wave ii completion we should start seeing impulsive waves to the downside to start and follow Wave iii of Wave (iii) during the week.
60Mins
4Hours
Daily
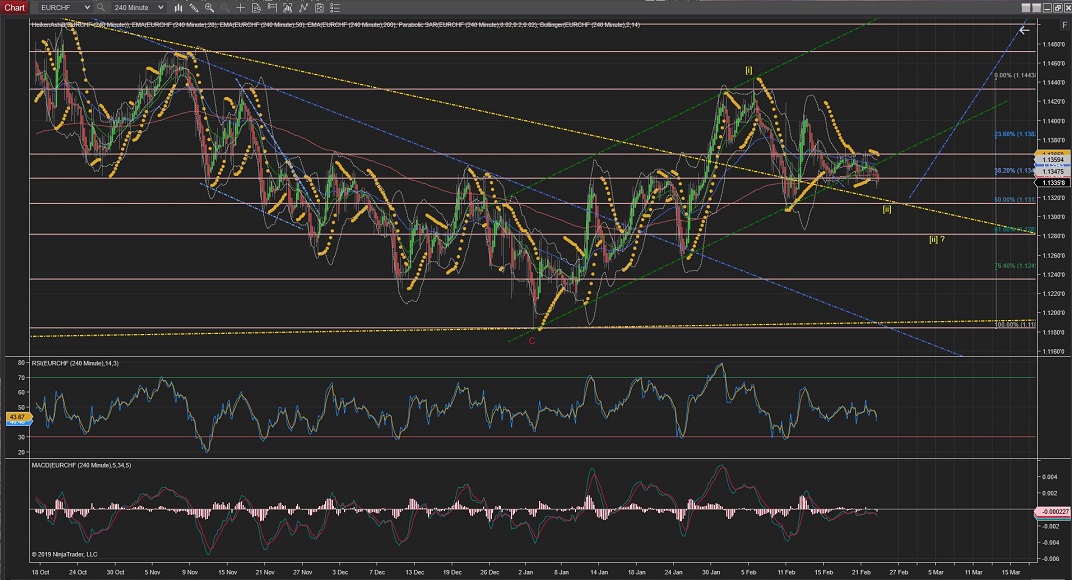
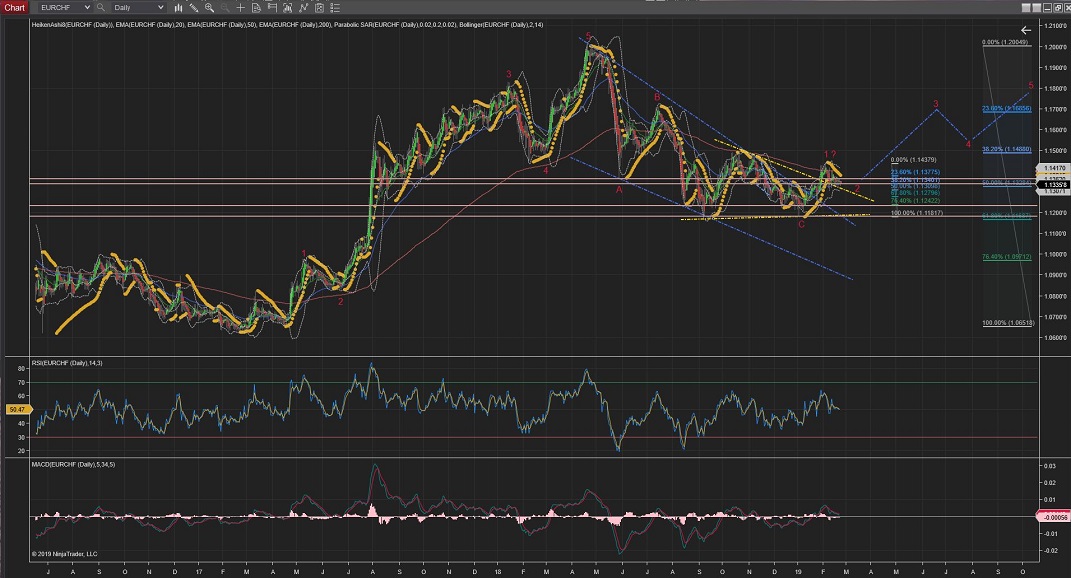
EURCHF
EURCHF seemed to have completed Wave [ii] without touching the lower long-term trend (yellow) and now and started the first wave (Wave i)
up.
Should now do Wave ii correction to its %50 or %62 retracement, although moves further down than that would suggest that Wave [ii] still needs completing and a touch for the long-term trend (yellow) would be tried again.
60Mins
4Hours
Daily
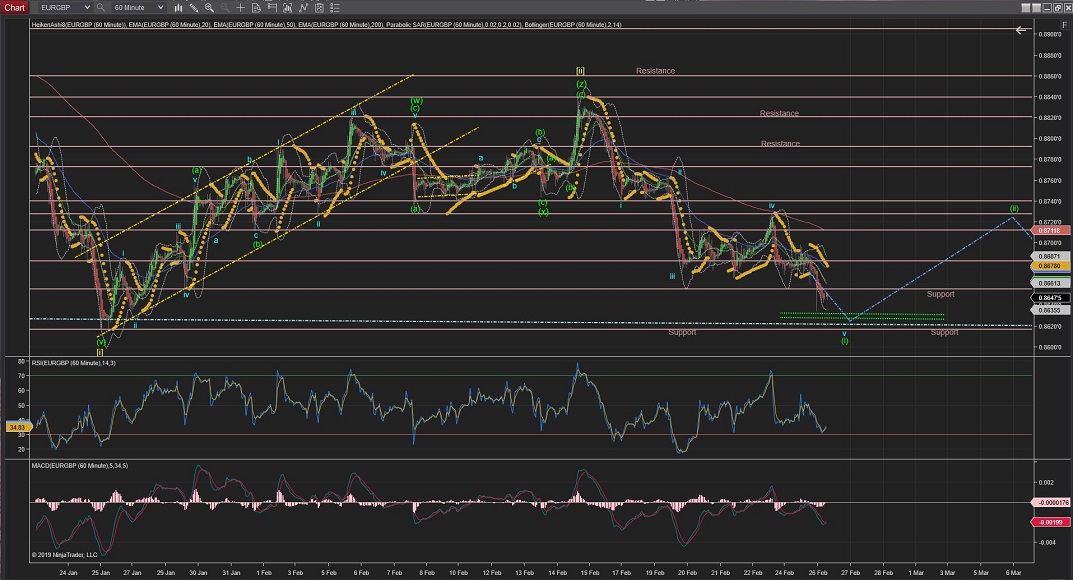
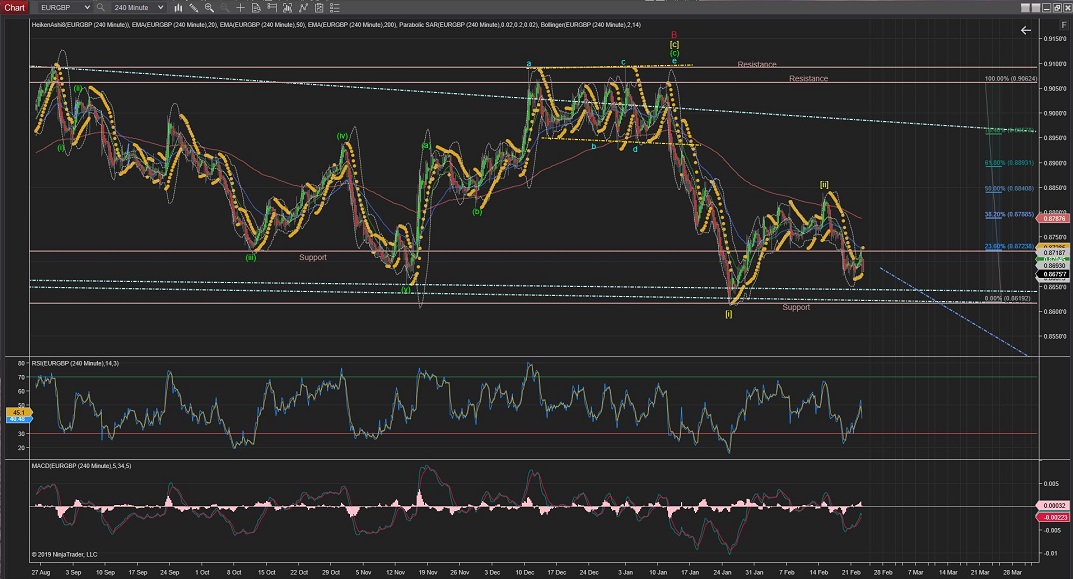
EURGBP
EURGBP has shown not much price action; has completed Wave iv correction and started the last drop lower into Wave v to complete Wave (i) of Wave [iii].
[I would expect Wave v / Wave (i) to be completed at the first lower long-term trend and areas of support around the 0.8620 area].
Once Wave (i) is completed, probably at the lower trend (cyan), we should expect a raise for Wave (ii) correction towards the %50 Fib retracement, although the strong bearishness that is showing this pair could see that retracement lower again.
60Mins
4Hours
Daily
Weekly
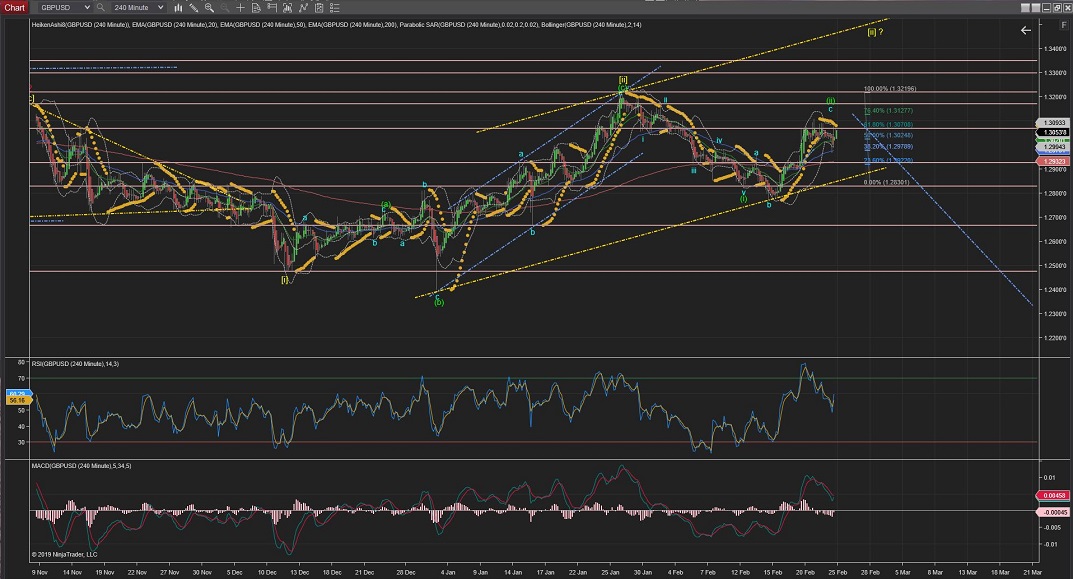
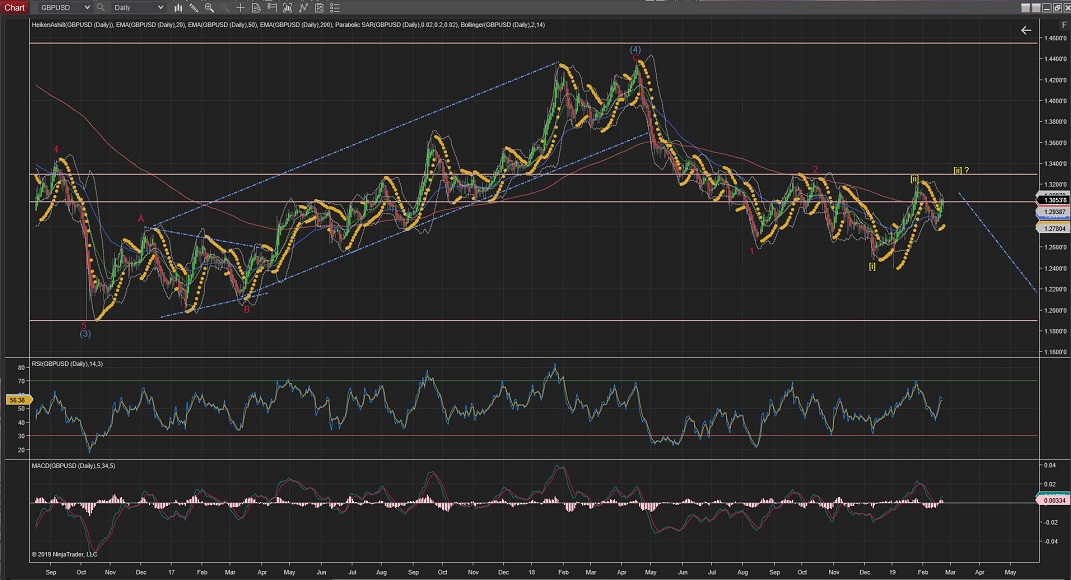
GBPUSD
GBPUSD has stalled within resistance levels and the %76 and maybe finishing the Wave (ii) there or, given the recent bullishness, if the price raises more it would call for the alternate count at a larger Wave [ii] (best seen on the Daily and 4Hour Charts).
As per current count, if the trend changes to show impulsive waves to the downside after hitting key Fib retracements (i.e. %76) Wave (iii) would then be underway.
And, once the price continues below support levels created by previous Wave (i), we could confirm that Wave (iii) is underway and the next levels of support would be at 1.2665
Even lower, the next support formed by the previous Wave [i] would be 1.2475, which, once crossed, would confirm Wave [iii] underway. (best pictured in the 4Hour Chart).
60Mins
4Hours
Daily
AUDUSD
AUDUSD has shown not much price action today; the current move after extended Wave (ii) completion could be the first wave up (Wave 1) of Wave i.
Only further price action to the upside, after what appears to be now the start of a Wave 2 correction, would prove that Wave i is on the way.
[The current count remains valid as it has not broken previous Wave (ii) levels of support (0.7057)].
[A break of the levels of support (0.7057) would trigger the alternate count for a larger Wave [ii] down towards %61 Fib Retracement of Wave [i] - best seen in the 4Hour Chart].
60Mins
4Hours
Daily
Weekly
All the best for everyone.
Andres


 Trading Waves .org