Tue 19-02-2019
Hi everyone, hope you are all good.
USDJPY
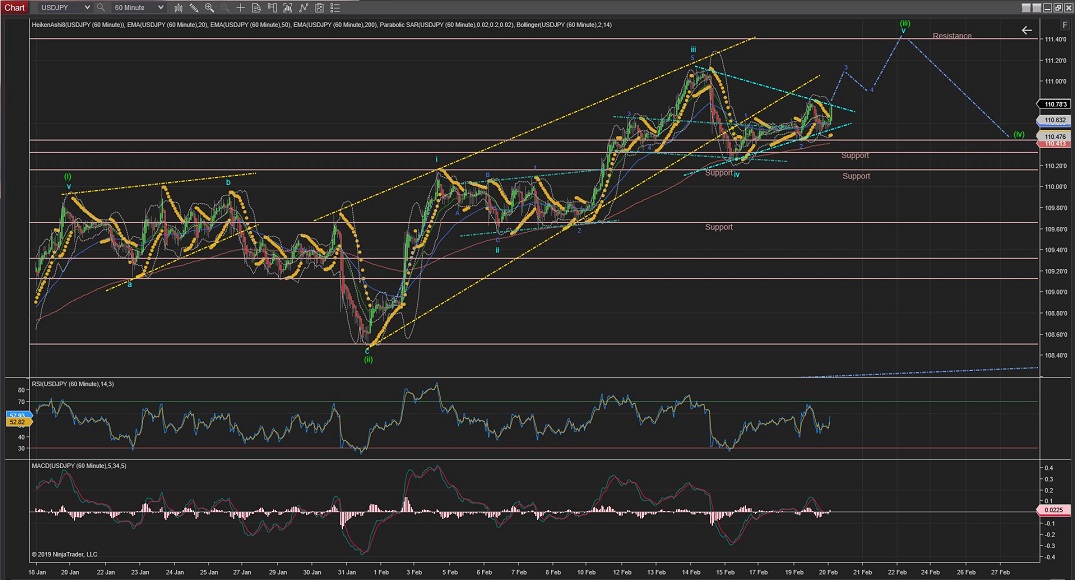
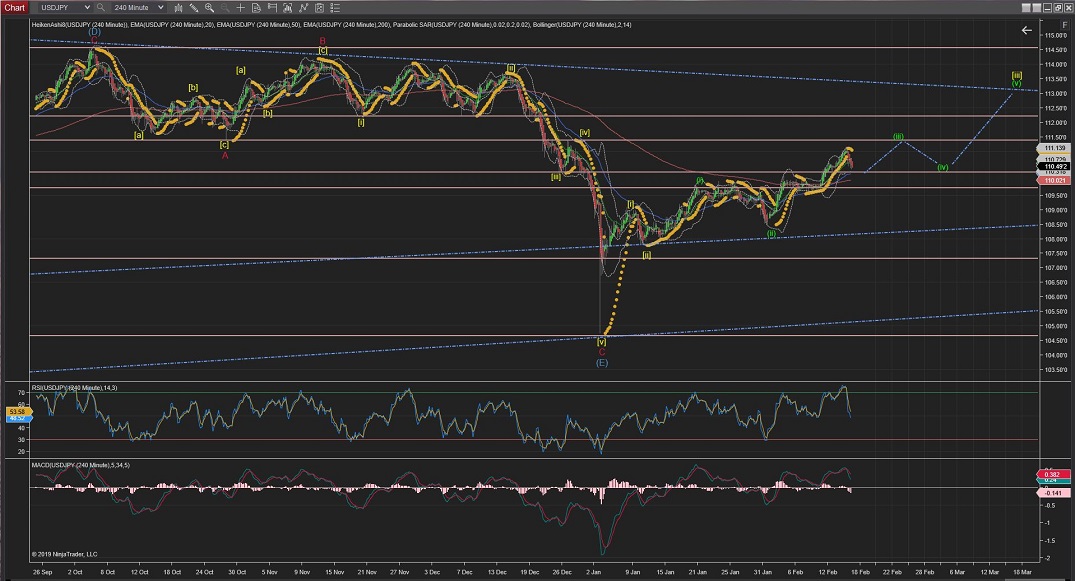
USDJPY has formed a triangle in the raise of current Wave v which I would expect to break out higher to complete Wave (iii).
Should the triangle breaks lower I would have to reconsider the whole count, possibly for two series of larger Waves (i)/(ii) and i/ii.
For now, I would expect prices to go higher towards the 111.40 resistance levels and possibly break those resistance levels.
60Mins
4Hours
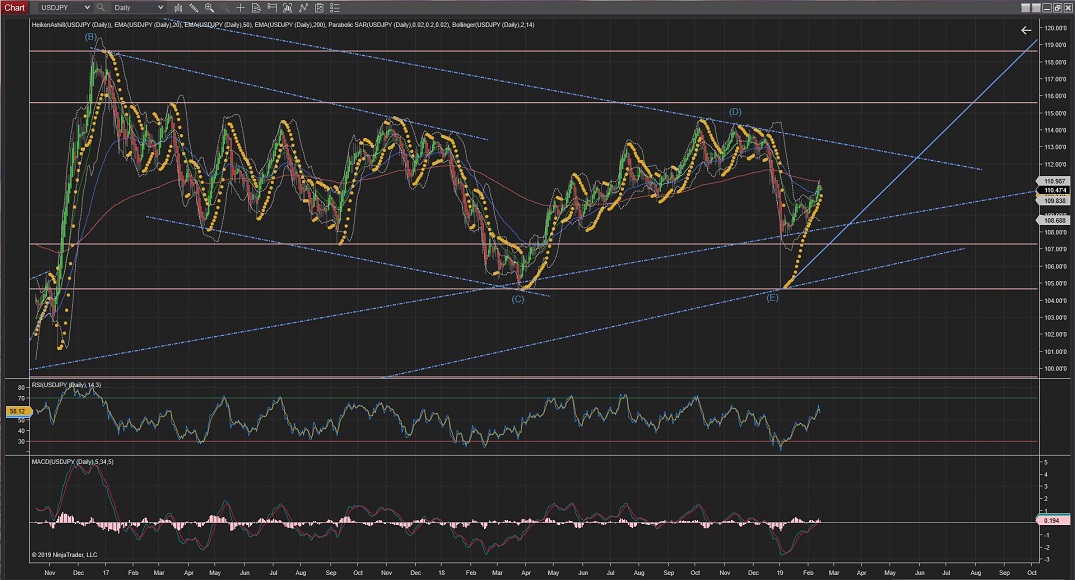
Daily
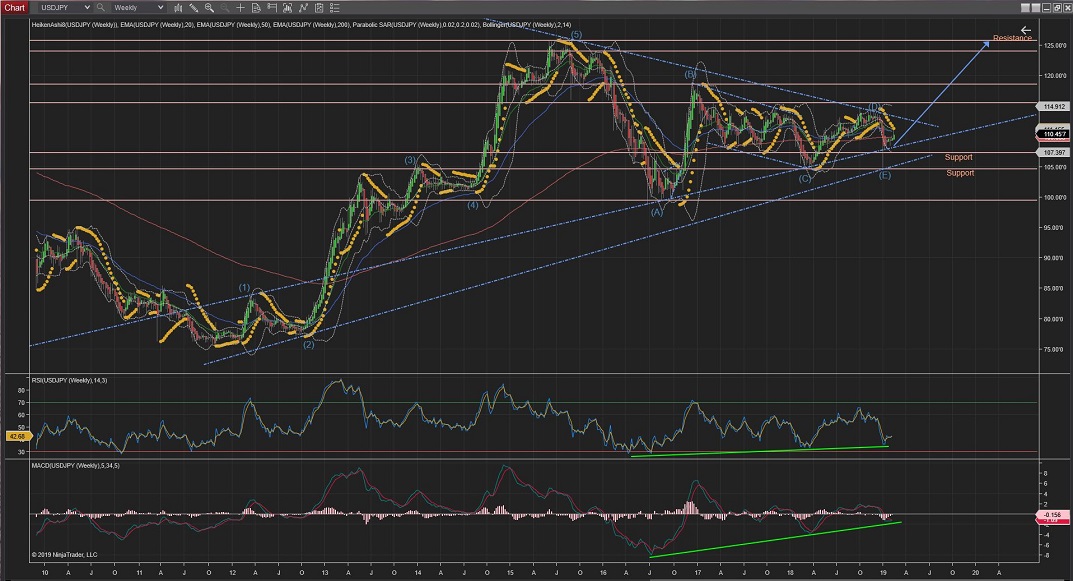
Weekly
USDCAD
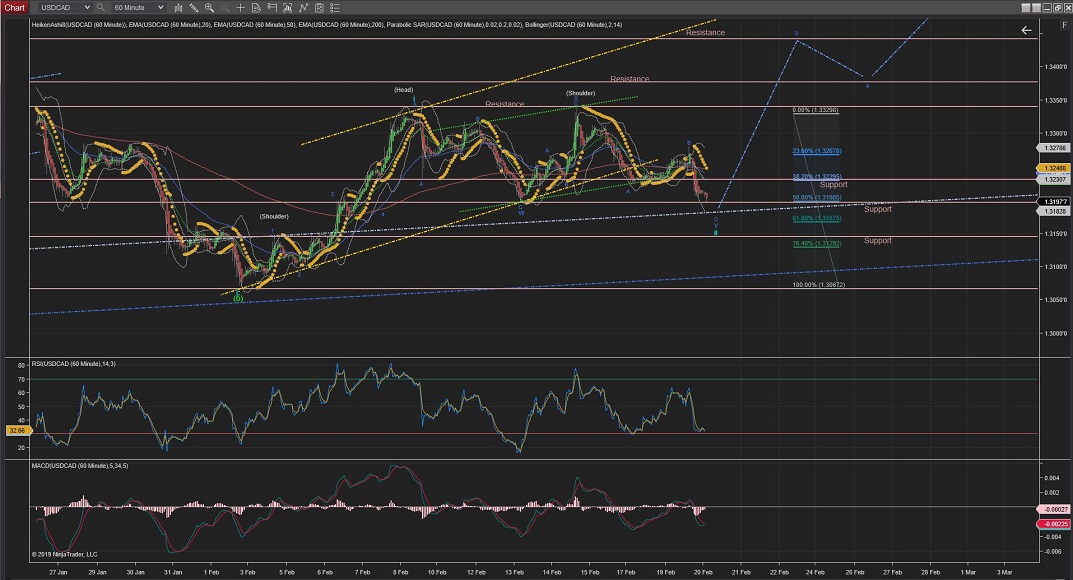
USDCAD has triggered the alternate count for a lower Wave ii which should finish around the %62 Fib retracement area where the lower trend should serve as a level of support.
Once Wave ii is complete, it will start the beginning of Wave 3 up (of Wave iii) towards resistance levels at around 1.3440.
60Mins
4Hours
Daily
USDCHF
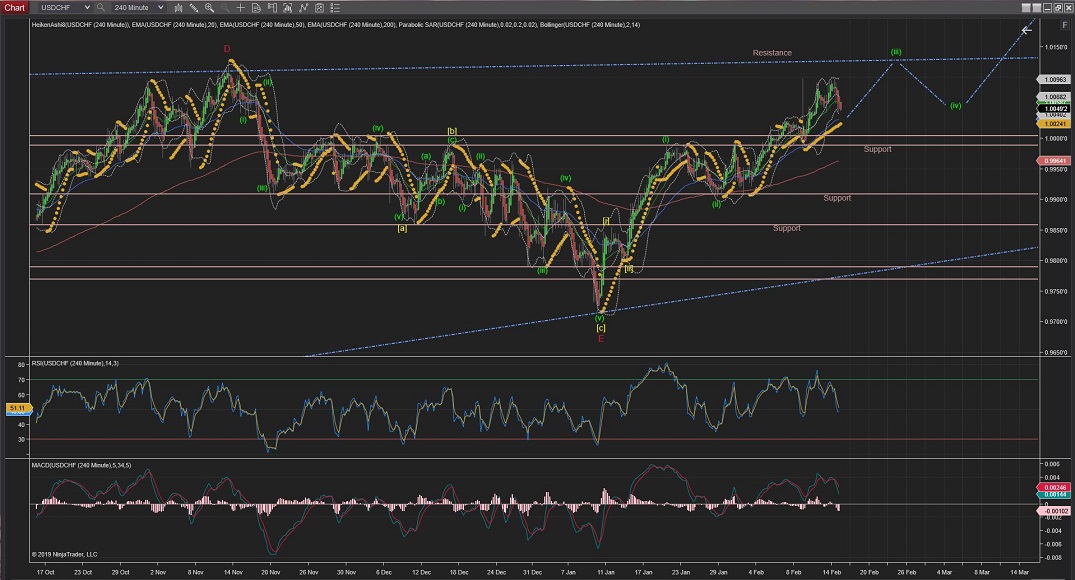
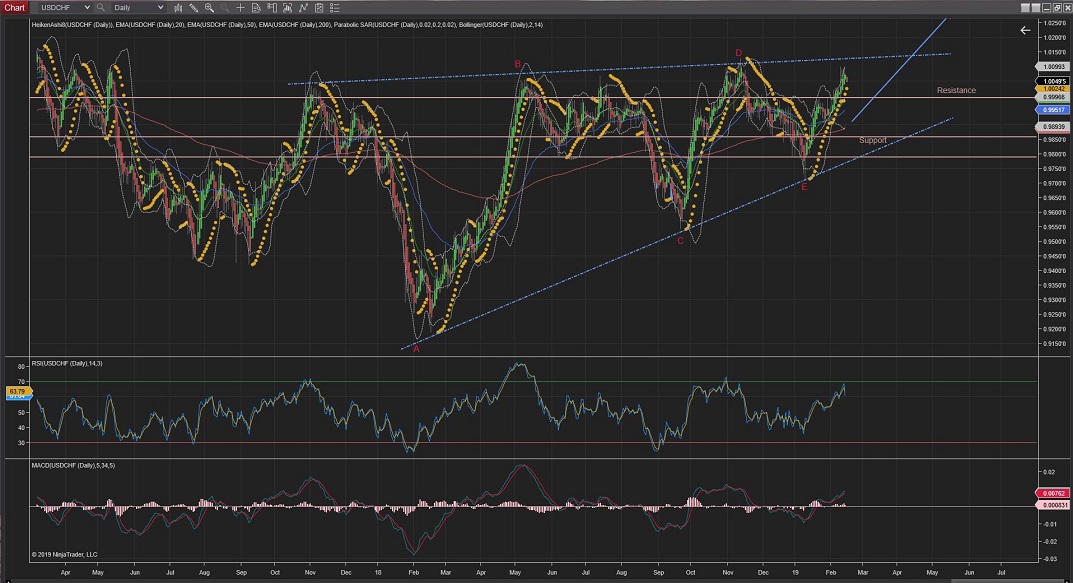
USDCHF has made a lower fall towards support at the 1.0000 area where the prices should hold above the highest of Wave i for this count to remain valid.
From here the prices should start raising to make Wave v to complete Wave (iii) on the upper long-term trend at the 1.0125 area.
During the week, once Wave (iii) is completed, we should see Wave (iv) correction to comeback to the Wave iv levels again.
60Mins
4Hours
Daily
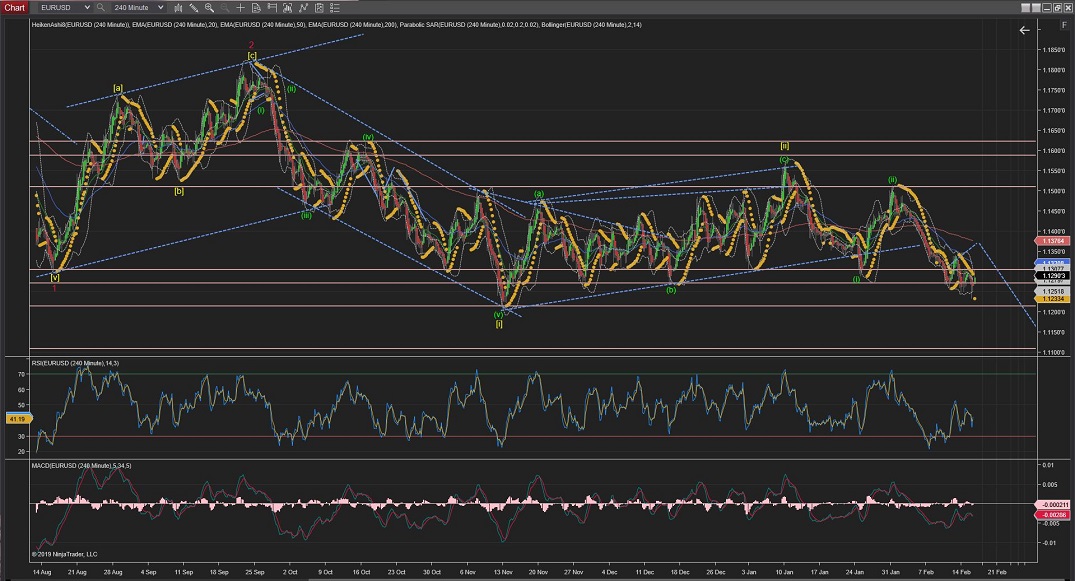
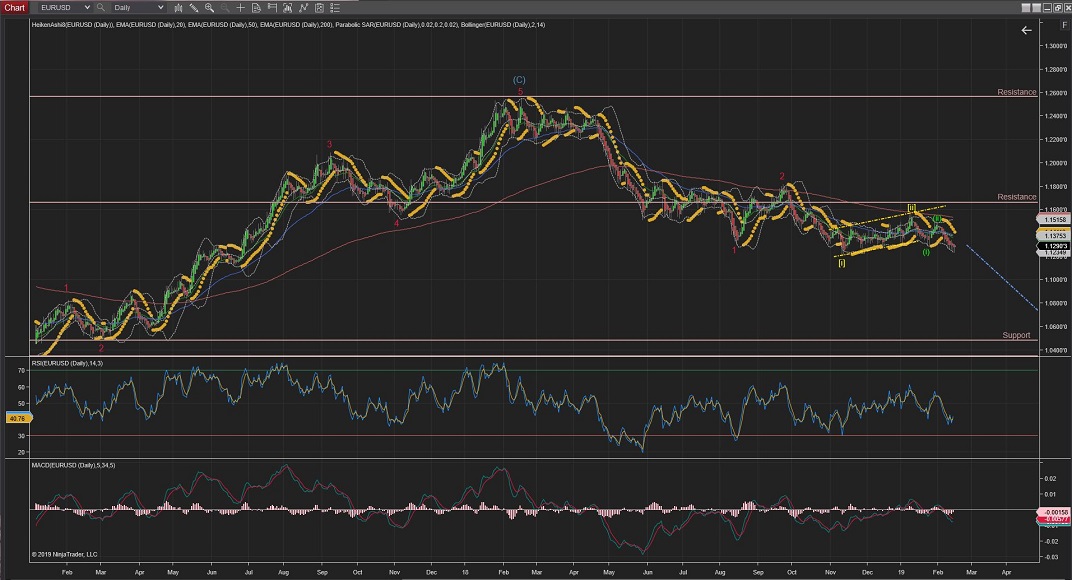
EURUSD
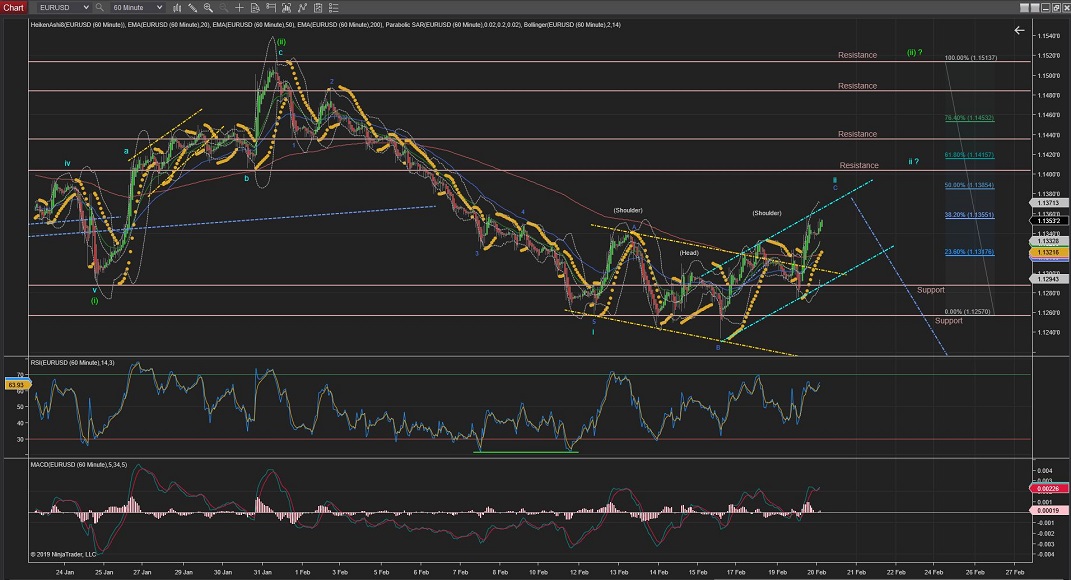
EURUSD triggered the alternate count also for a higher Wave ii going towards the %50 Fib retracement on a new small trend channel.
From there the prices should start sliding down in an impulsive fashion to show the start of Wave iii downwards.
Once Wave iii is confirmed on the way (by crossing the lowest of Wave i) we should see impulsive moves to the downside crossing resistance levels located at 1.1214 (by previous Wave [i] (green), which would confirm Wave [iii] (green) also on the way (best pictured in the 1Hour Chart).
60Mins
4Hours
Daily
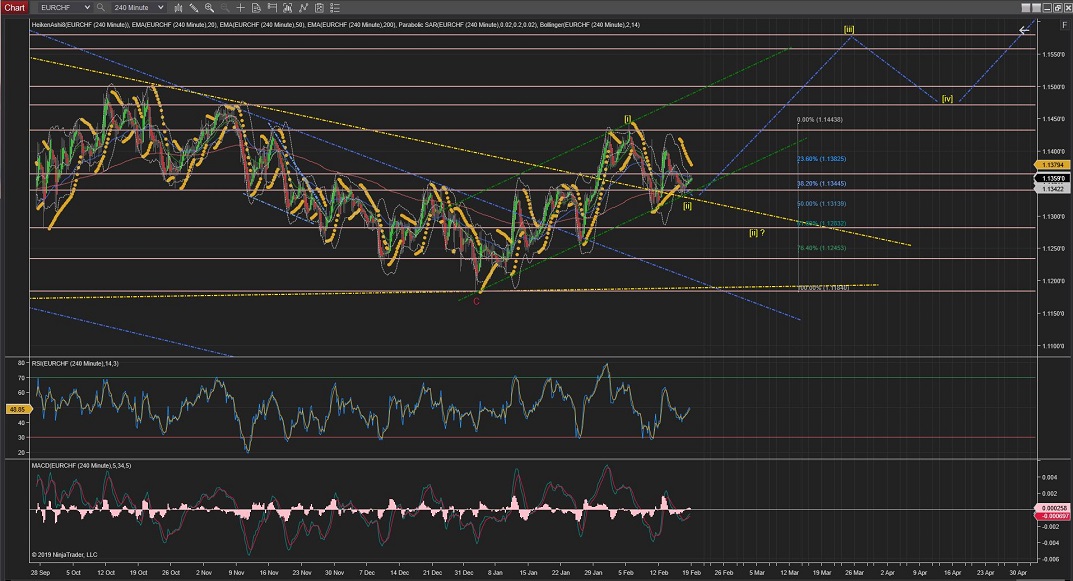
EURCHF
EURCHF might have completed Wave [ii] today forming a wedge which triggered the end of Wave [ii] and consequently a raise to indicate the start of Wave (i) upwards towards resistance levels at the 1.1440 area.
Next the raise should carry on with impulsive moves to the upside.
60Mins
4Hours
Daily
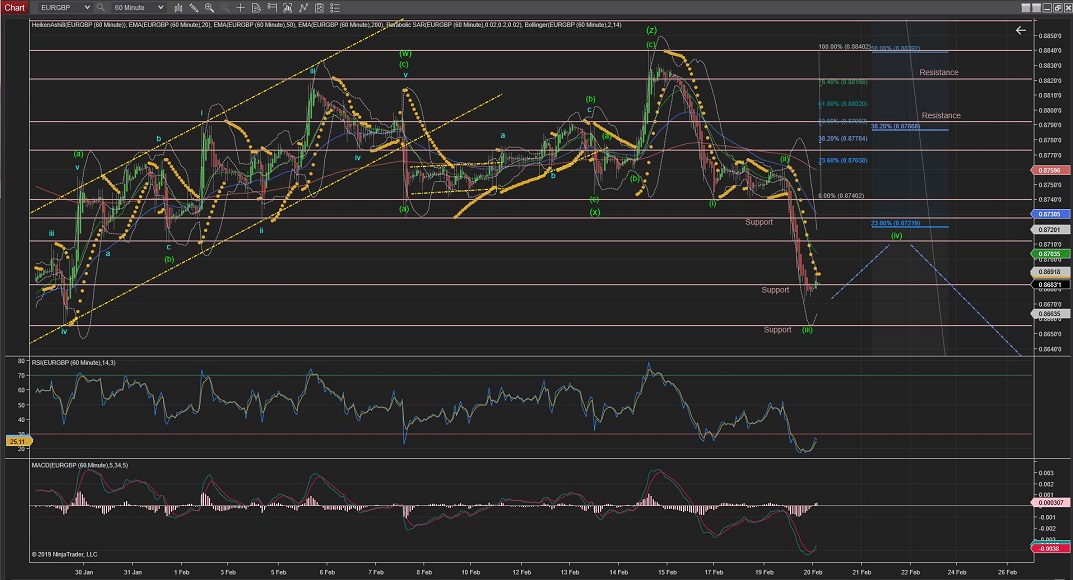
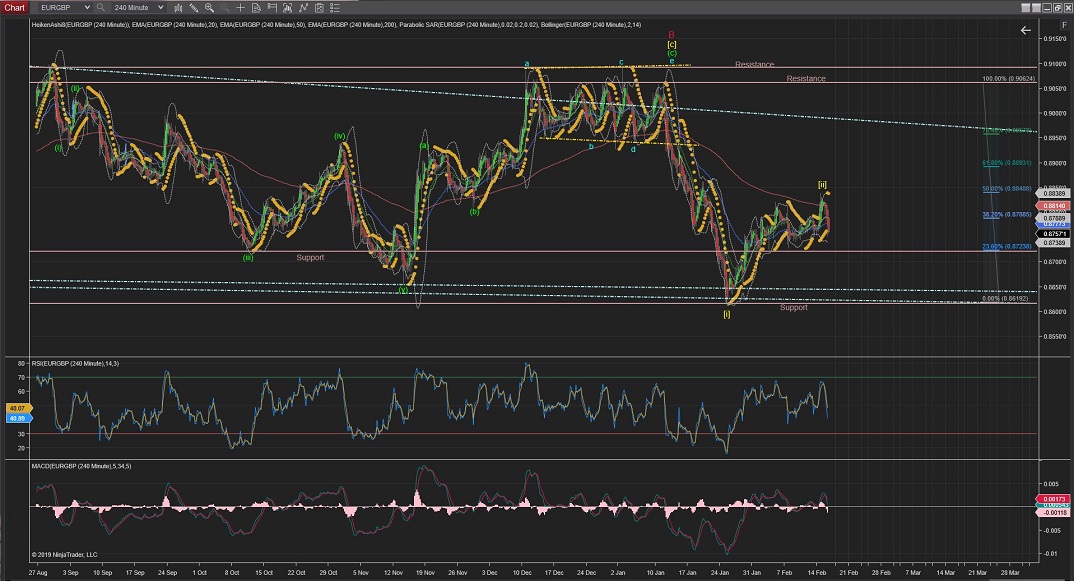
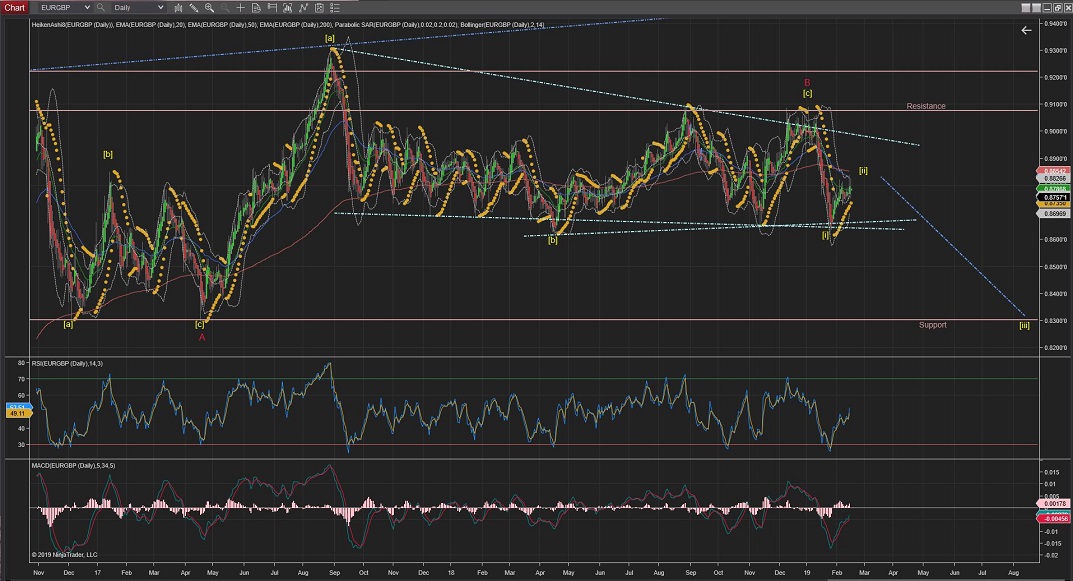
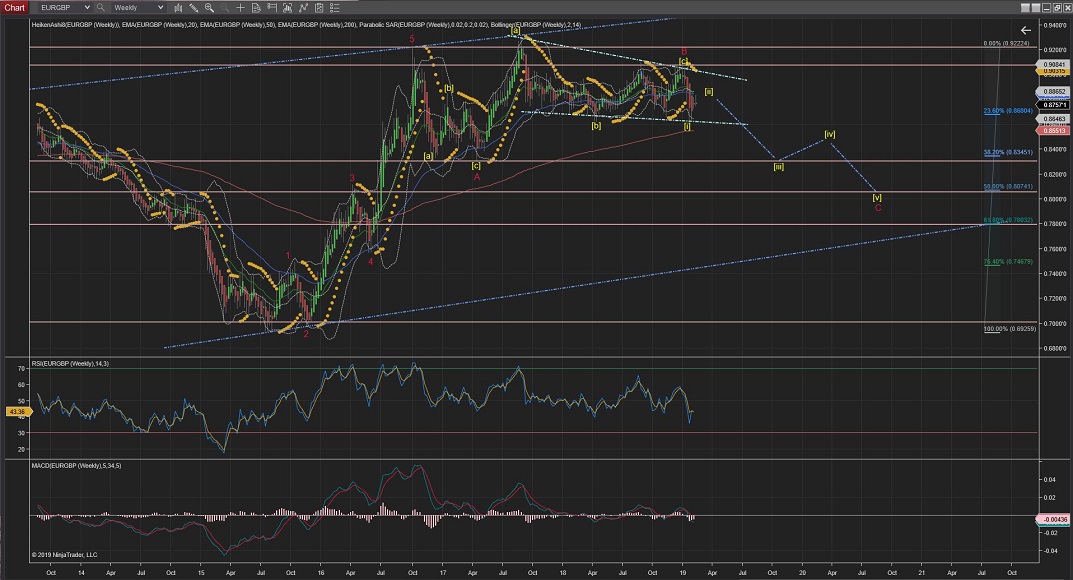
EURGBP
EURGBP completed a short Wave (ii) correction yesterday at %23 Fib retracement, followed by a quick and very impulsive Wave (iii) to the downside which stalled now but could carry on to the next level of support at 0.8655 before Wave (iv) correction starts.
60Mins
4Hours
Daily
Weekly
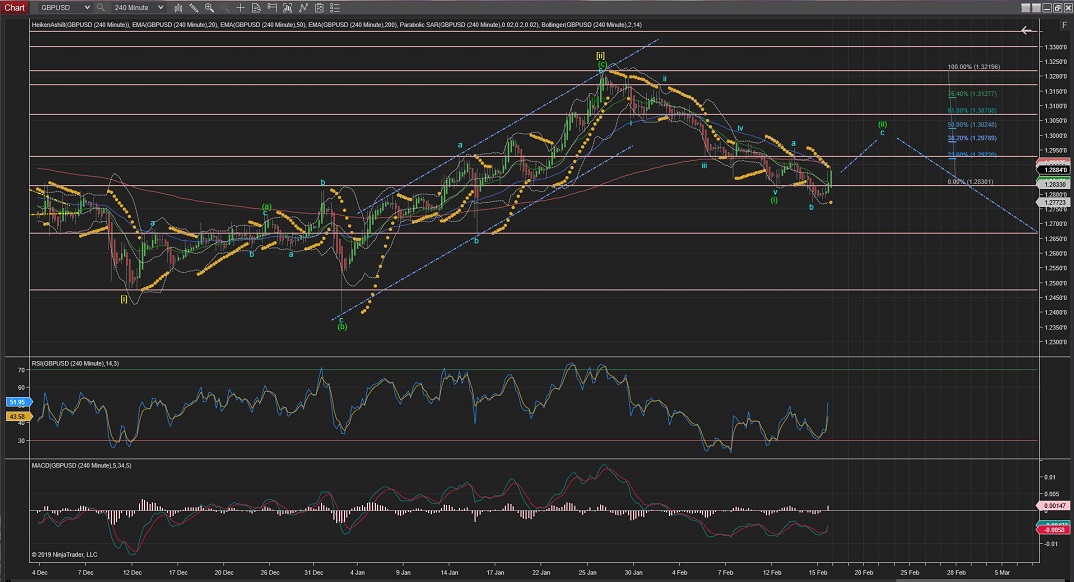
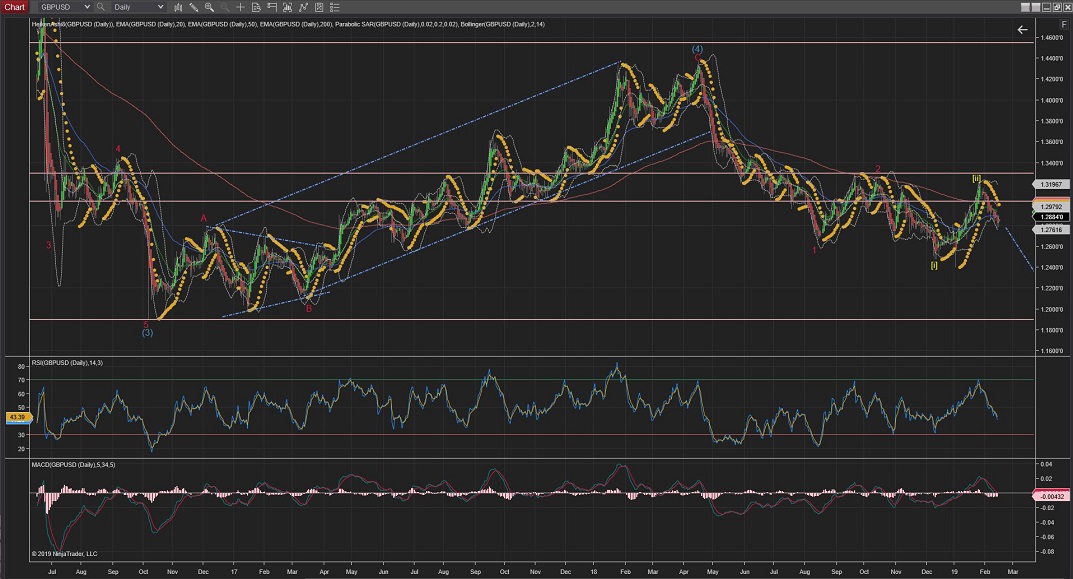
GBPUSD
GBPUSD did an impressive raise today for Wave (ii) towards the %62 but with momentum to still raise higher towards the %76 Fib retracement before the correction is completed.
If the prices start falling lower in a impulsive fashion we could say that Wave (iii) has started.
And, once the price continues below support levels created by previous Wave (i), we could confirm that Wave (iii) is underway and the next levels of support would be at 1.2665
Even lower, the next support formed by the previous Wave [i] would be 1.2475, which, once crossed, would confirm Wave [iii] underway. (best pictured in the 4Hour Chart).
60Mins
4Hours
Daily
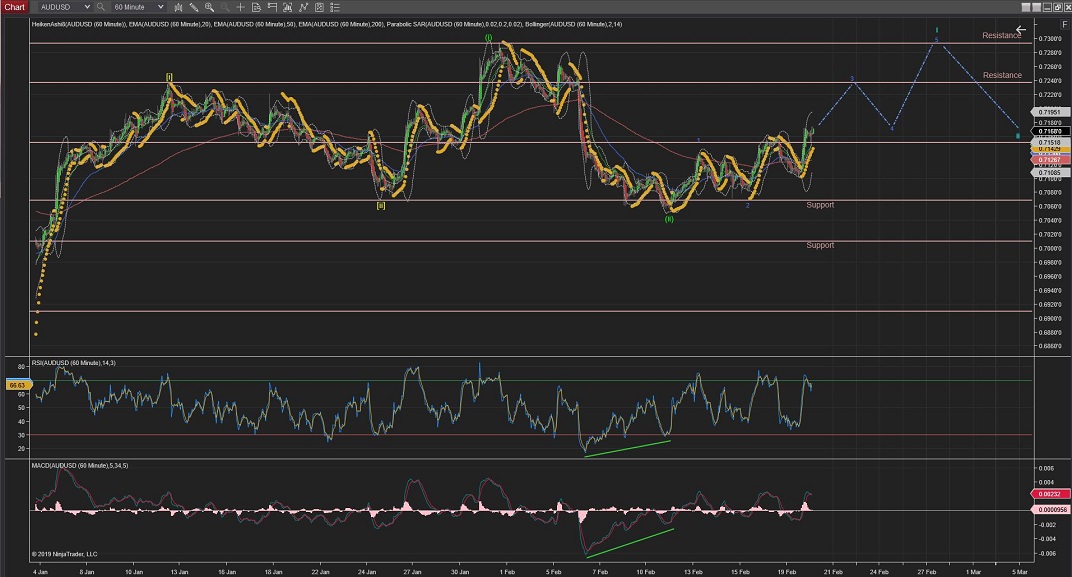
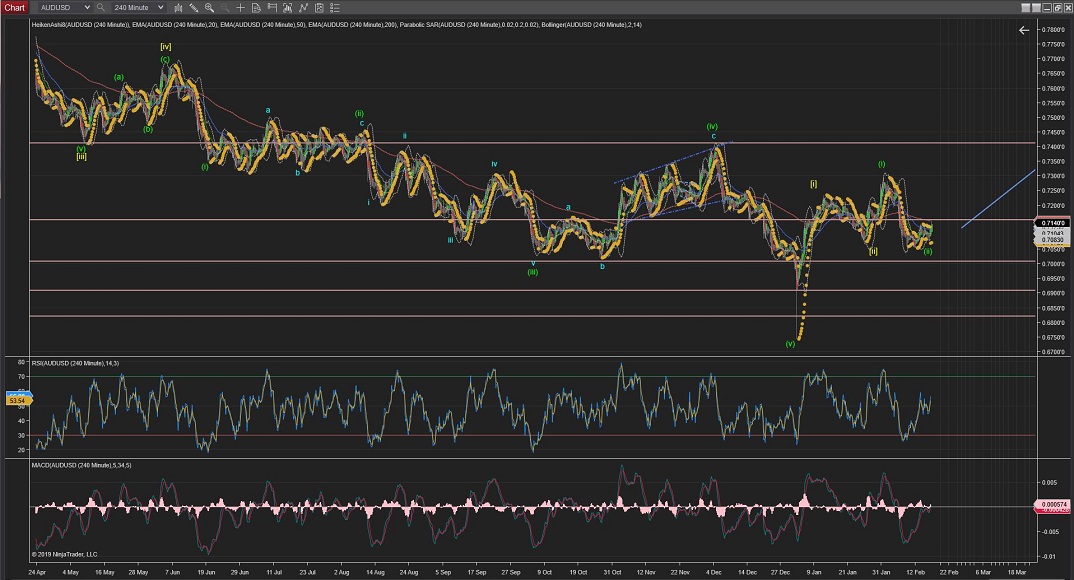
AUDUSD
AUDUSD has raised higher to continue the expected Wave 3 of Wave i upwards and tomorrow should continue in the same fashion.
The support level (0.7057) made by previous Wave (ii) it is still holding this price for this current count to be valid.
60Mins
4Hours
Daily
Weekly
All the best for everyone.
Andres


 Trading Waves .org