Mon 18-02-2019
Hi everyone, hope you are all good and had a great start of the week.
USDJPY
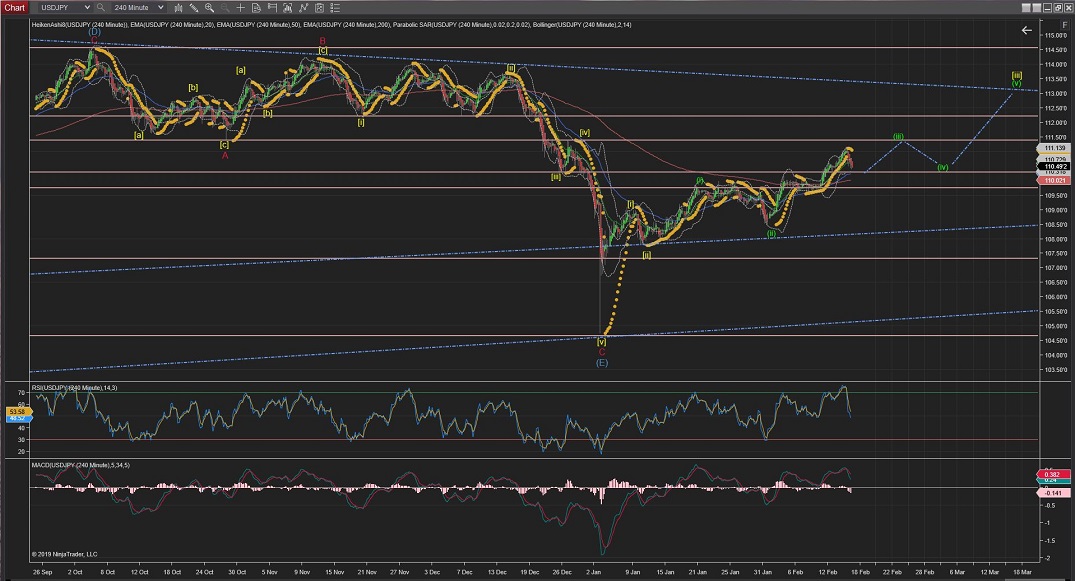
USDJPY seemed to have started an impulsive wave (Wave 1) for Wave v and now doing a correction with Wave 2.
If the prices go lower than 110.32 resistance levels I would review the hourly count but I see that and the next level of support (110.15) as strong levels.
Tomorrow I would expect prices to go higher towards the 111.40 resistance levels.
60Mins
4Hours
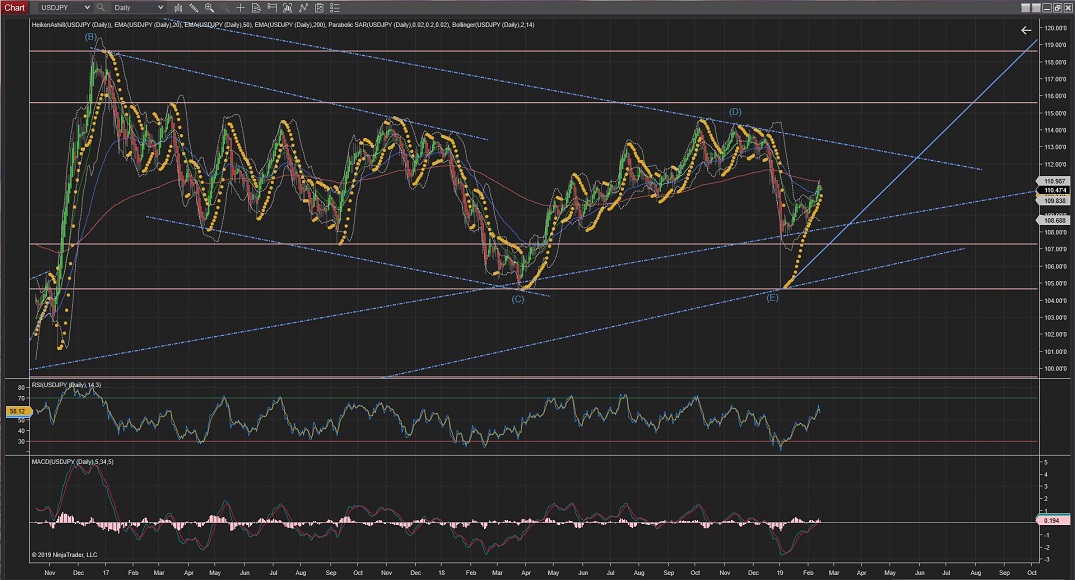
Daily
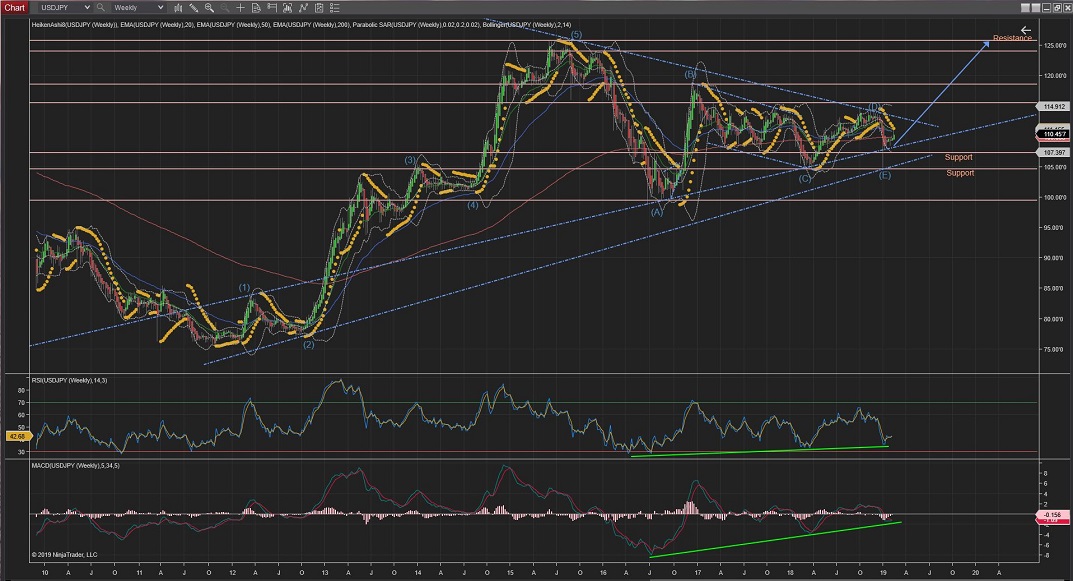
Weekly
USDCAD
USDCAD price stalled at %76 Fib retracement of Wave 1 just below the trend (yellow) forming another smaller trend (green) and it is now raising to what it could be the beginning of Wave 3 up (of Wave iii) break up of the Head and Shoulders formation towards resistance levels at around 1.3440.
60Mins
4Hours
Daily
USDCHF
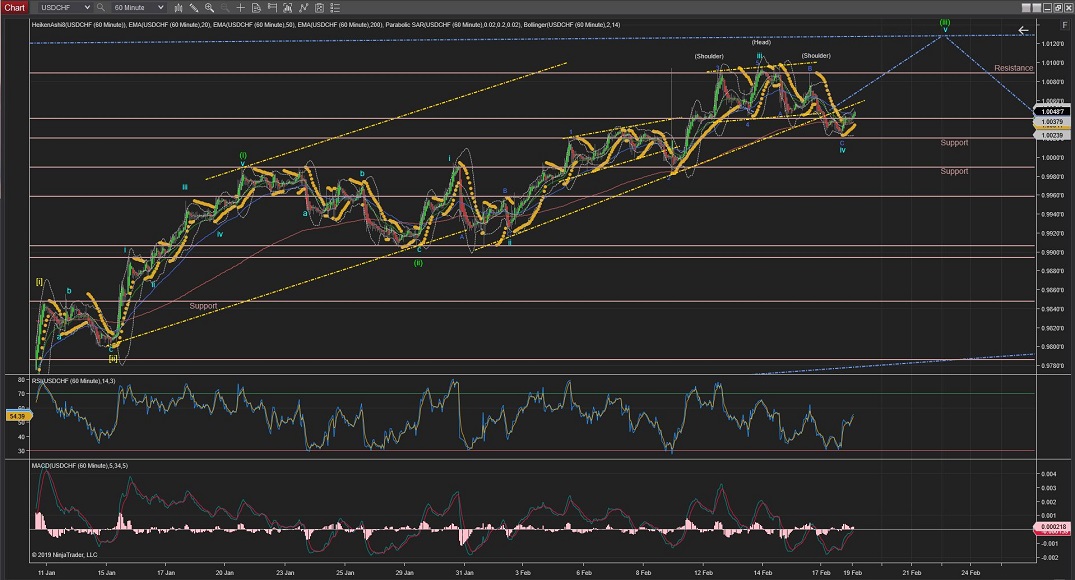
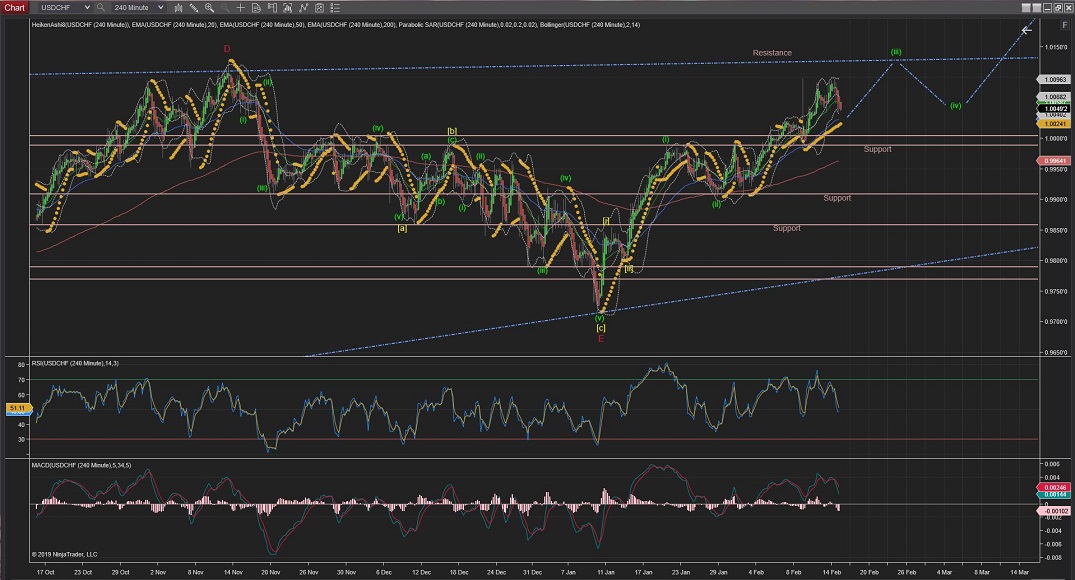
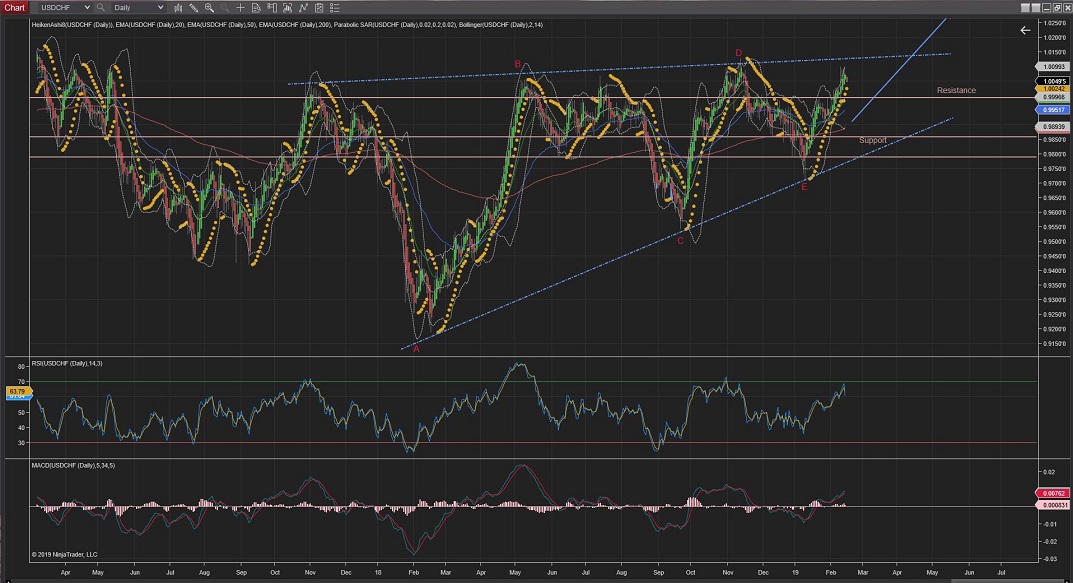
USDCHF; Wave iv completed with Wave C hitting support at the highest of previous Wave 1 and it is now on the first wave up of Wave v towards the upper long term trend.
As per current count, prices should bounce of the trend on the market open and raise on Wave v to complete Wave (iii) on the upper long-term trend at the 1.0125 area.
During the week, once Wave (iii) is completed, we should see Wave (iv) correction to comeback to the Wave iv levels again.
60Mins
4Hours
Daily
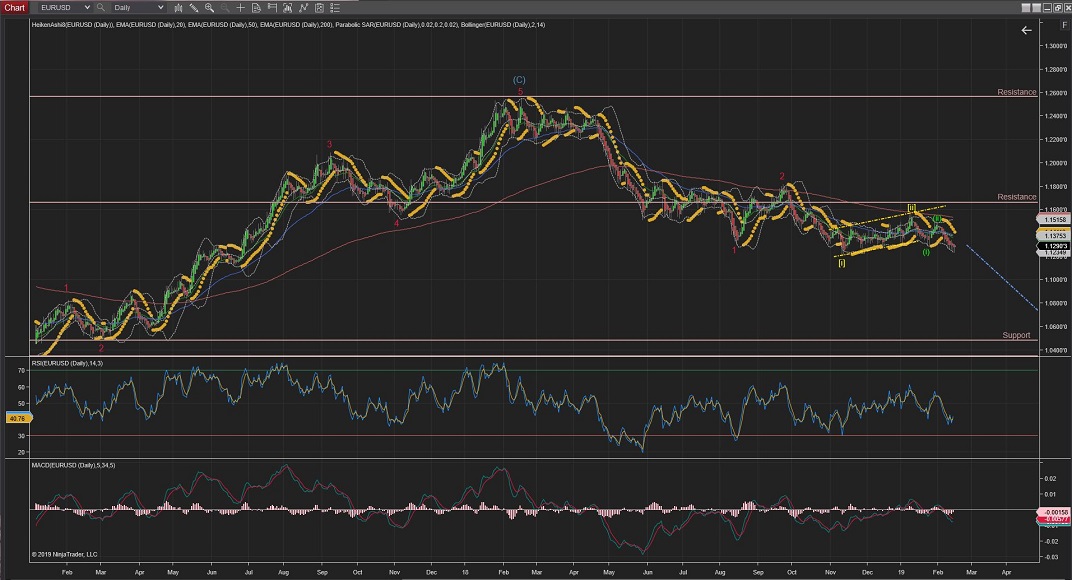
EURUSD
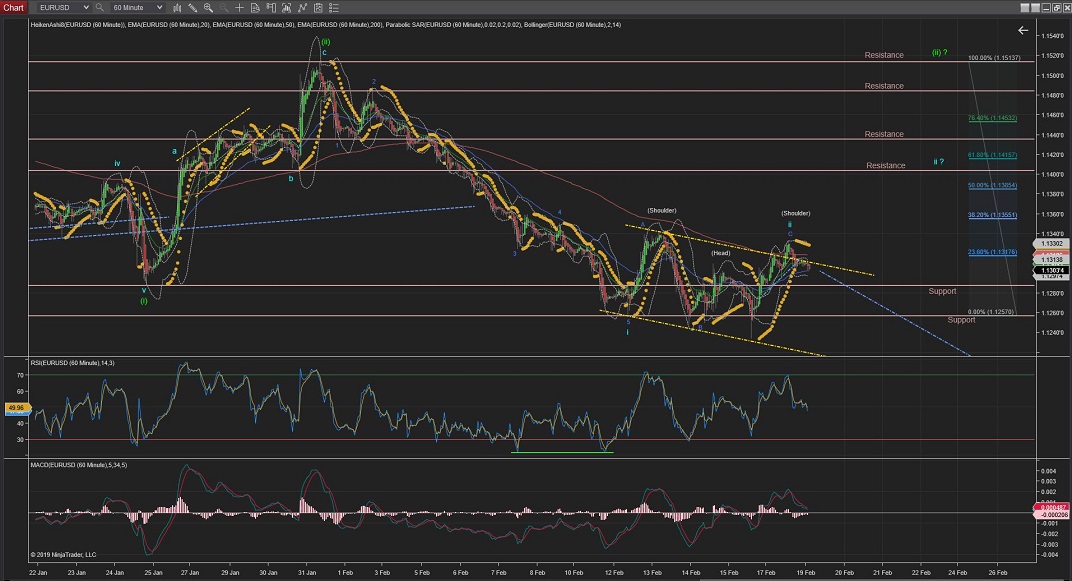
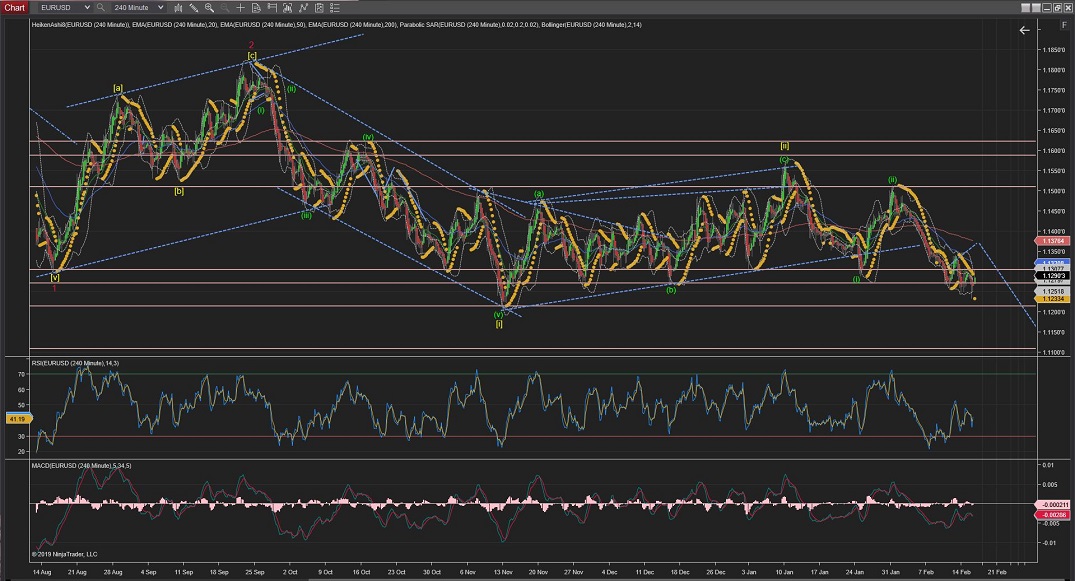
EURUSD seemed to have finished Wave C of Wave ii in a trend now forming the top of the right shoulder formation and, unless the prices move higher to trigger the alternate count, prices should now start moving lower to start impulsive wave on Wave iii of Wave (iii).
Once Wave iii is confirmed on the way (by crossing the lowest of Wave i) we should see impulsive moves to the downside crossing resistance levels located at 1.1214 (by previous Wave [i] (green), which would confirm Wave [iii] (green) also on the way (best pictured in the 1Hour Chart).
60Mins
4Hours
Daily
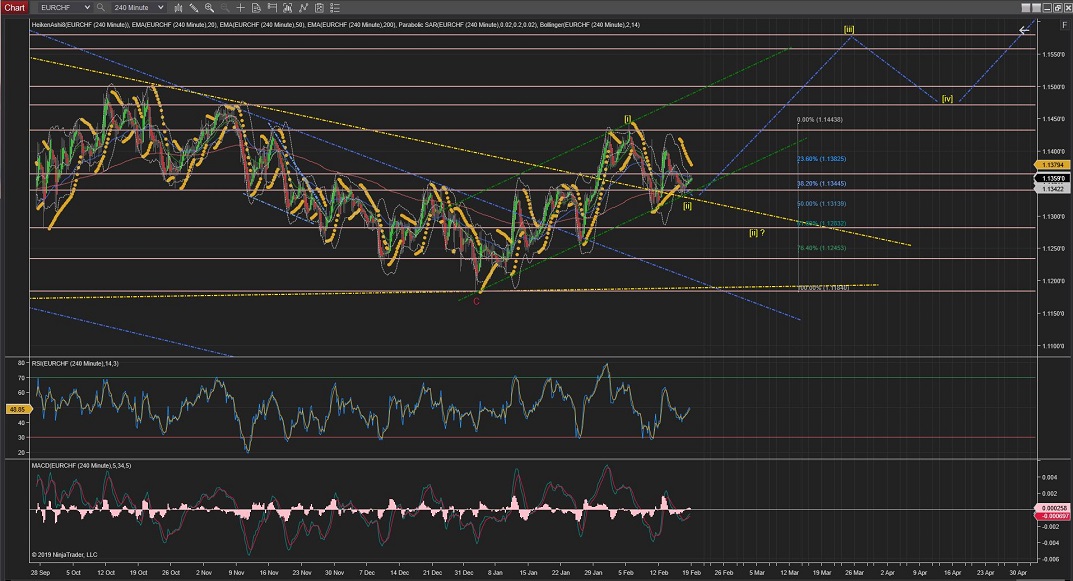
EURCHF
EURCHF might have completed Wave [ii] today forming a wedge which can trigger the start of Wave (i) upwards towards resistance levels at the 1.1440 area.
If the wedge break out turns lower, it will trigger the alternate count for a lower Wave [ii], although I would not expect to go very far down as there are several levels of support formed now.
60Mins
4Hours
Daily
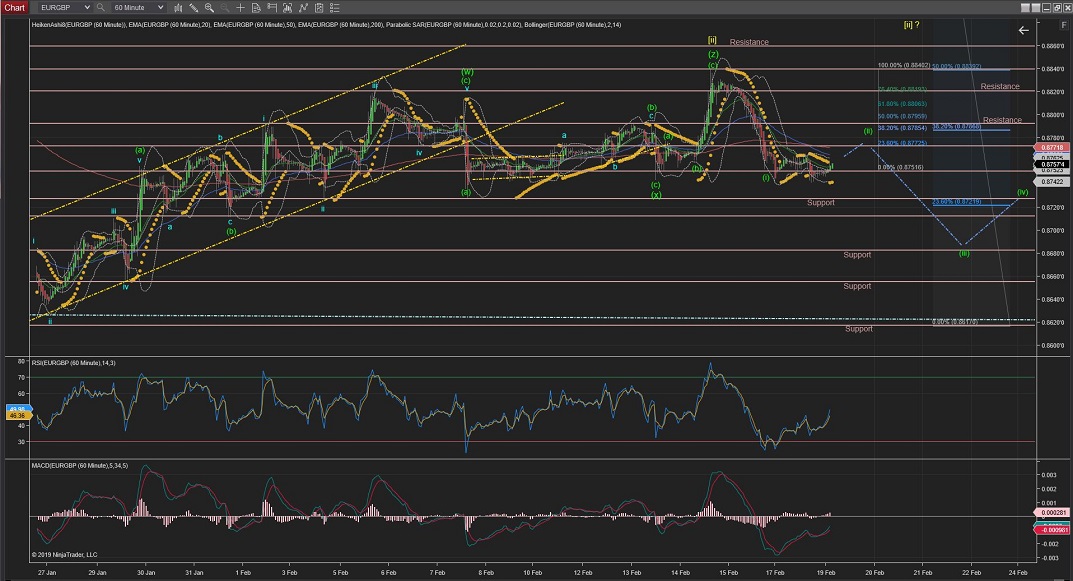
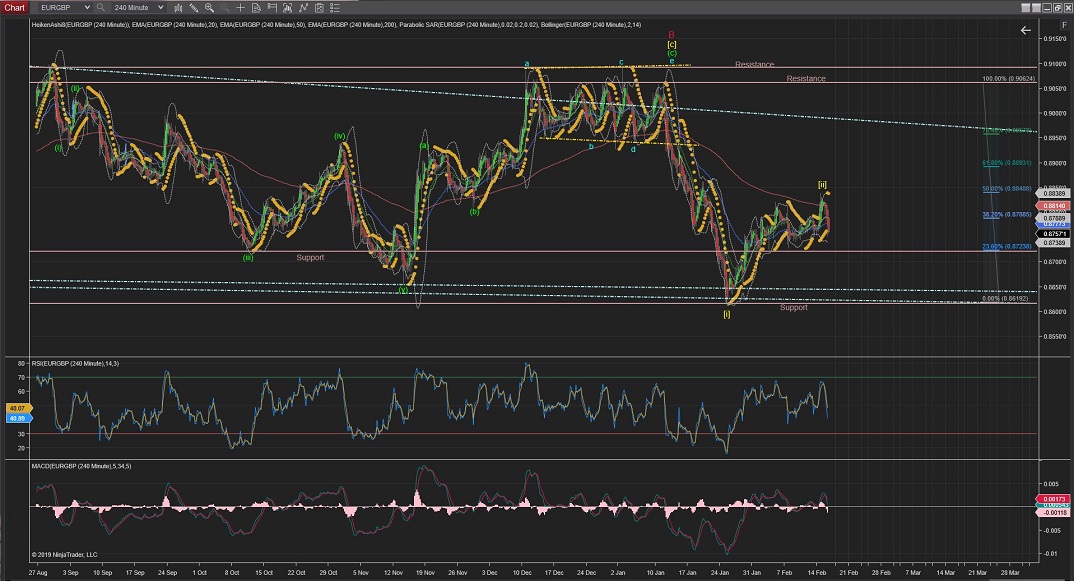
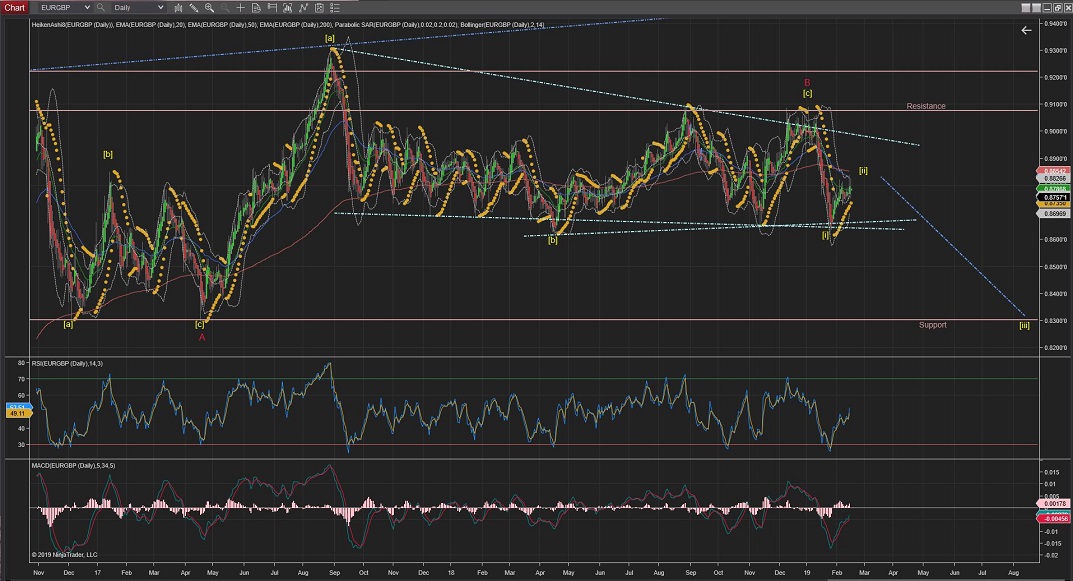
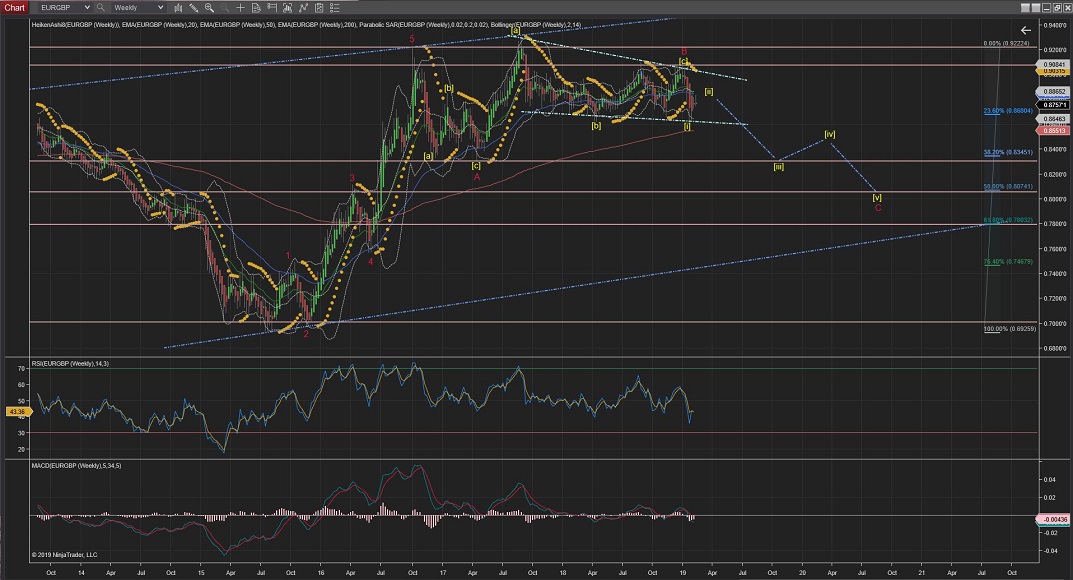
EURGBP
EURGBP is developing now Wave (ii) into what appears to be a small flat correction which might be completed before the %50 Fib correction to start the Wave (iii) to the downside again.
60Mins
4Hours
Daily
Weekly
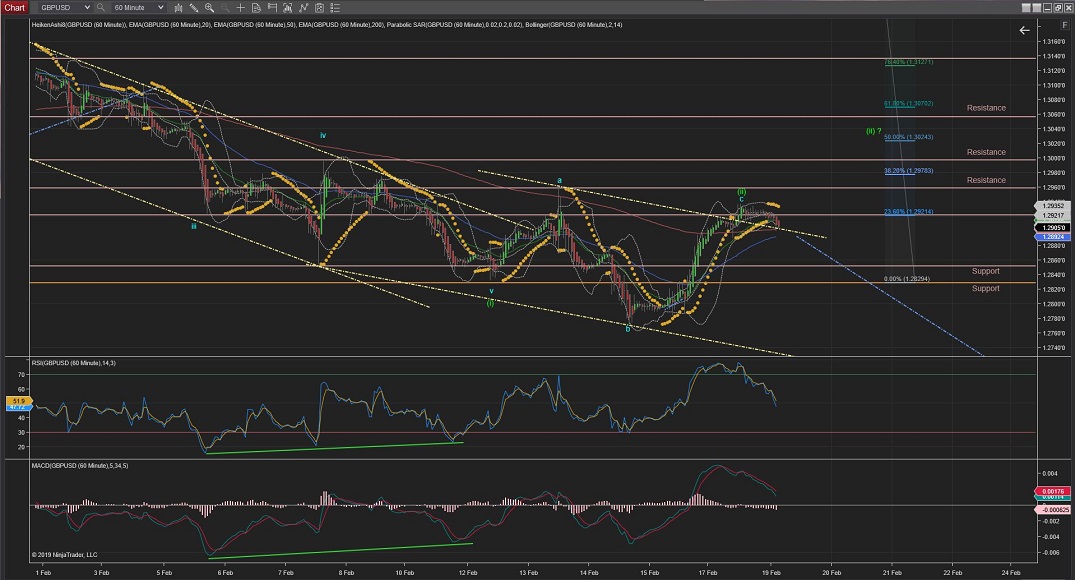
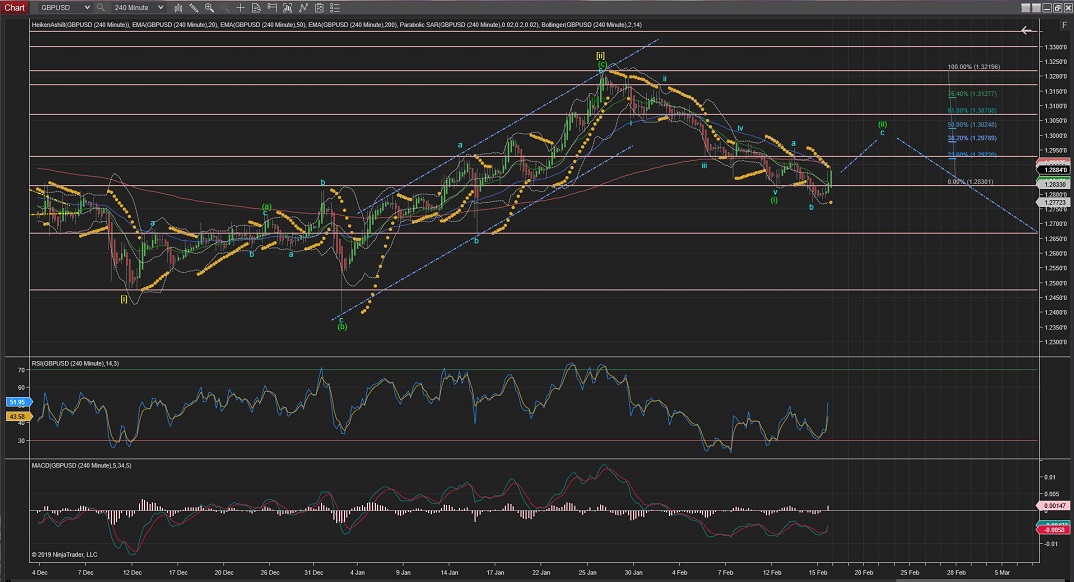
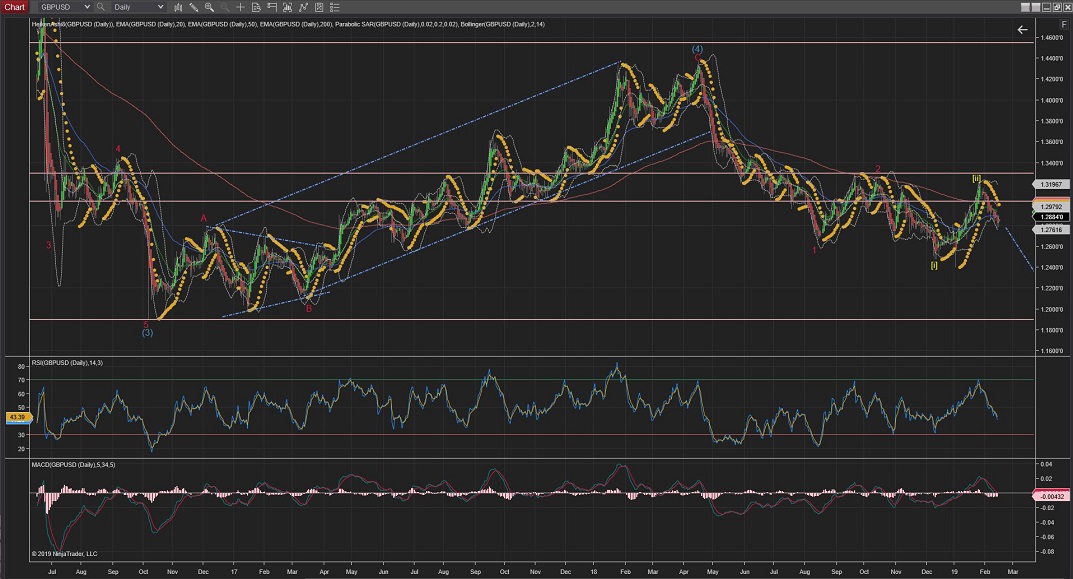
GBPUSD
GBPUSD seem to have completed Wave (ii) just below the highest of Wave a at just above the %23 Fib retracement.
If the prices start falling lower in a impulsive fashion we could say that Wave (iii) has started.
And, once the price continues below support levels created by previous Wave (i), we could confirm that Wave (iii) is underway and the next levels of support would be at 1.2665
Even lower, the next support formed by the previous Wave [i] would be 1.2475, which, once crossed, would confirm Wave [iii] underway. (best pictured in the 4Hour Chart).
60Mins
4Hours
Daily
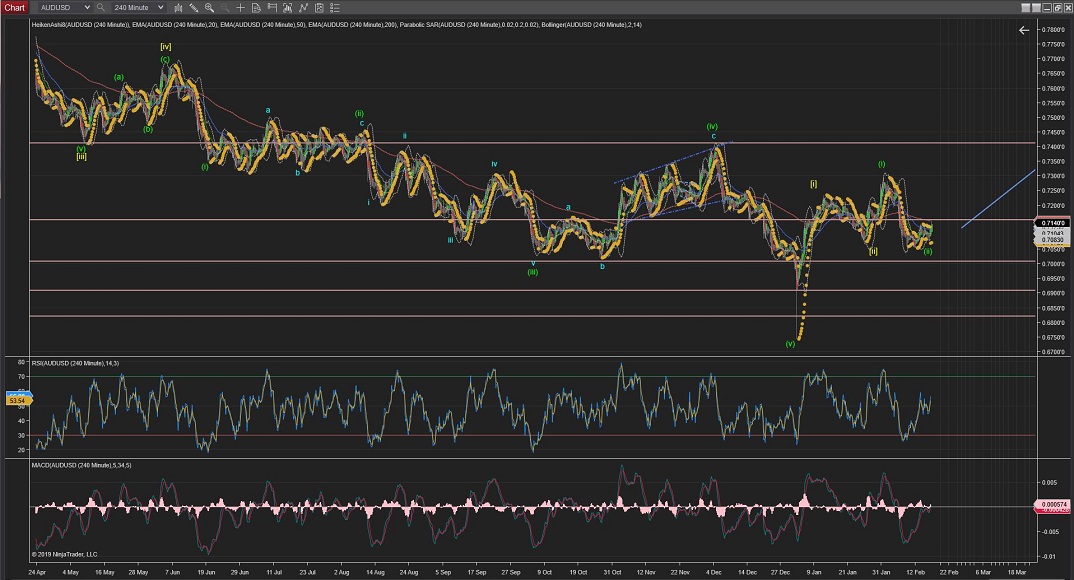
AUDUSD
AUDUSD has, once again failed to pickup higher for Wave 3, although that could be the sign of a larger Wave 3 where the current formation is just its internal Wave 2 correction; tomorrows impulsive raise would confirm this count.
The support level (0.7057) made by previous Wave (ii) it is still holding this price for this current count to be valid.
60Mins
4Hours
Daily
Weekly
All the best for everyone.
Andres


 Trading Waves .org