Fri 15-02-2019
Hi everyone, hope you are all OK and had a nice weekend.
USDJPY
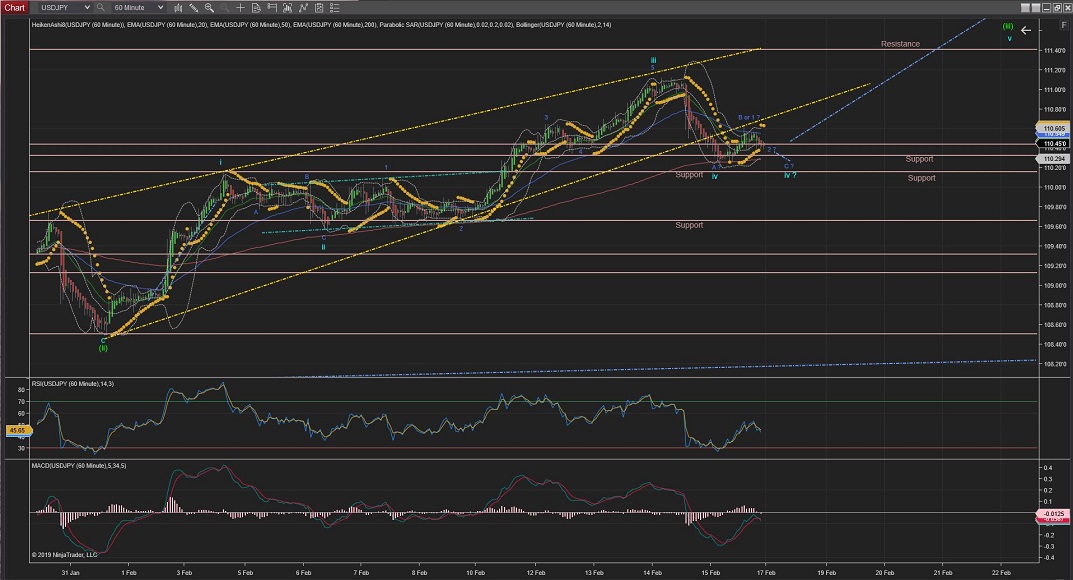
USDJPY finished the week with Wave iv complete if the last waves are Wave 1 and 2 (blue) or... Wave iv is about to complete with Wave C falling slightly more towards support at 110.33 area.
Either way, from Wave 2 at currents price or Wave C (if it falls down towards 110.33), Monday we should see the prices to raise higher to complete Wave (iii) with what I would expect as an impulsive move in Wave v at the 111.40 resistance barrier or, if extended, crossing that resistance towards the next resistance at 112.22.
60Mins
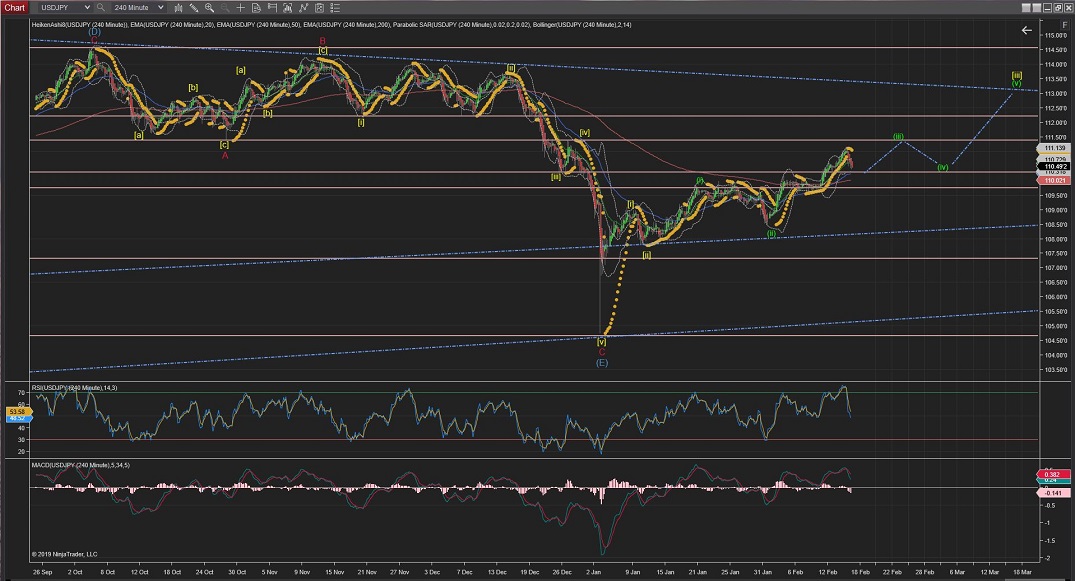
4Hours
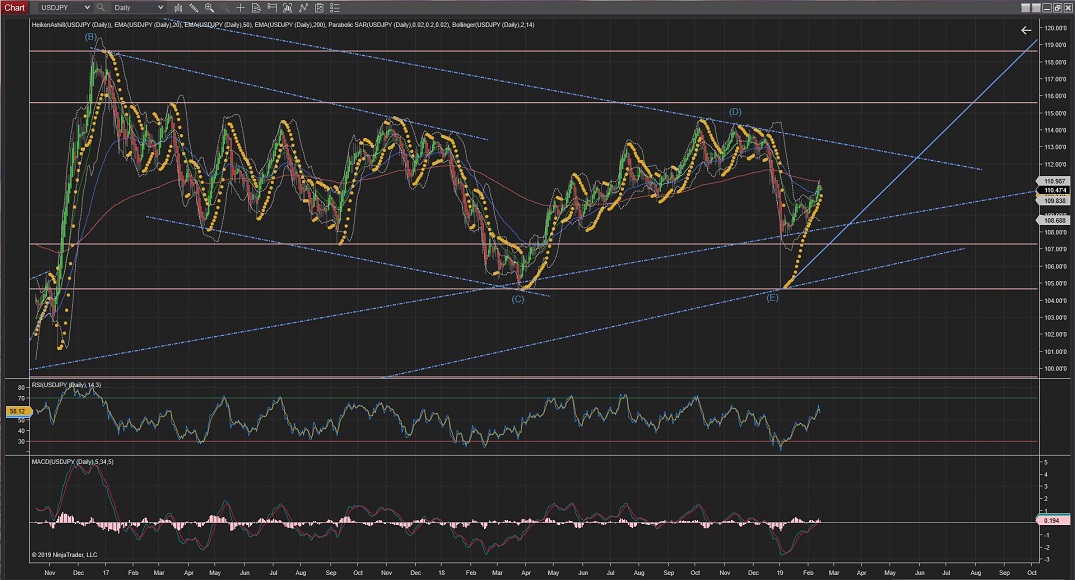
Daily
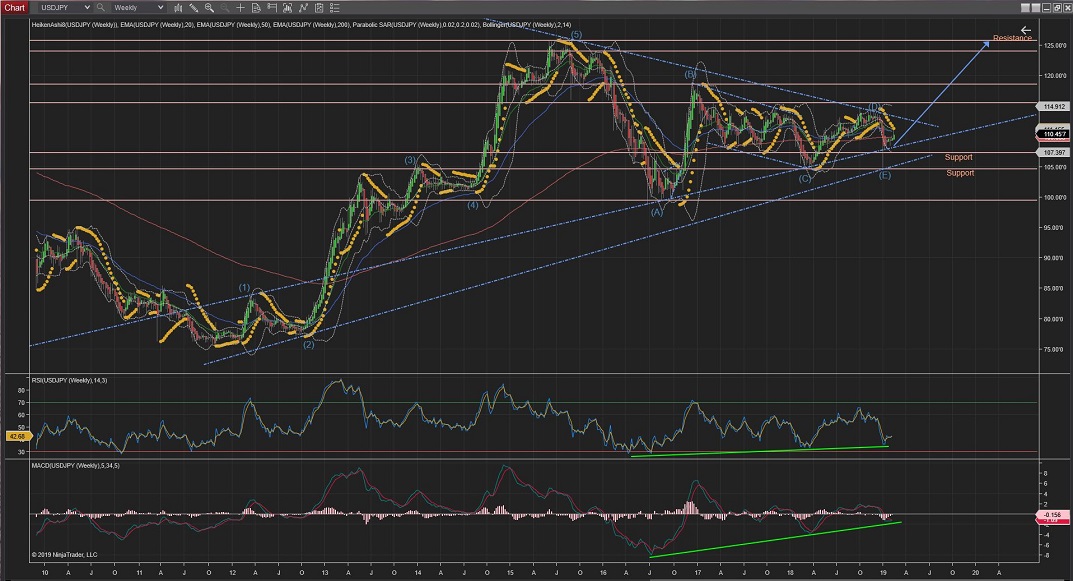
Weekly
USDCAD
USDCAD made a sharp move down towards the lower trend (yellow) to what I believe it is Wave 2 of Wave iii, although there is a possibility (if the trend-line level gets broken) that Wave ii is extended with a larger Wave C;
If prices go lower and the alternate count is triggered, I would expect to continue lower towards support levels at %50 Fib support and the highest of Wave 1 at 1.3144 (between %62 and %76 Fib Retracement) should hold the prices from going lower for this count to remain valid.
The price has formed a Heads & Shoulder formation and, on the current count, prices should start jumping higher with Wave 3 of Wave iii taking place towards target at 1.3440 resistance level.
60Mins
4Hours
Daily
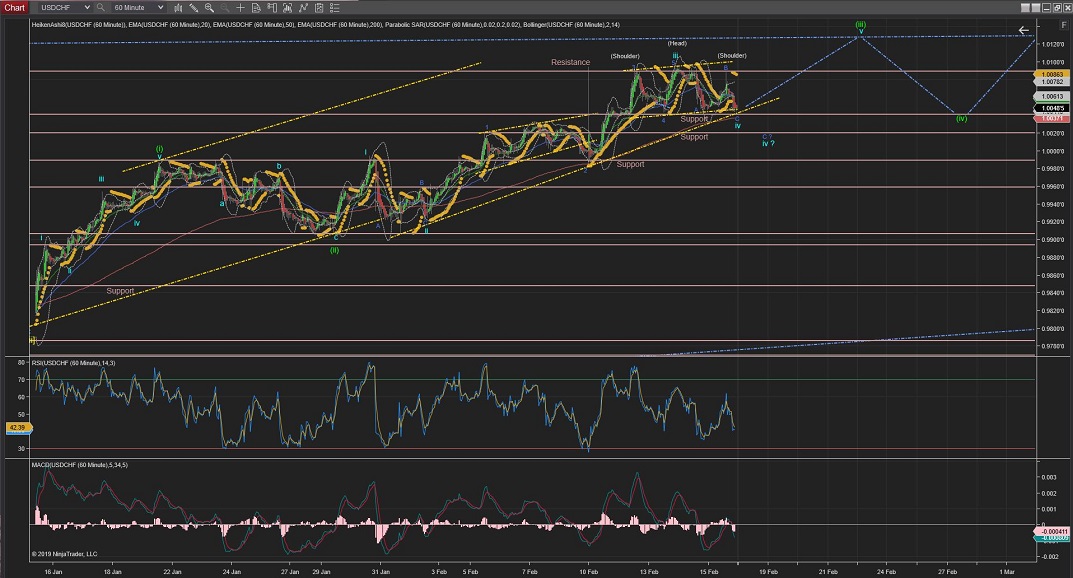
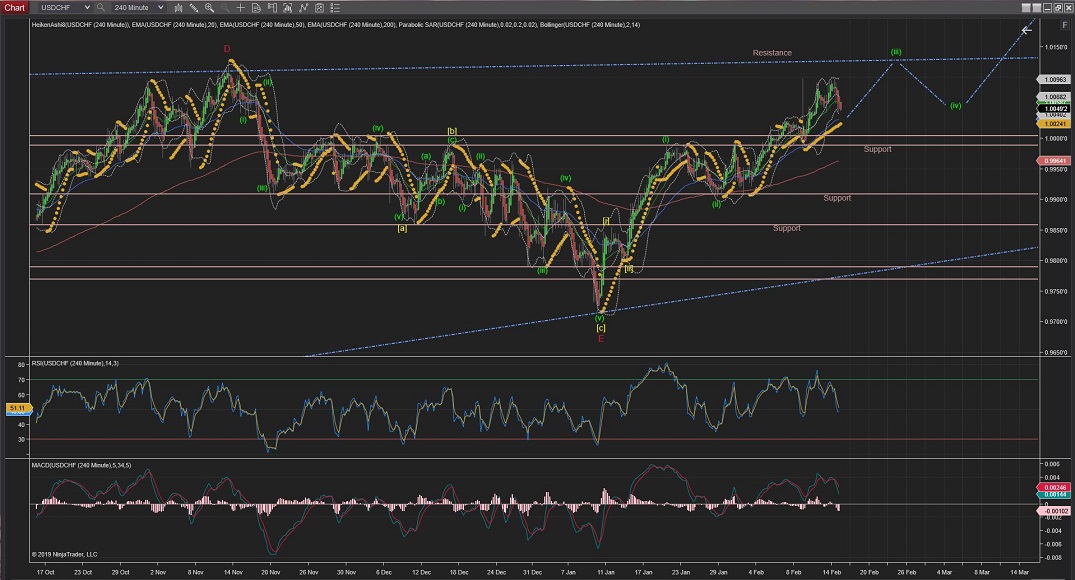
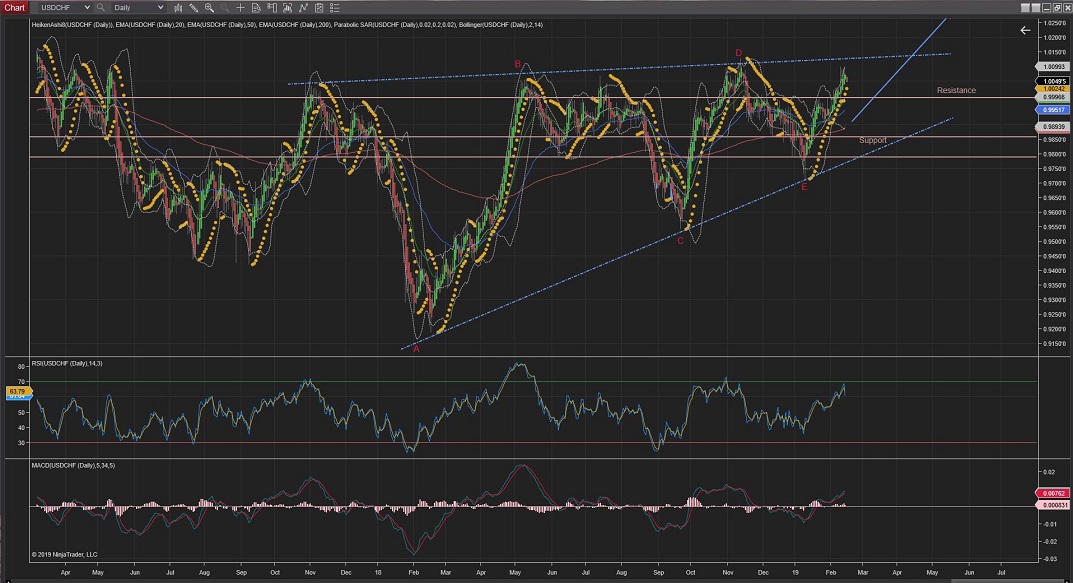
USDCHF
USDCHF; I am more inclined to think that Wave iii is now complete and Wave iv completing with a bounce of the trend (yellow) and 200EMA on the hourly chart.
The alternate count suggest prices to break out the trend to extend Wave iv lower towards the most likely support at 1.0020
(prices should hold above 0.9994 as the highest of Wave i, although very unlikely that it even passes the highest of Wave 1 at 1.0020).
As per current count, prices should bounce of the trend on the market open and raise on Wave v to complete Wave (iii) on the upper long-term trend at the 1.0125 area.
During the week, once Wave (iii) is completed, we should see Wave (iv) correction to comeback to the Wave iv levels again.
60Mins
4Hours
Daily
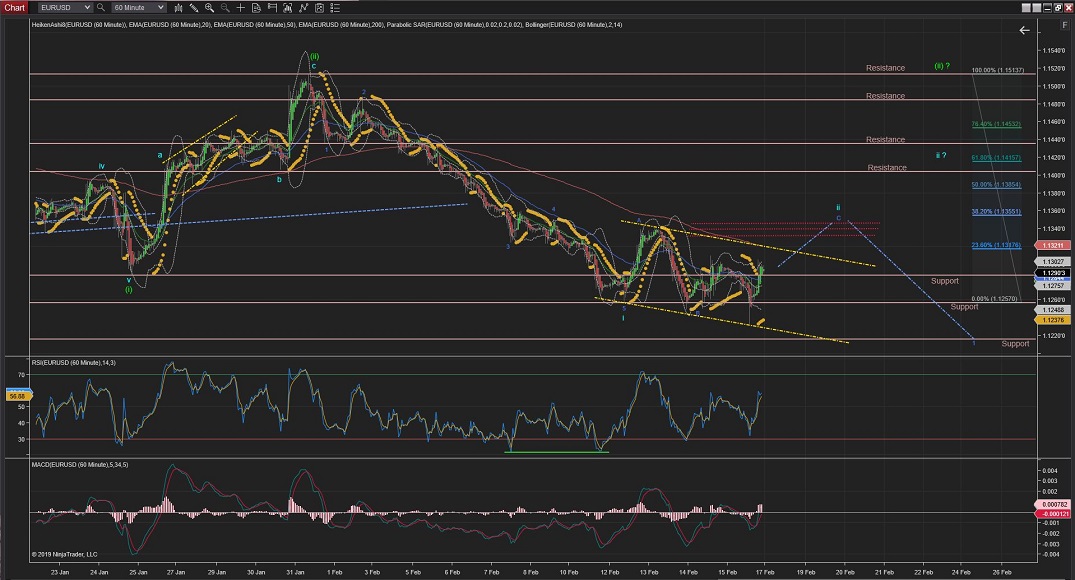
EURUSD
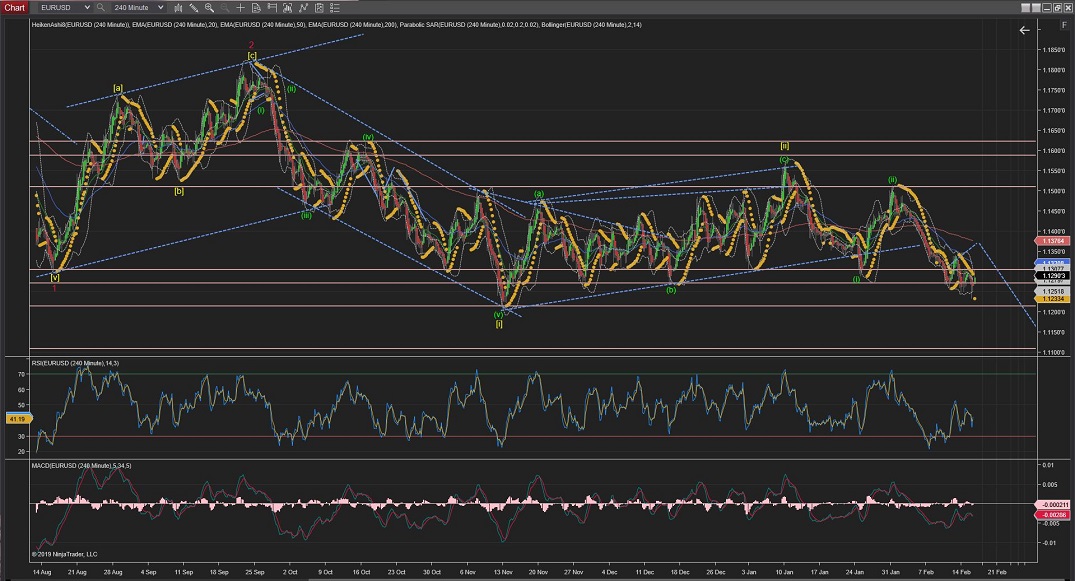
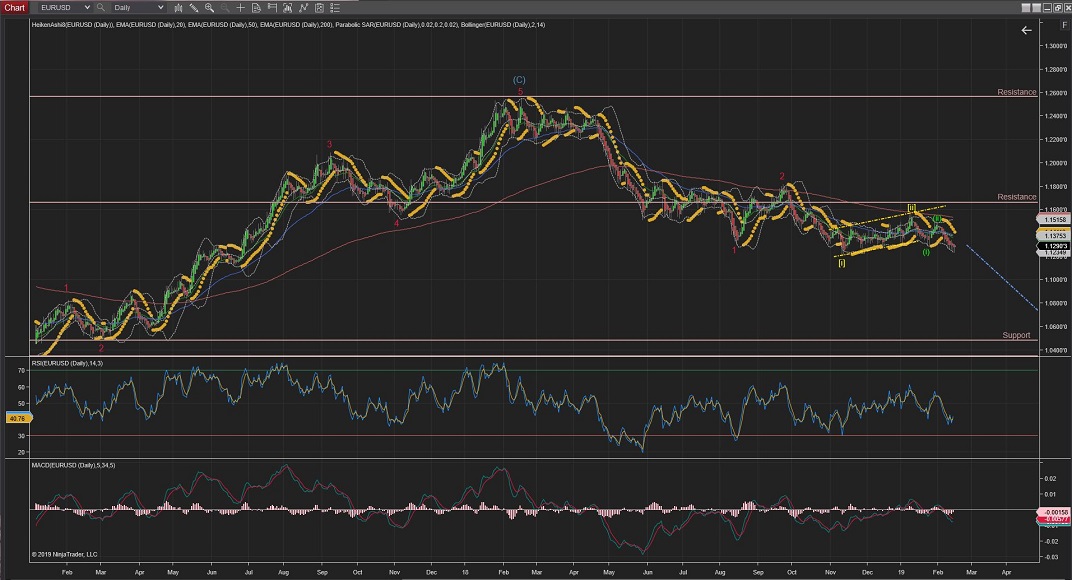
EURUSD is still going through Wave ii correction on its last Wave c up towards, possibly the %38 Fib retracement levels;
Impulsive waves down would confirm when Wave ii is complete and create an opportunity for an low-risk entry for Wave ii (of Wave (iii)) downwards.
The alternate counts catters for larger Wave ii or (ii) to raise towards resistance levels at their respective higher Fibonacci retracements.
If the price action carries on as per current count, we should expect the raise on current Wave C to complete Wave ii to be completed before the %38 Fib, as mentioned earlier, and once Wave iii is confirmed on the way we should see impulsive moves to the downside crossing resistance levels located at 1.1214 (by previous Wave [i] (green), which would confirm Wave [iii] (green) also on the way (best pictured in the 1Hour Chart).
**Changed colour layout through the charts for more clarity
60Mins
4Hours
Daily
EURCHF
EURCHF is following well the current count and it is now completed Wave iv, with a drop slightly lower from the Market Open to complete Wave v and hence, completing Wave (c) and Wave [ii] within the latest trend line formed (green).
Should the price go lower, the alternate count would trigger Wave v to go lower towards previous levels of support at the lowest of Wave (a) (1.1300 area).
**Changed colour layout through the charts for more clarity
60Mins
4Hours
Daily
EURGBP
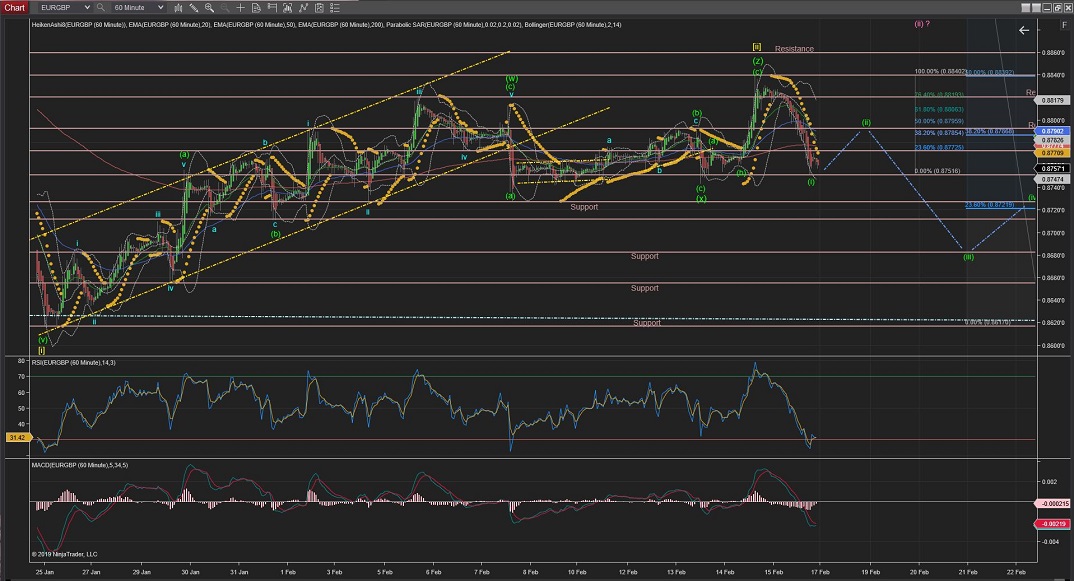
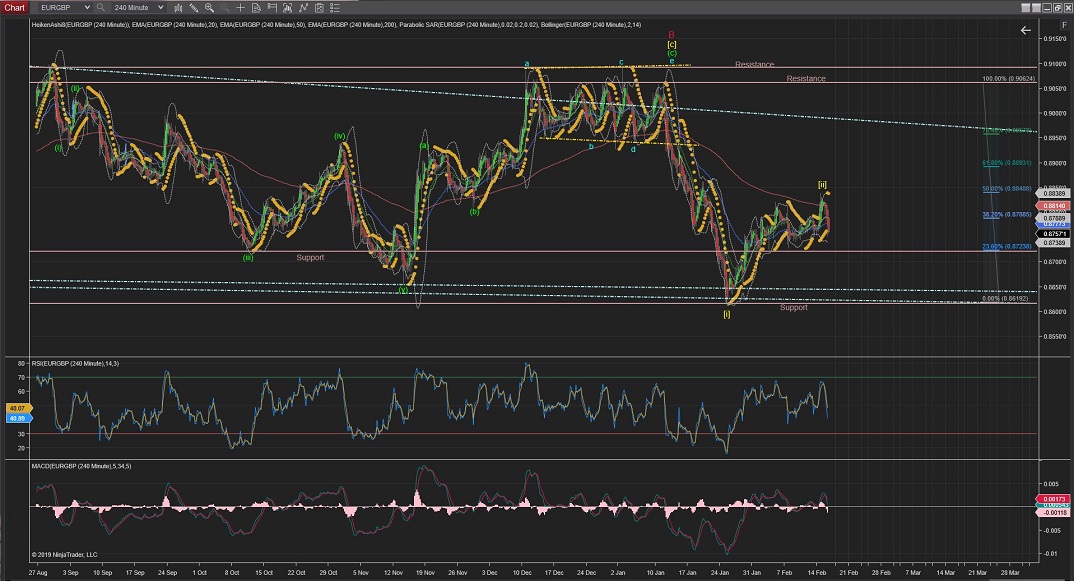
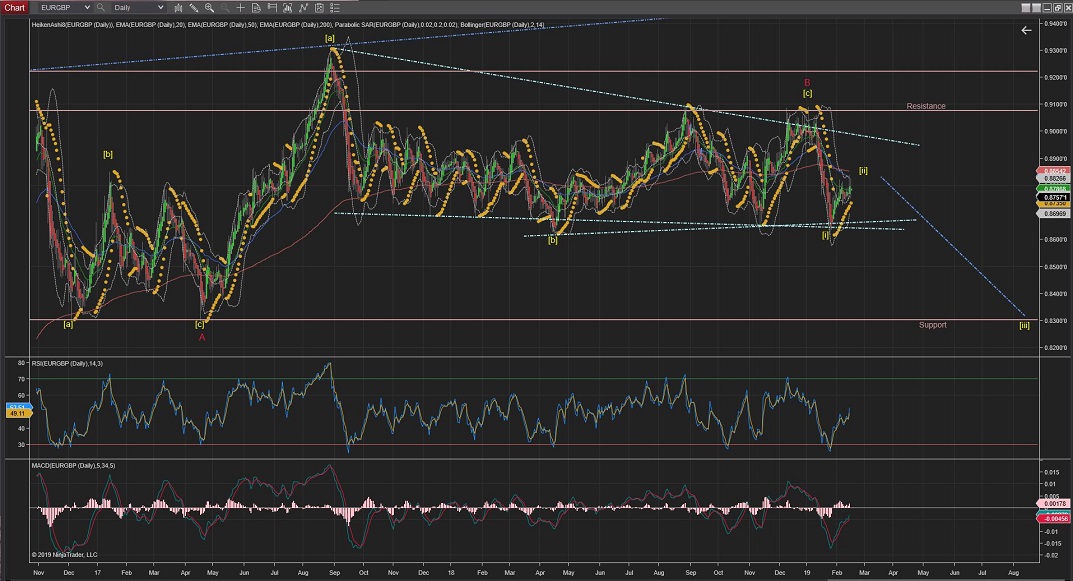
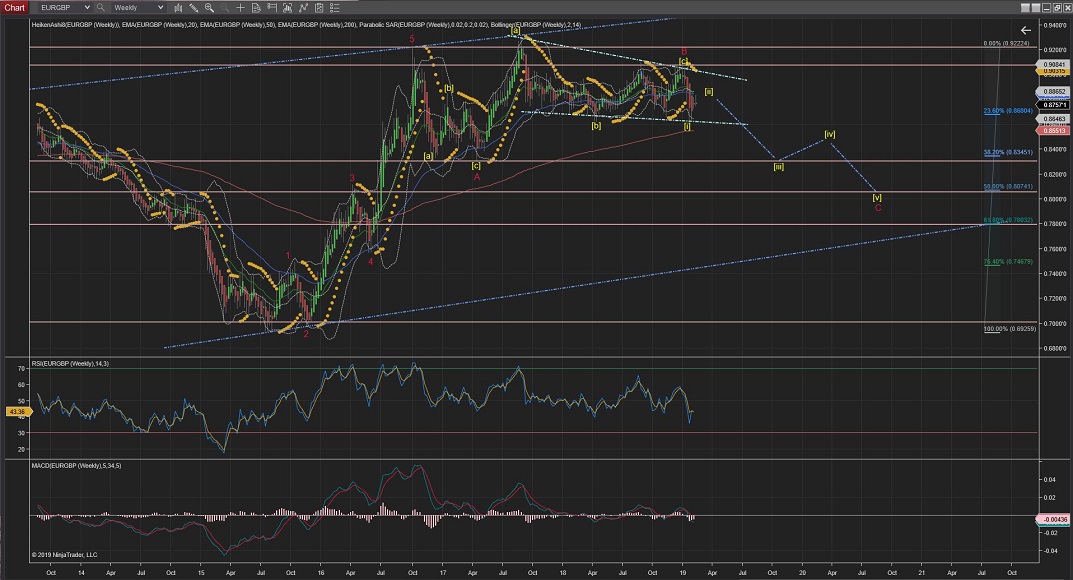
EURGBP has extended Wave (ii) to what could now be an w-x-z formation to have completed at exactly the %50 Fib Retracement of Wave (i).
There is a call for an alternate count of a larger Wave (ii) at the %62 Fib retracement (see 4Hour Chart) which will be triggered if the current Wave i is cancelled out by a higher than Wave c raise (in other words; if resistance at 0.8840 is broken).
Otherwise, as the current count stands, Wave ii should retrace higher possibly towards the %50 Fib retracement of Wave i and, from there, impulsive waves to the downside would signal the start of Wave iii of Wave (iii).
**Changed colour layout through the charts for more clarity
60Mins
4Hours
Daily
Weekly
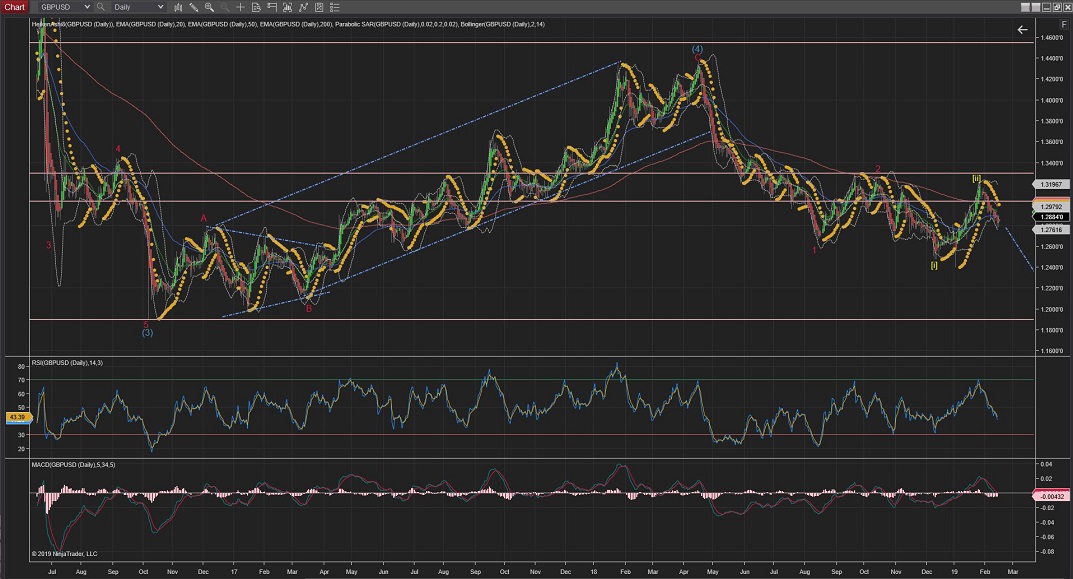
GBPUSD
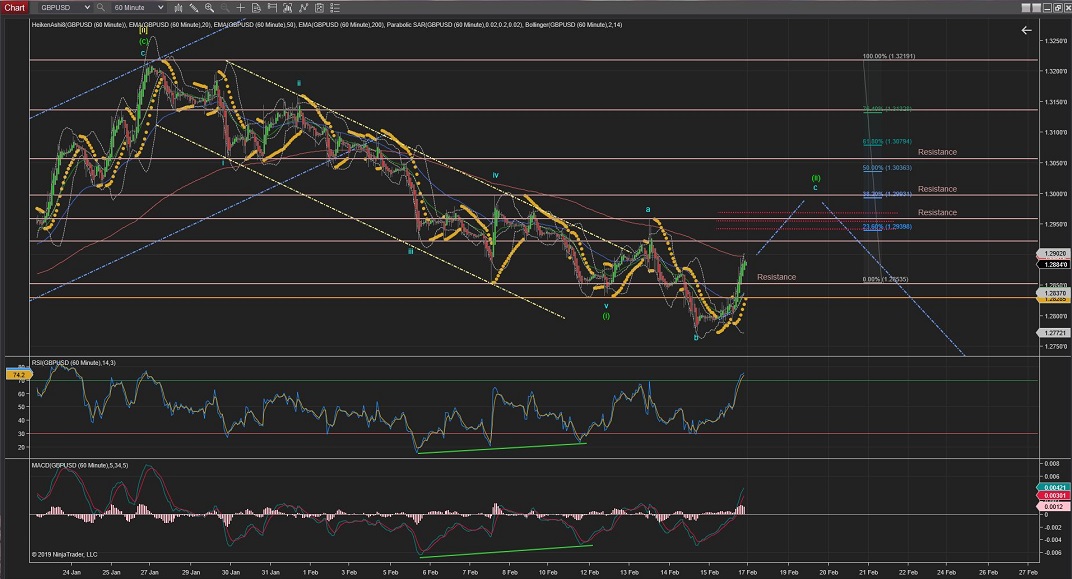
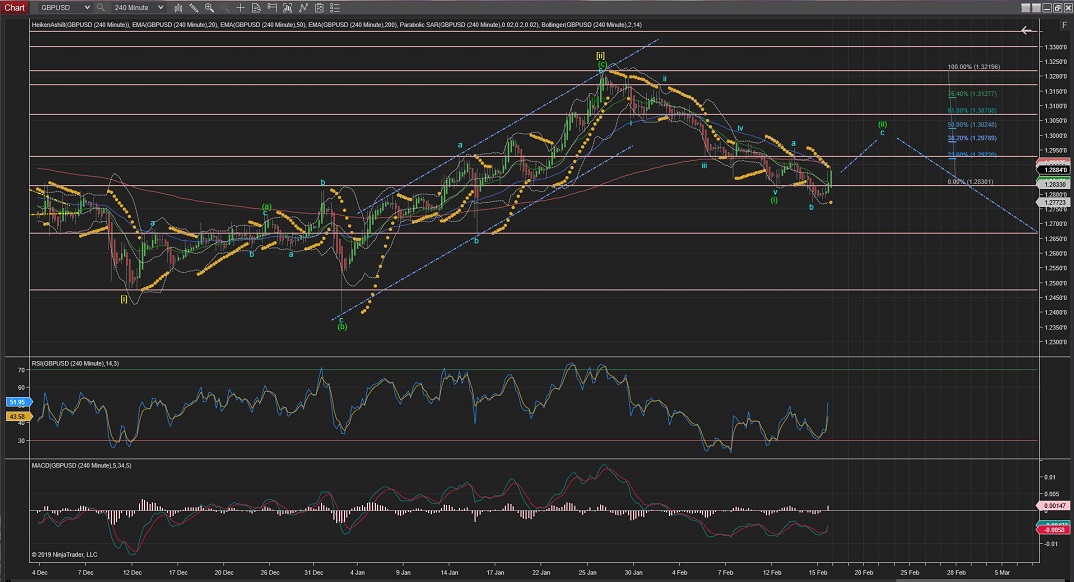
GBPUSD has shown that Wave (ii) still has more room to raise on Wave (ii) on the current Wave C towards/crossing resistance levels, possibly with a target at the %38, as per current count.
Once Wave (ii) completed, once the price continues below support levels created by previous Wave (i), we could confirm that Wave (iii) is underway and the next levels of support would be at 1.2665
Even lower, the next support formed by the previous Wave [i] would be 1.2475, which, once crossed, would confirm Wave [iii] underway. (best pictured in the 4Hour Chart)
**Changed colour layout through the charts for more clarity
60Mins
4Hours
Daily
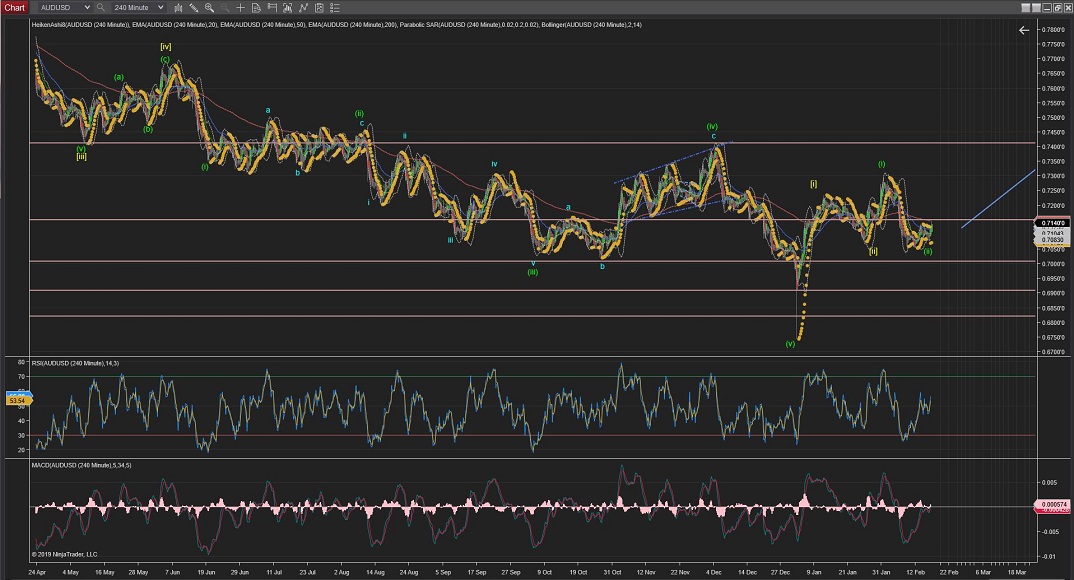
AUDUSD
AUDUSD has picked up on the way up again and crossed the highest of Wave 1 of Wave i.
The current Wave is labelled as Wave 3 of Wave i, although I would expect this Wave to carry the prices towards the next level of resistance (at 0.7236 area).
The support level (0.7057) made by previous Wave (ii) it is still holding this price for this current count to be valid.
60Mins
4Hours
Daily
Weekly
All the best for everyone.
Andres


 Trading Waves .org