Tue 12-02-2019
Hi everyone, hope you are all good.
USDJPY
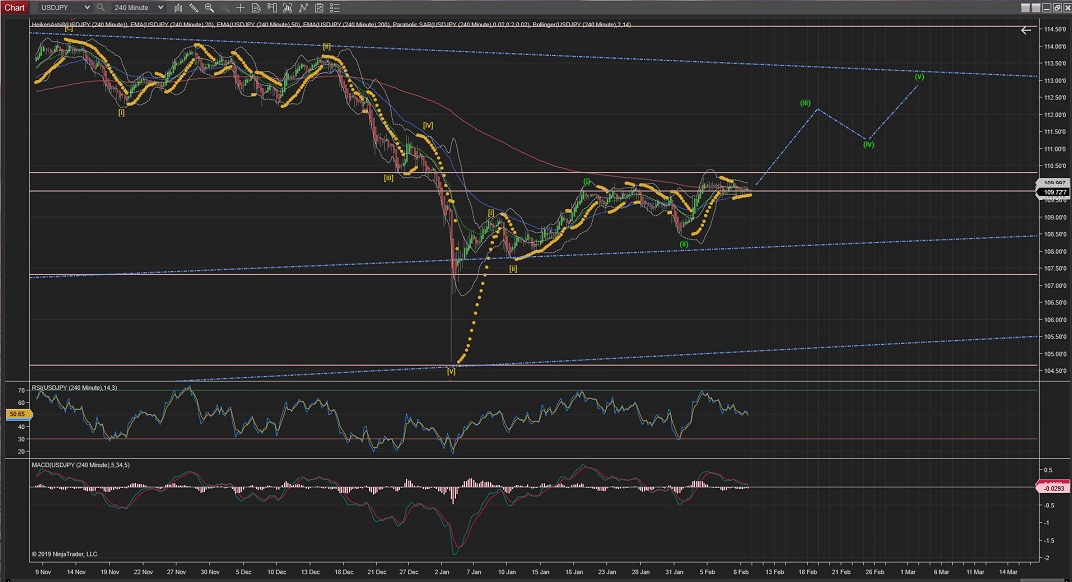
USDJPY is going through Wave 2 (blue) of Wave iii on a correction that might be finishing at the %38 or above (@110.25 area), although could come down lower but should not be lower than the highest of Wave i (@110.15), which would be the %50 Fib retracement of current Wave 1 (blue).
Once Wave 2 (blue) is completed, tomorrow we should see further impulsive moves in Wave 3 towards resistance at the 110.40 area.
60Mins
4Hours
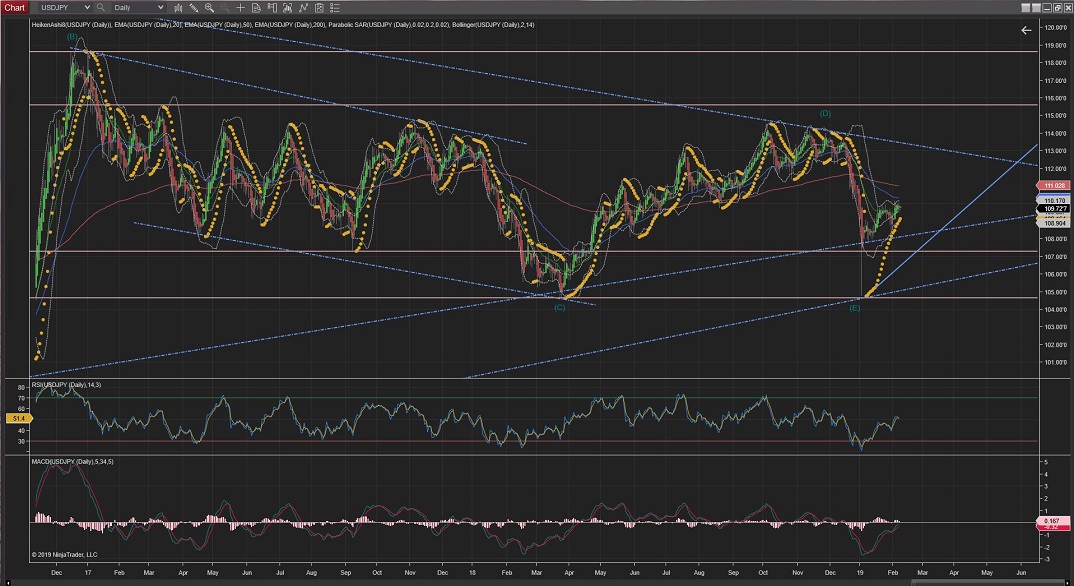
Daily
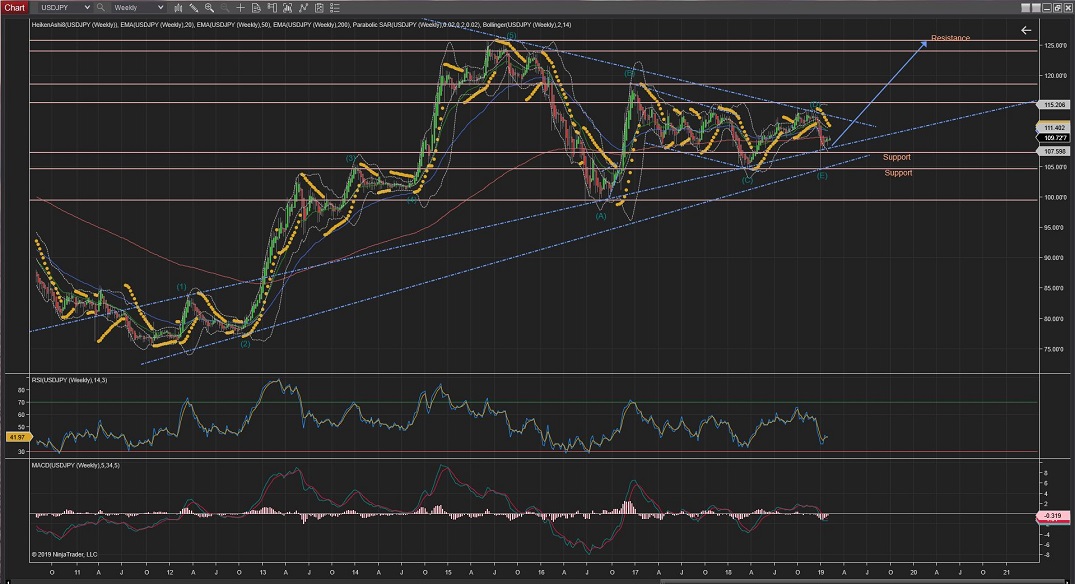
Weekly
USDCAD
USDCAD should not be long before Wave c finishes to complete Wave iv and Wave v starts to raise higher again towards resistance levels.
If the price turns at the current support level (1.3230) it would form a double bottom with previous Wave A (blue).
If it does break the current support it would suggest to go to the next level of support at 1.3202.
In any case Wave v should start raising very soon and tomorrow should start showing the impulsive waves up.
60Mins
4Hours
Daily
USDCHF
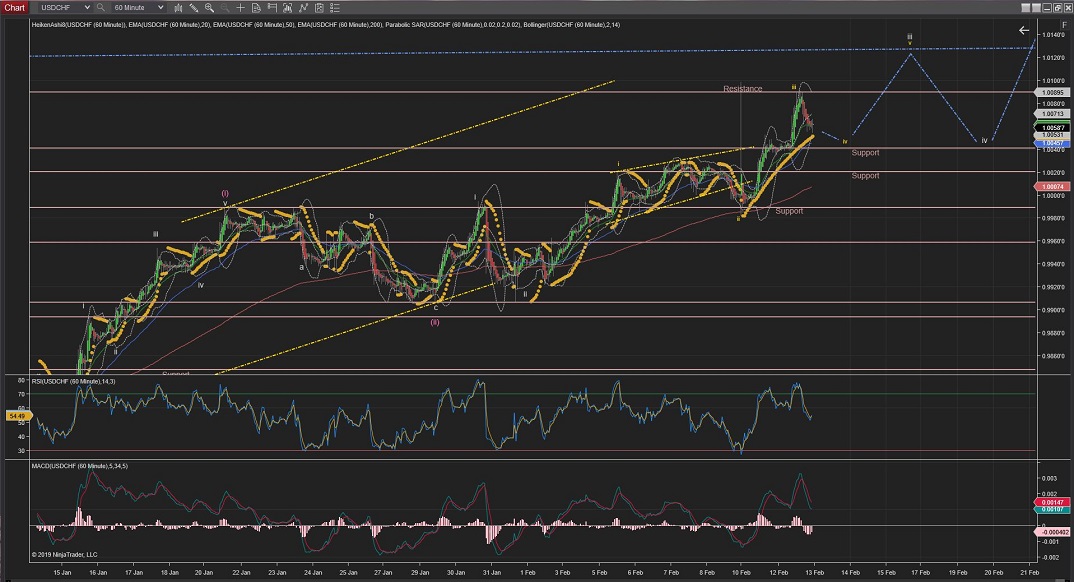
USDCHF is following the Waves neatly and it is now going through Wave iv (yellow) of Wave iii (white).
The highest of Wave i (yellow) at 1.0020 should not be crossed, although the lowest of the current Wave iv (yellow) should hold very well the price within the nearest support at 1.0040.
Once this wave is completed, we should see a raise towards the long-term upper trend to complete Wave iii (white) and a bounce lower to start Wave iv correction.
60Mins
4Hours
Daily
EURUSD
EURUSD completed Wave i and it is going now through Wave ii correction, although there is not clear indication as to the type of correction that is underway.
We should see tomorrow Wave ii developing and, once completed (probably between the Resistance levels at the %50 and/or %62 Fib levels), Wave iii will start making the impulsive moves down again.
60Mins
4Hours
Daily
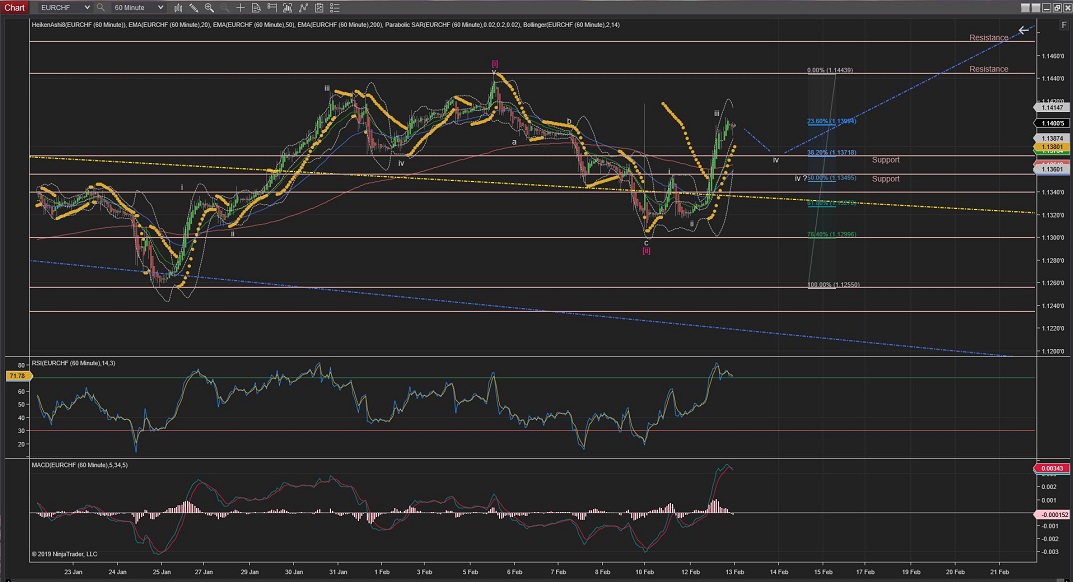
EURCHF
EURCHF is now completing Wave iii up and Wave iv correction has two levels of support which should hold; the first at 1.1372 and the next level of support at 1.1355 which should not be crossed for this count to remain valid.
Once Wave iv is completed we should start seeing the impulsive moves up with Wave v towards resistance levels.
60Mins
4Hours
Daily
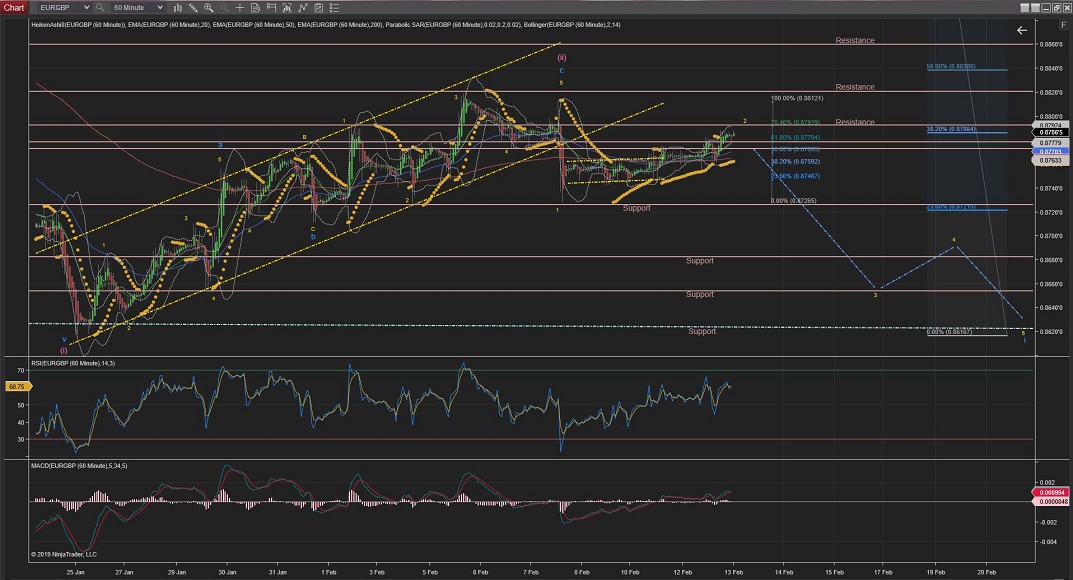
EURGBP
EURGBP has not shown much price action since yesterday and it is still stuck on Wave 2 (yellow) which could should be ending soon at the %76 fib retracement level.
Once Wave 2 is completed Wave 3 should show impulsive moves to the down side crossing the initial Support levels towards the lower long-term trend line.
60Mins
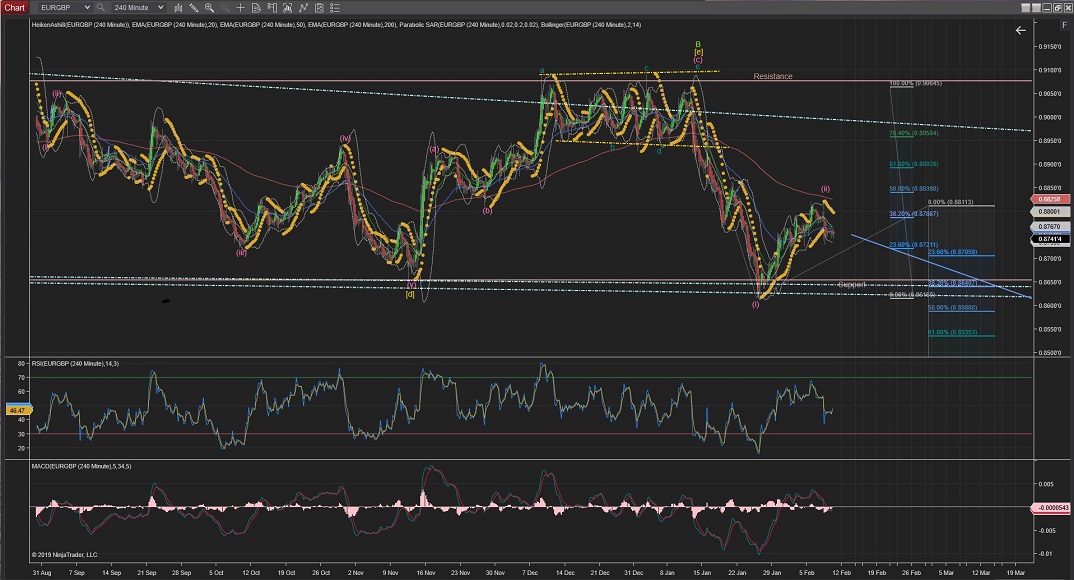
4Hours
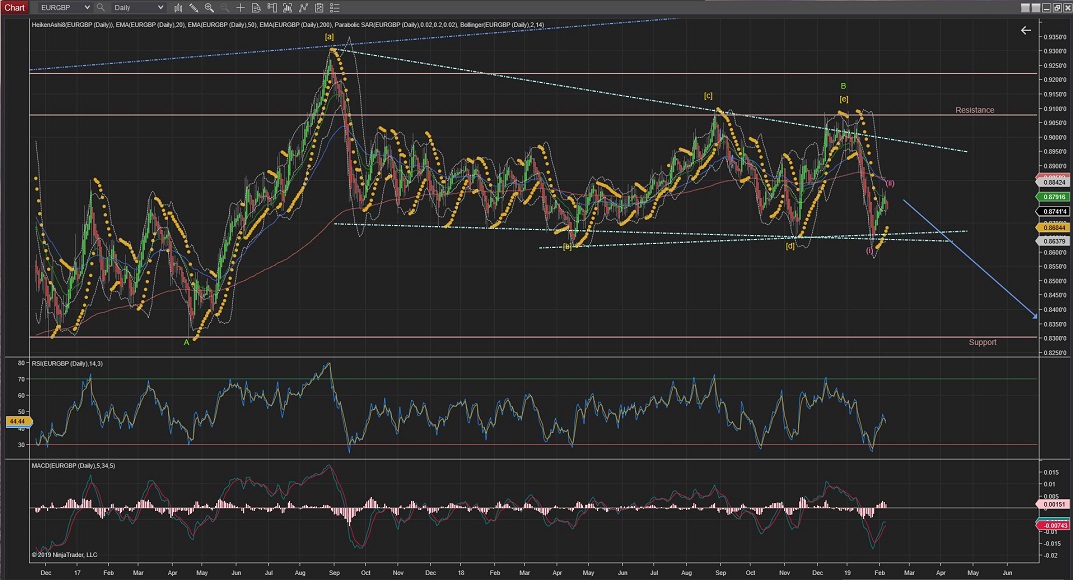
Daily
Weekly
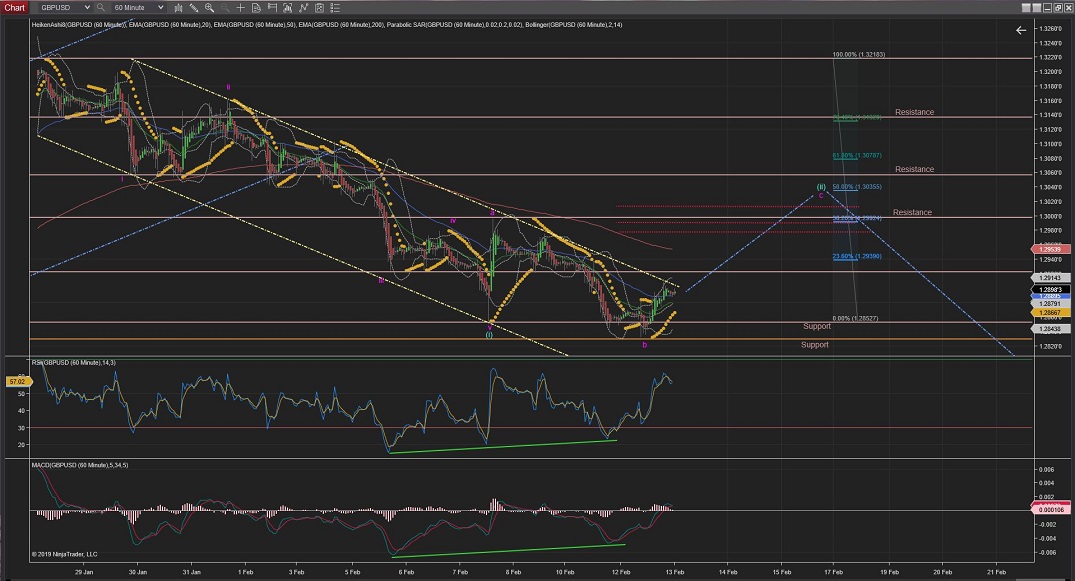
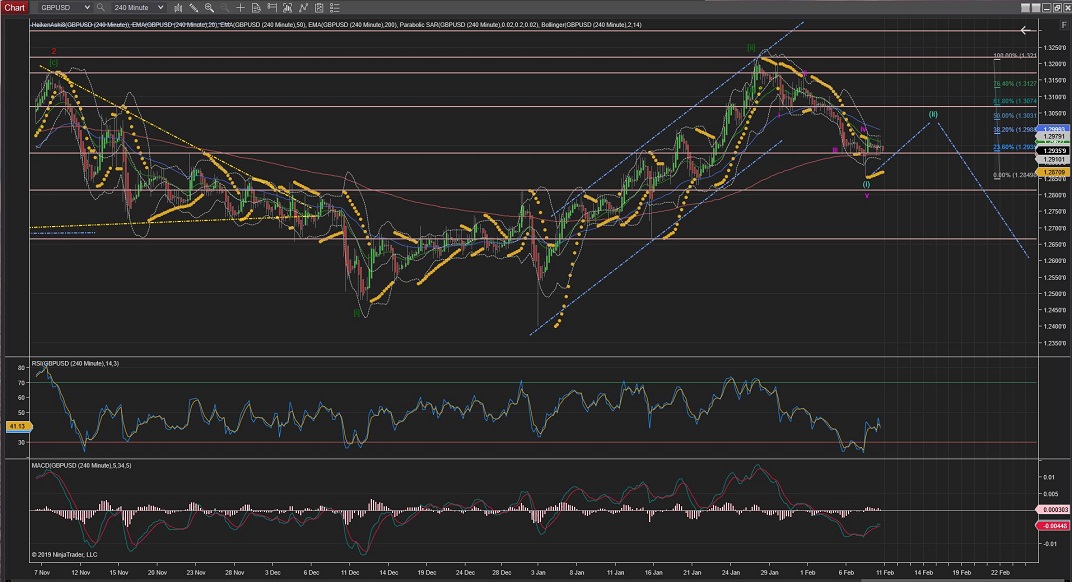
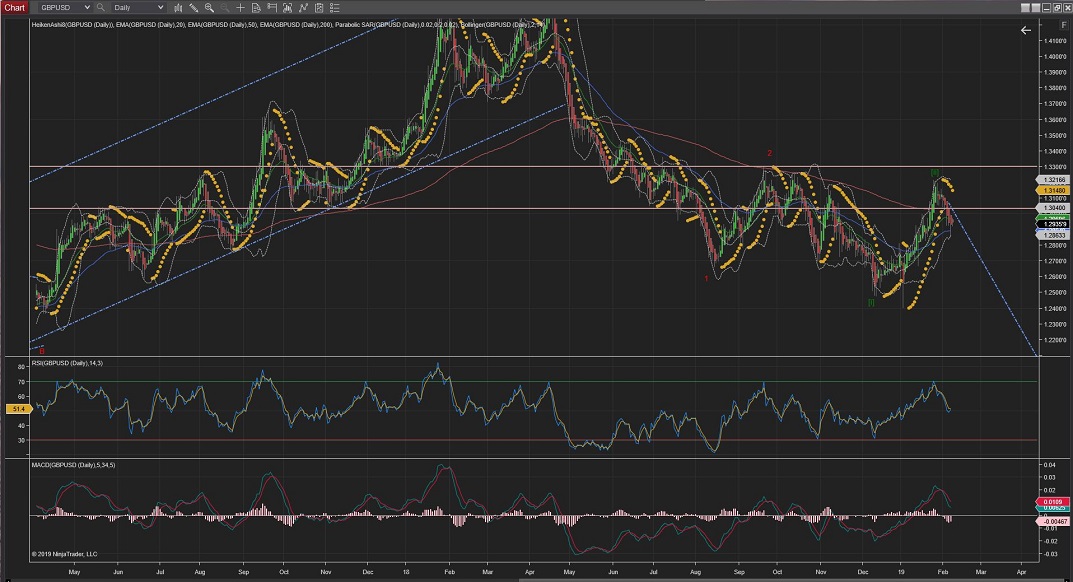
GBPUSD
GBPUSD is going through Wave (ii) in a Flat (3,3,5) pattern where Wave b is completed and Wave c is underway; so we should see 5 waves up to complete Wave (ii) around the %38 or %50 Fib retracement levels.
(The divergence shown by the RSI proved to be a good indicator for the raise).
Once Wave (ii) is completed, Wave (iii) of Wave [iii] should start impulsive moves downwards.
60Mins
4Hours
Daily
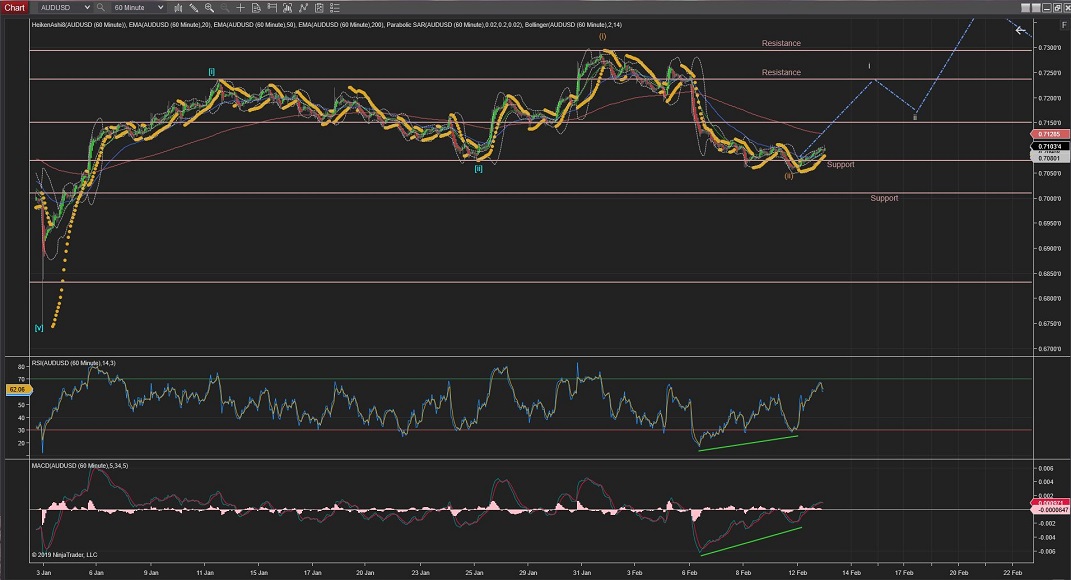
AUDUSD
AUDUSD today has been raising slowly from the support area and, although there has not been impulsive waves, it could be the start of Wave (iii) upwards.
I would like to see more movement upwards and/or impulsive moves before I am convinced of the idea of Wave (iii) up. And Wave (iii) would not be confirmed until the highest of Wave (i) is crossed.
60Mins
4Hours
Daily
Weekly
All the best for everyone.
Andres


 Trading Waves .org