Wed 06-02-2019
Hi everyone, hope you are all good.
USDJPY
USDJPY looks to have started Wave iii up already, with Wave ii completing at the %38 Fib retracement level.
This count would be confirmed once the prices crosses the highest of Wave i @110.13.
In the meantime, the alternative count for Wave ii aiming lower towards the %38 or %50 remains a possibility although unlikely as the RSI and MACD indicators are shouting to go higher and the ParabSar Indicator on the 4Hour Chart is about to turn on the bullish sign.
60Mins
4Hours
Daily
Weekly
USDCAD
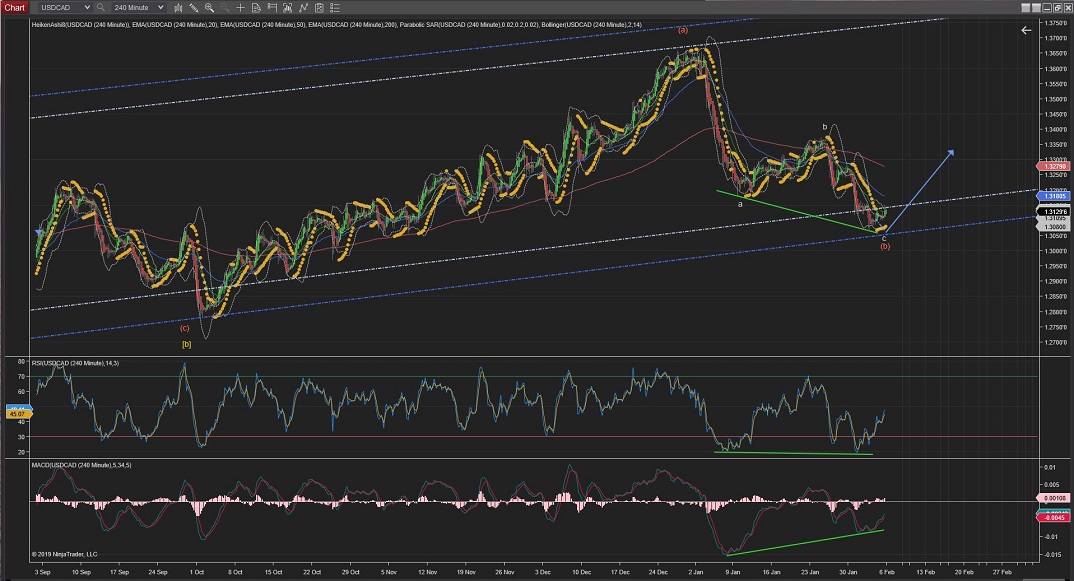
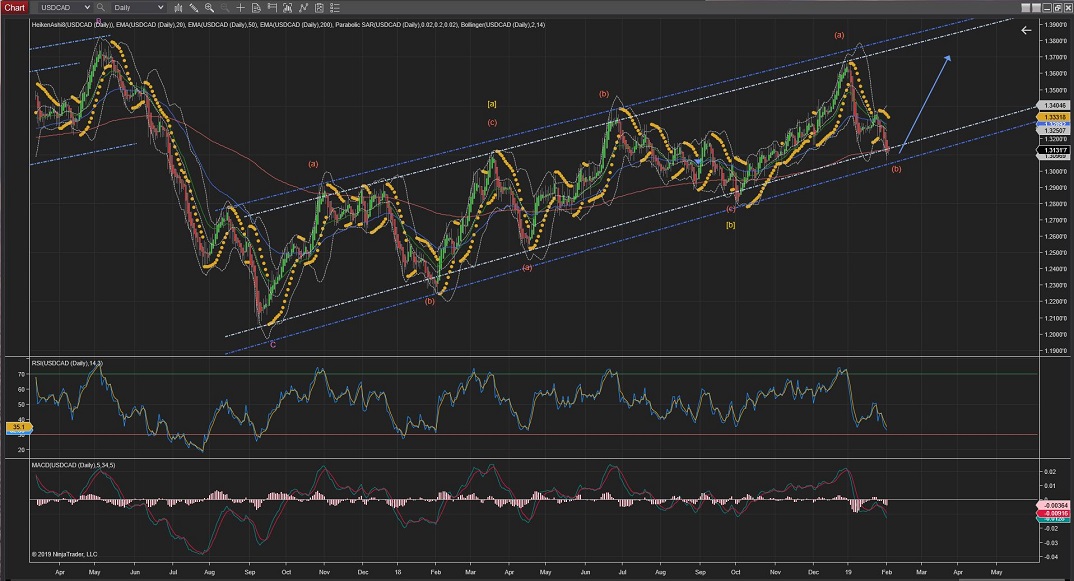
USDCAD finally made the move up, although failed to touch the lower trend and it might have now completed Wave iii of Wave (i).
Tomorrow Wave iv correction might try to touch previous level of Support which would be around the 200EMA area and should hold well
And from then we could expect another impulsive move for Wave v towards the next levels of Resistance at around the 1.3285 area
60Mins
4Hours
Daily
USDCHF
USDCHF crossed slowly the resistance levels and might have started Wave iii (yellow), although there is a posibility that Wave ii (yellow) can test the lower side of the small trend formed before the price continues upwards.
60Mins
4Hours
Daily
EURUSD
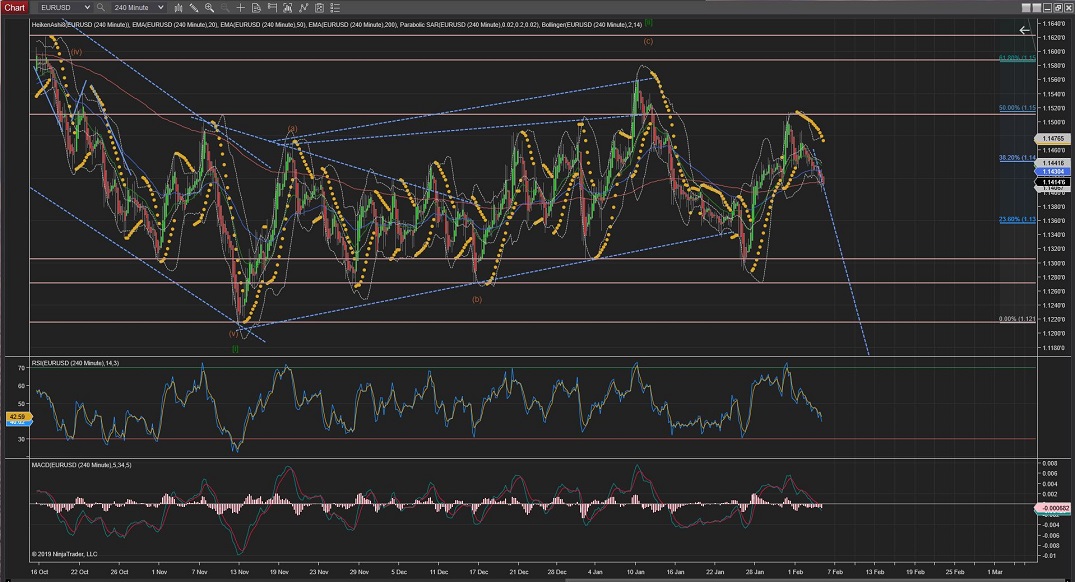
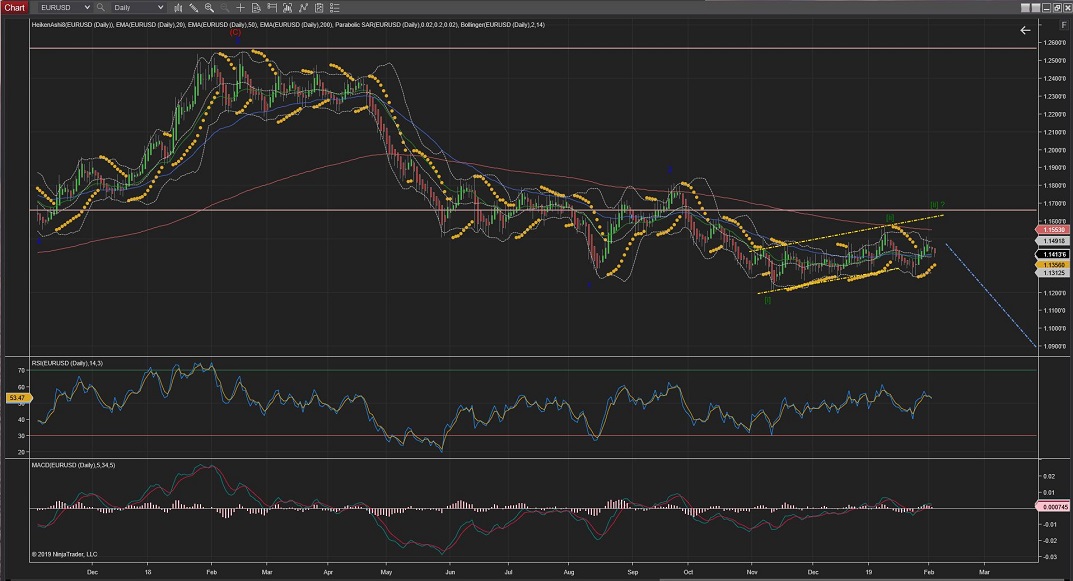
EURUSD broke the previous long-term trend-line levels in Wave iii and I should expect a small Wave iv correction now towards Resistance levels between 1.1403 and 1.1435 before Wave v continues lower.
(resistance levels created by Wave i @1.1435 should hold well)
60Mins
4Hours
Daily
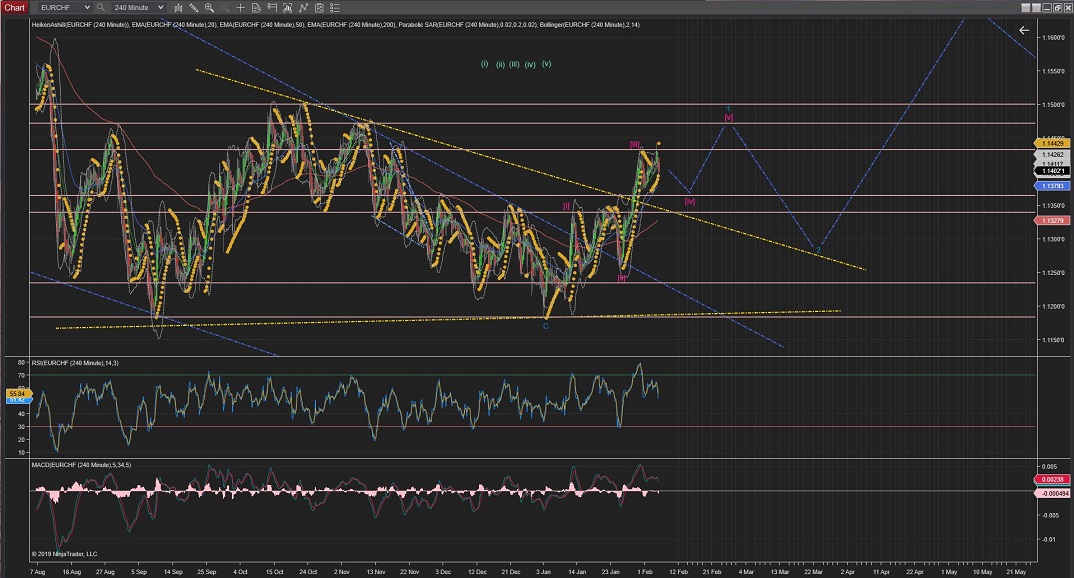
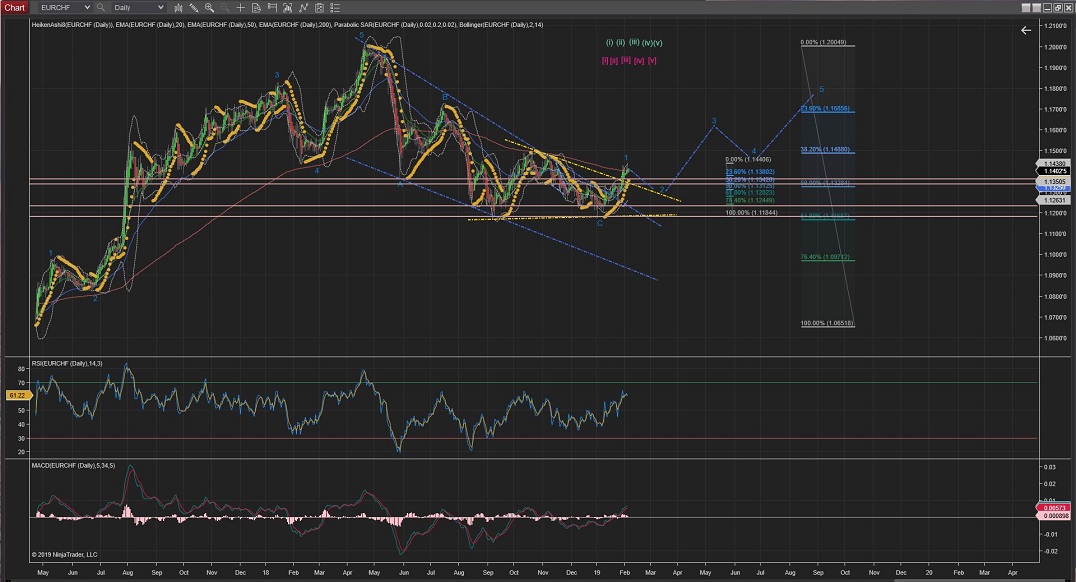
EURCHF
EURCHF has made 5 clear waves within Wave [iii] and, with Wave [iv] correction now on the way down it is now completing Wave a.
Tomorrow I would expect Wave b to raise higher and, once completed Wave c should complete Wave [iv] between the Support levels of 1.1371 and 1.1340
60Mins
4Hours
Daily
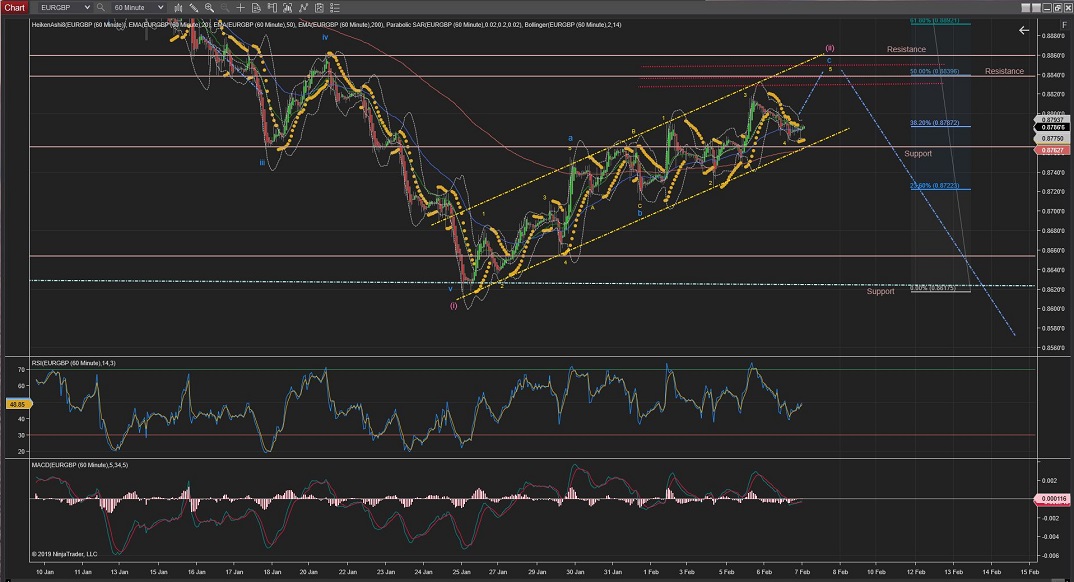
EURGBP
EURGBP is nearly completing a very well defined ZigZag Correction (5,3,5) for Wave (ii); by completing Wave 4 (yellow) and now starting Wave 5 of Wave c (blue).
Once Wave (ii) is completed, probably around the %50 Fib area (and previous Wave iv highest) Wave (iii) should start the impulsive moves to the downside again.
60Mins
4Hours
Daily
Weekly
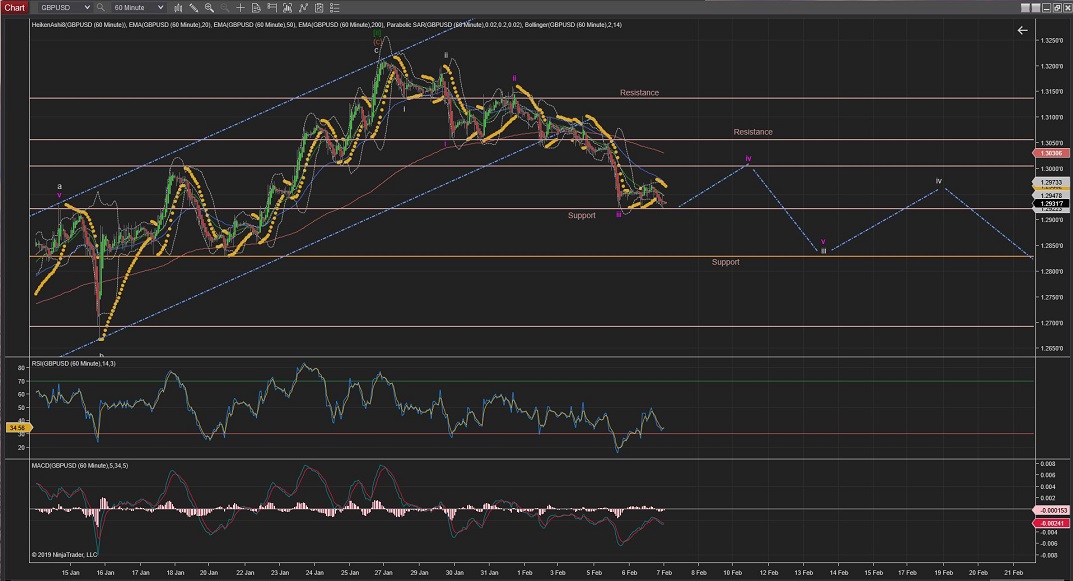
GBPUSD
GBPUSD Wave iii stopped today at Support created by previous Wave v and Wave iv is now underway towards levels of resistance between 1.3005 and 1.3055 before moving lower again on Wave v to complete the higher degree Wave iii (white) at the next level of support (1.2828)
60Mins
4Hours
Daily
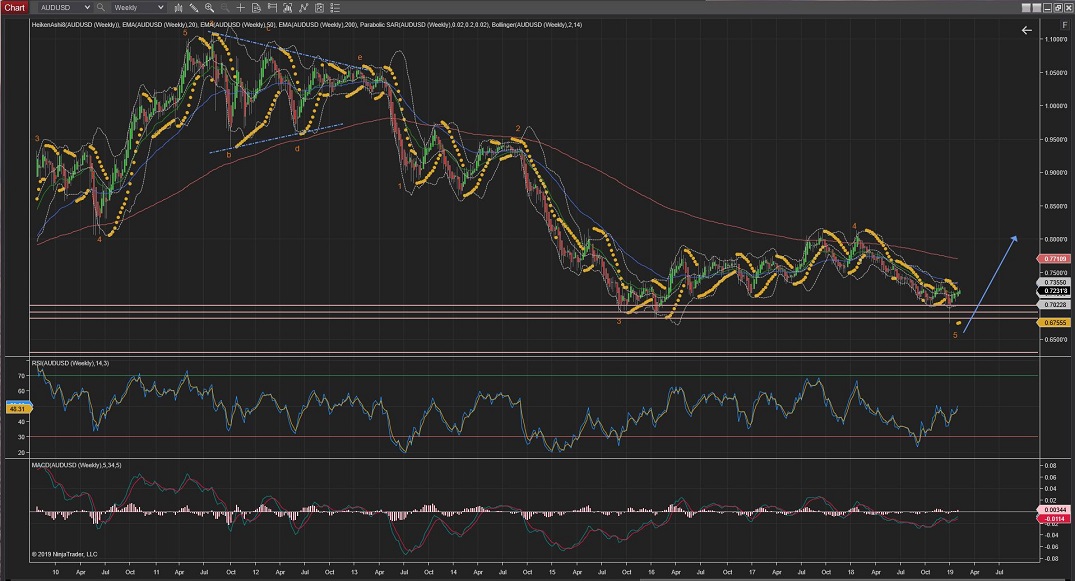
AUDUSD
AUDUSD made a sudden move lower today which made me change the count for a greater Wave 1 Wave 2 underway, although if the previous Wave [ii] low is crossed would make me reconsider the whole count.
As it stands I would expect the price to start raising to start Wave (iii) from this point and 0.7076 resistance to hold the price.
60Mins
4Hours
Daily
Weekly
All the best for everyone.
Andres


 Trading Waves .org