Tue 05-02-2019
Hi everyone, hope you all good.
I have removed some of the indicators which didn't add much value to the charts (Stochastics, HMA15, HMA33) and I think the charts are now more neat, clear and visible.
USDJPY
USDJPY has slowly moved sideways through the highest of Wave (i) resistance area but it is yet to move lower towards the %50 or %62 Fib retracement area to complete Wave ii correction.
Once Wave ii correction is out of the way, we should see Wave iii with impulsive moves breaking through the levels of resistance, probably towards the 111.40 area.
60Mins
4Hours
Daily
Weekly
USDCAD
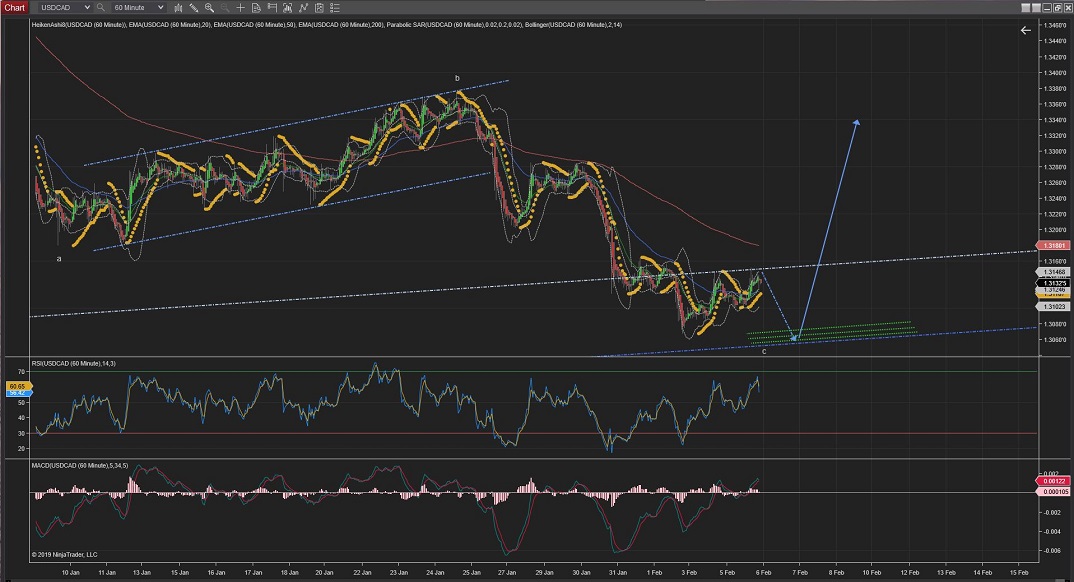
USDCAD is holding at the levels of resistance made by the previous trend and it has not offered much price action.
I fit does the final move to touch the lower trendlline it would form a Head and Shoulder formation that would strongly suggest the awaited impulsive move up.
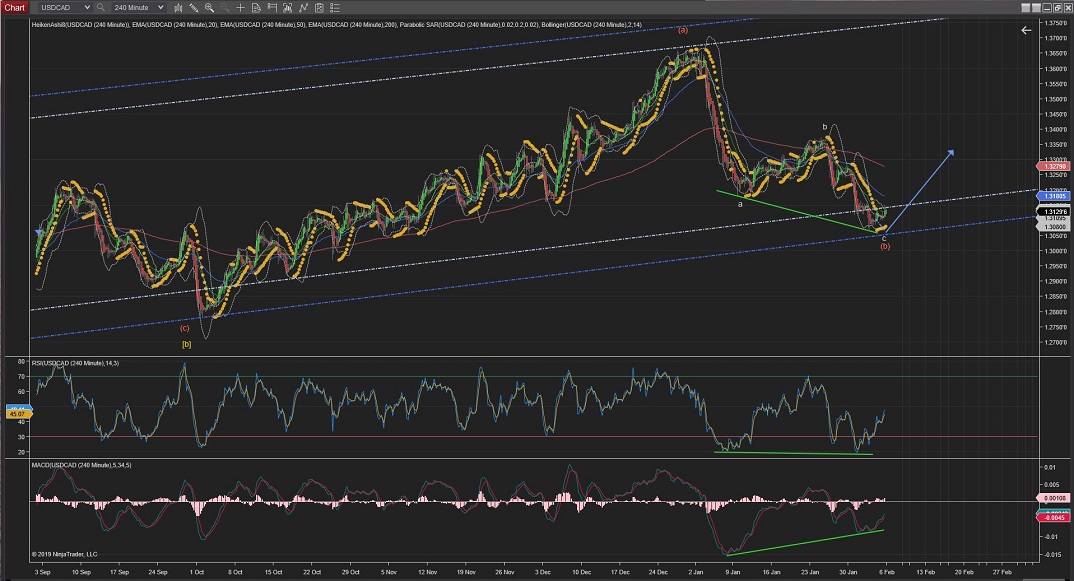
The 4Hour Chart also the price action is showing a very bullish convergence signal with the RSI and MACD indicators.
60Mins
4Hours
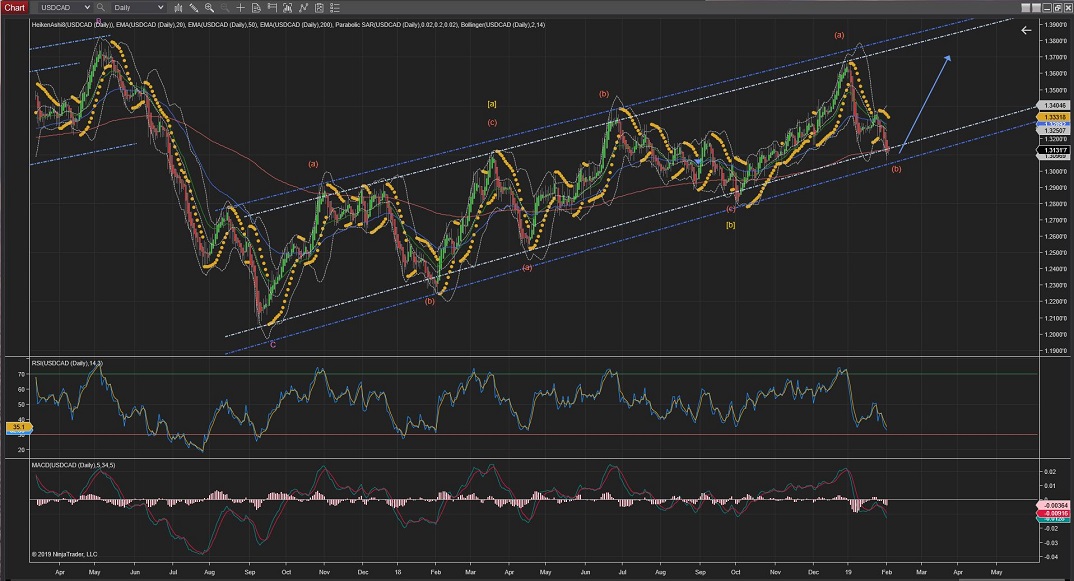
Daily
USDCHF
USDCHF failed to move impulsively towards the upper trend to complete Wave iii as expected and instead is holding at the first Resistance levels.
This could mean that it is creating a further Wave i and Wave ii (pictured in yellow) for the expected Wave iii.
60Mins
4Hours
Daily
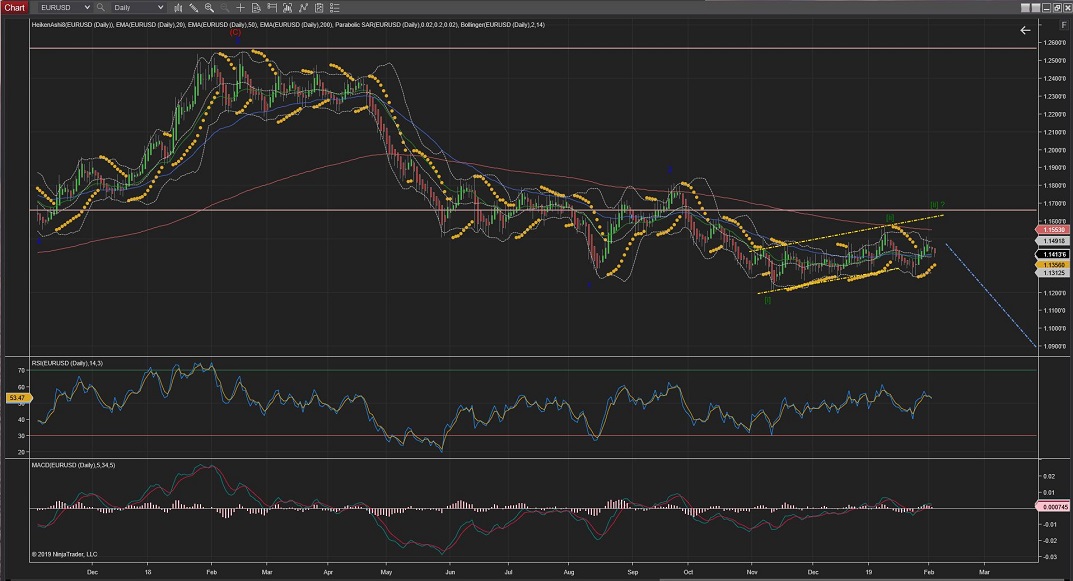
EURUSD
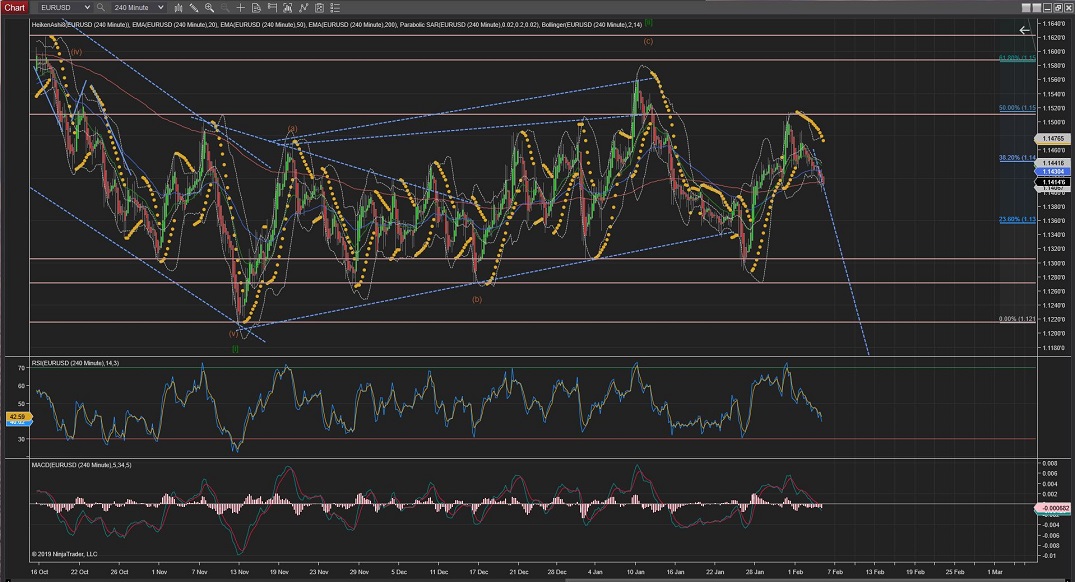
EURUSD has confirmed that Wave iii (white) of Wave i (pink) is underway and expected to reach the previous lower trend area, even though it is not showing very impulsive moves at the moment.
Once Wave iii (white) is complete we can expect a corrective Wave iv, although resistance levels created by Wave i @1.1435 should hold well.
60Mins
4Hours
Daily
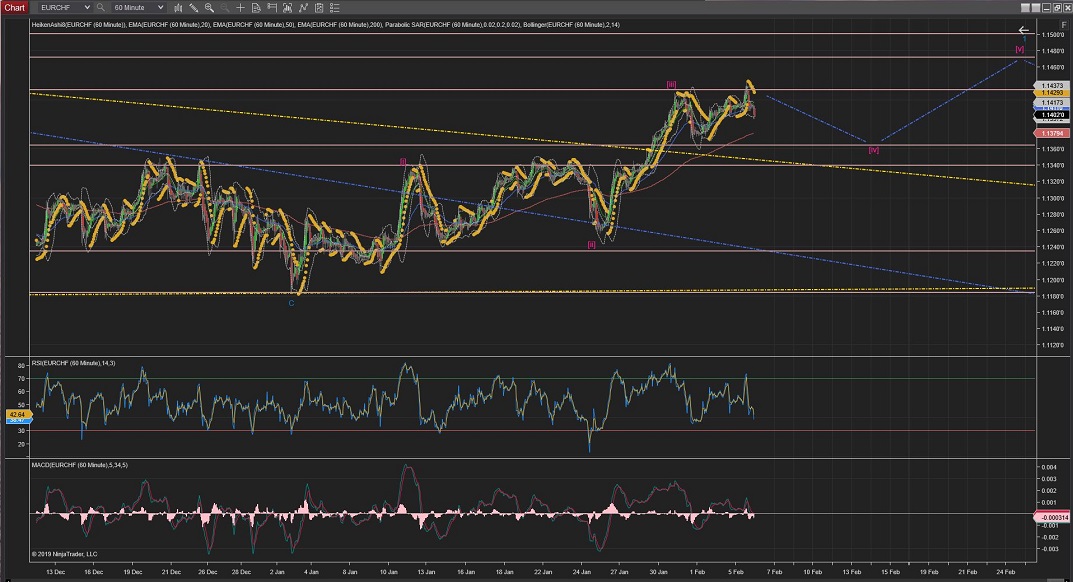
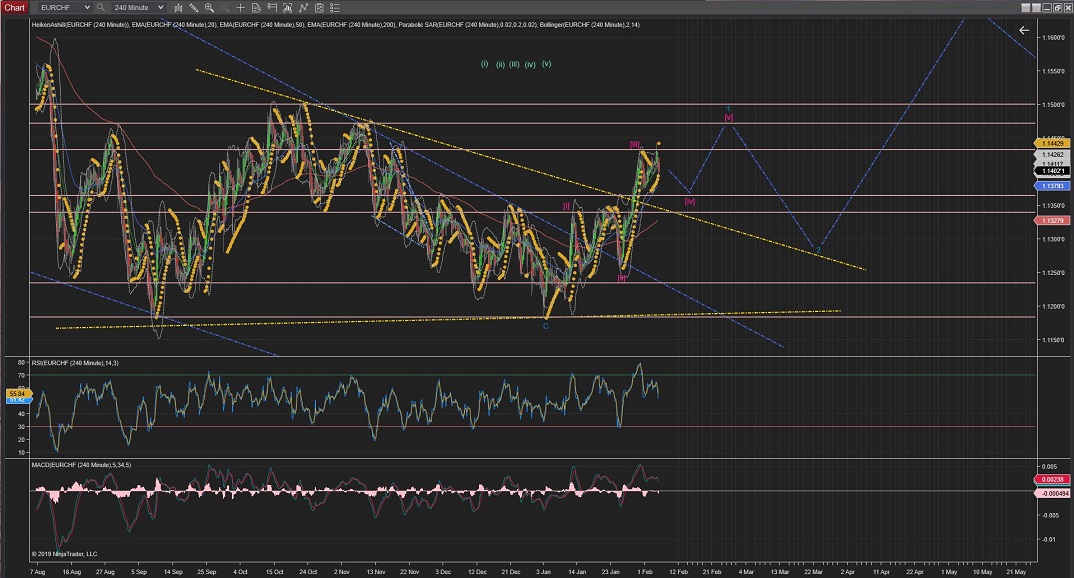
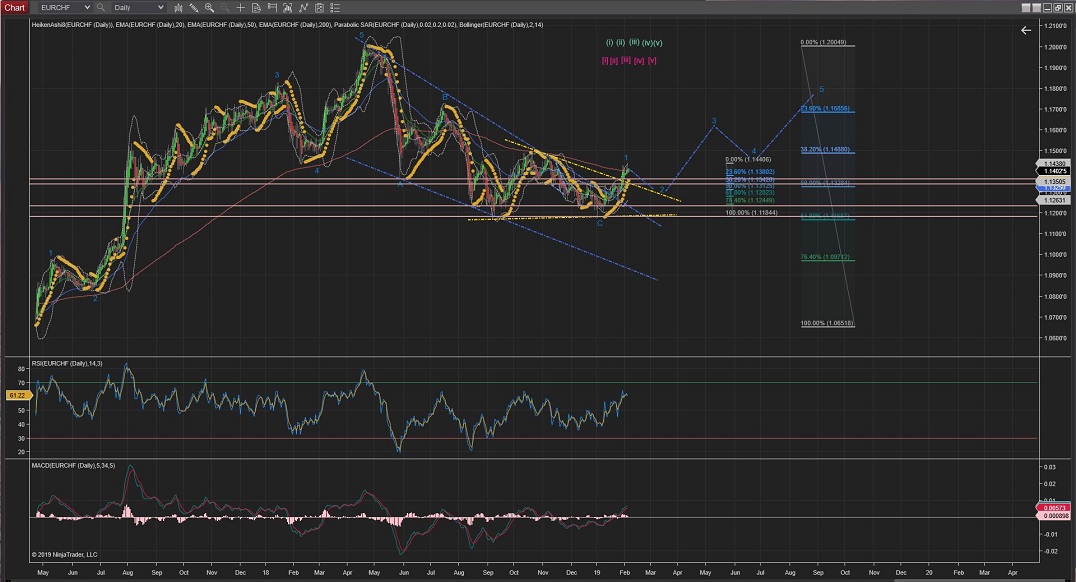
EURCHF
EURCHF is been hard to track for me, especially on the Hourly Chart.
I have switched to an alternative count on the longer charts and the best count for the hourly chart that I could made sense of right now is showing as Wave [iii] now finished and Wave [iv] just started, which should be completed above the highest of Wave [i] for this count to be valid.
Once this Wave [iv] completes I would be expecting the impulsive moves up to carry on to complete Wave [v] at least at the 1.1472 Resistance area.
60Mins
4Hours
Daily
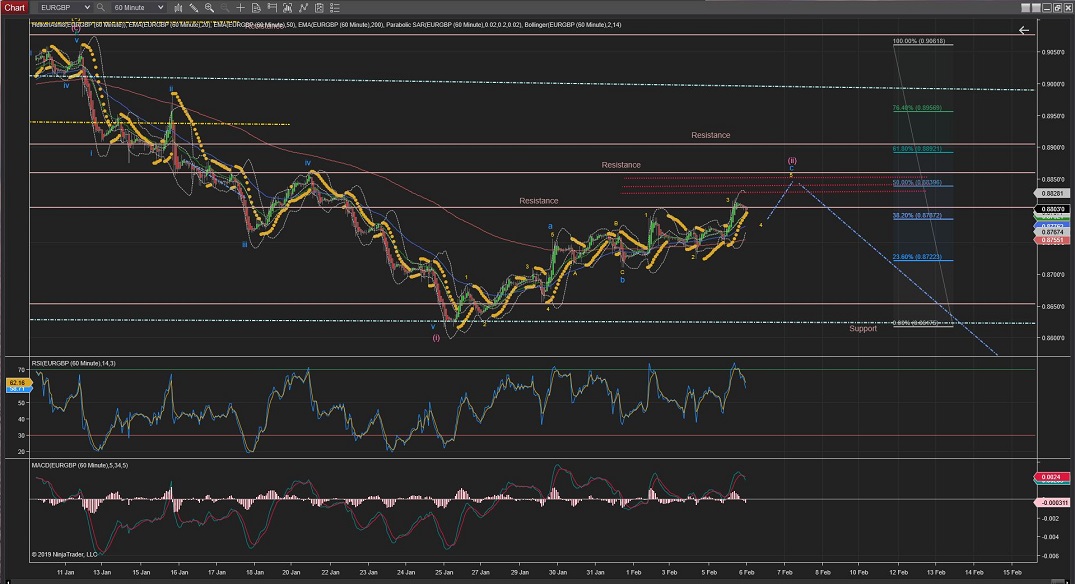
EURGBP
EURGBP is nearly completing a very well defined ZigZag Correction (5,3,5) for Wave (ii); by going through Wave 4 (yellow) of Wave c (blue).
Once Wave (ii) is completed, probably around the %50 Fib area (and previous Wave iv highest) Wave (iii) should start the impulsive moves to the downside again.
60Mins
4Hours
Daily
Weekly
GBPUSD
GBPUSD has taken Waver iii to Support created by previous Wave v highest and it is now starting Wave iv correction.
Resistance created by the previous Wave i (white) (@1.3055) should hold the price from going up and once Wave iv (white) is completed we should see the price fall lower again towards the next level of support @1.2829 to complete Wave iii (white)
60Mins
4Hours
Daily
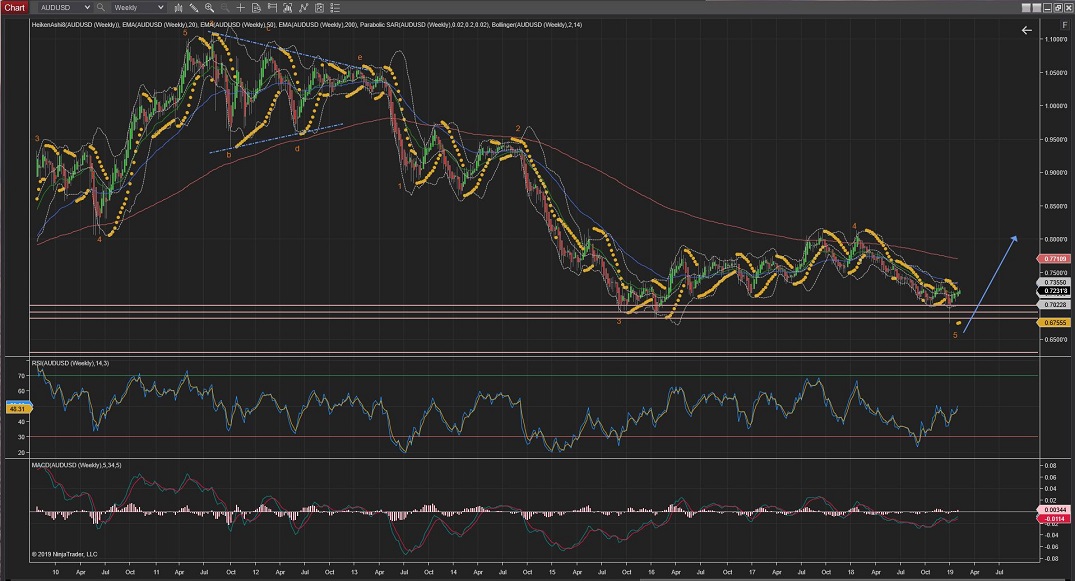
AUDUSD
AUDUSD previously labelled Wave iv went slightly into Wave i territory which invalidated the count and I have updated that for a further Wave i and Wave ii of a greater Wave (iii).
Wave iii is now underway and we should expect the price to aim to the next level of Resistance @0.7393.
60Mins
4Hours
Daily
Weekly
All the best for everyone.
Andres


 Trading Waves .org