Thu 24-01-2019
USDJPY
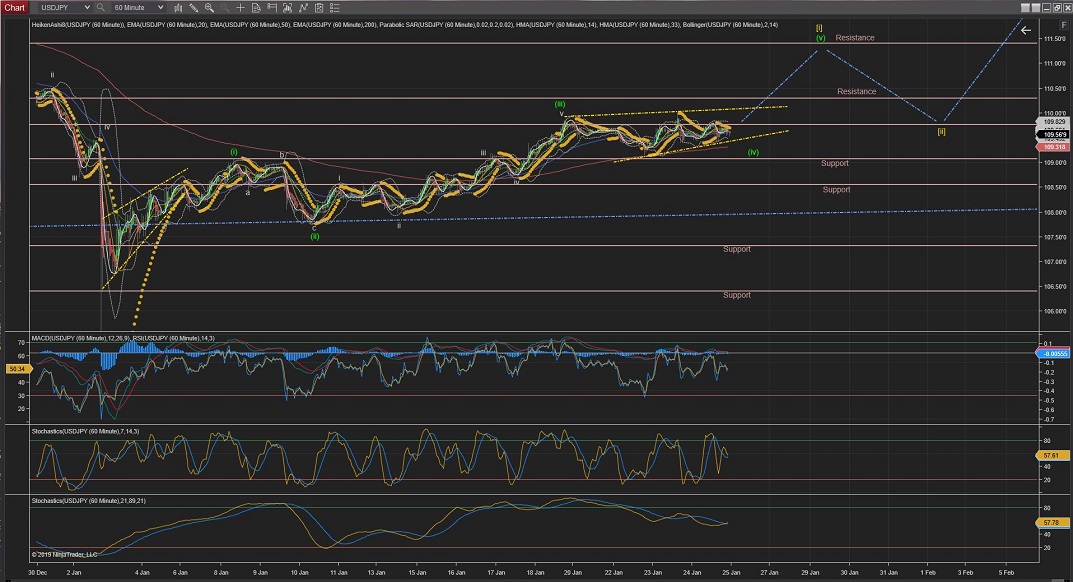
USDJPY seem to have finished Wave v of Wave (iii) with a Wave (iv) correction underway now, and there are two main levels of Resistance where this Wave [i] might end (pictured).
Once Wave [i] is completed we can expect a correction for Wave [ii].
60Mins
4Hours
Daily
Weekly
USDCAD
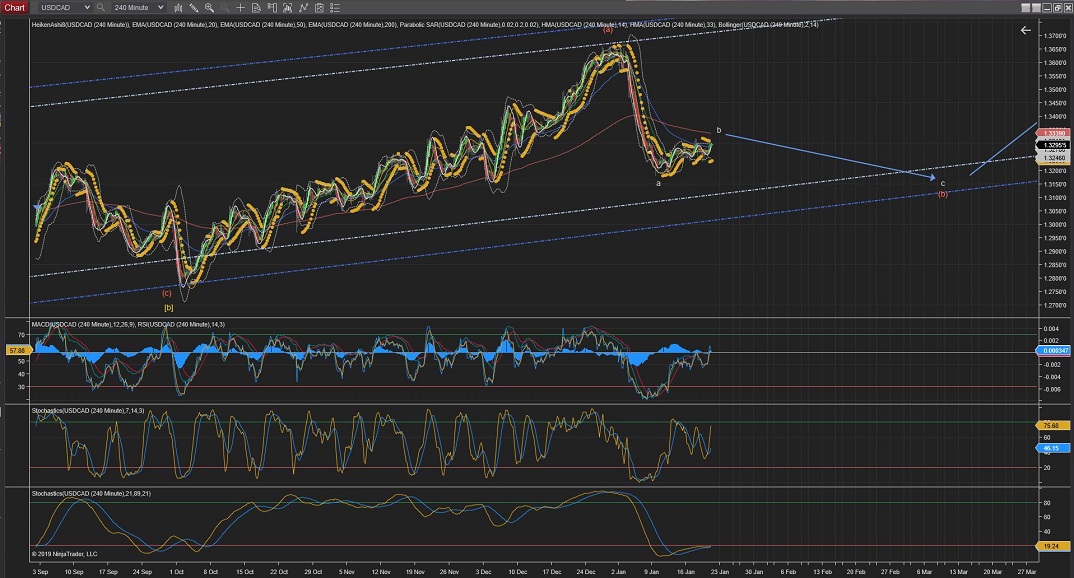
USDCAD; price still within the small trend created in Wave b and holding on sideways within the levels.
Still waiting for the move to the lower long-term lower trend...
60Mins
4Hours
Daily
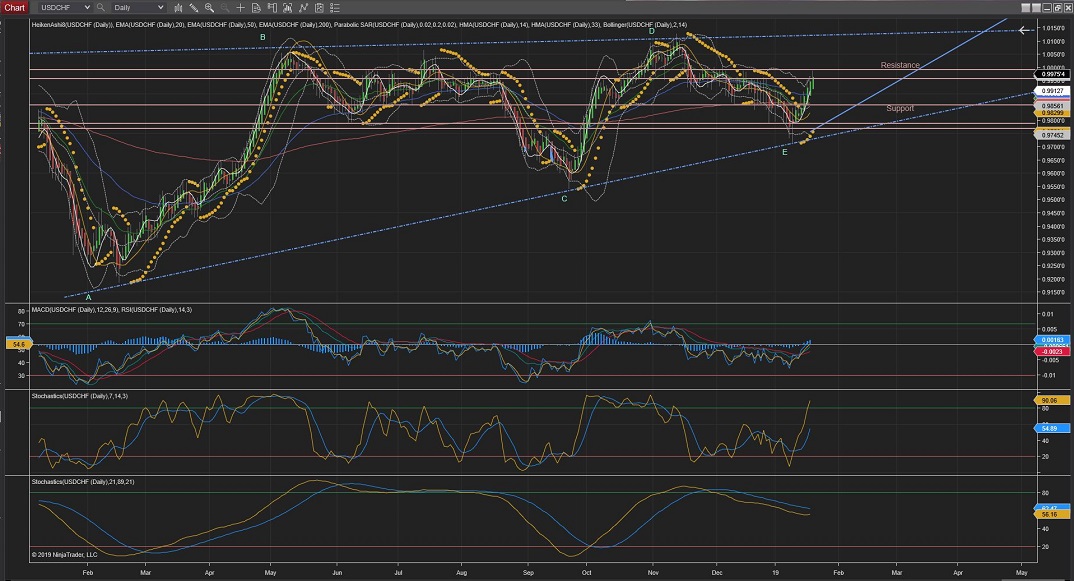
USDCHF
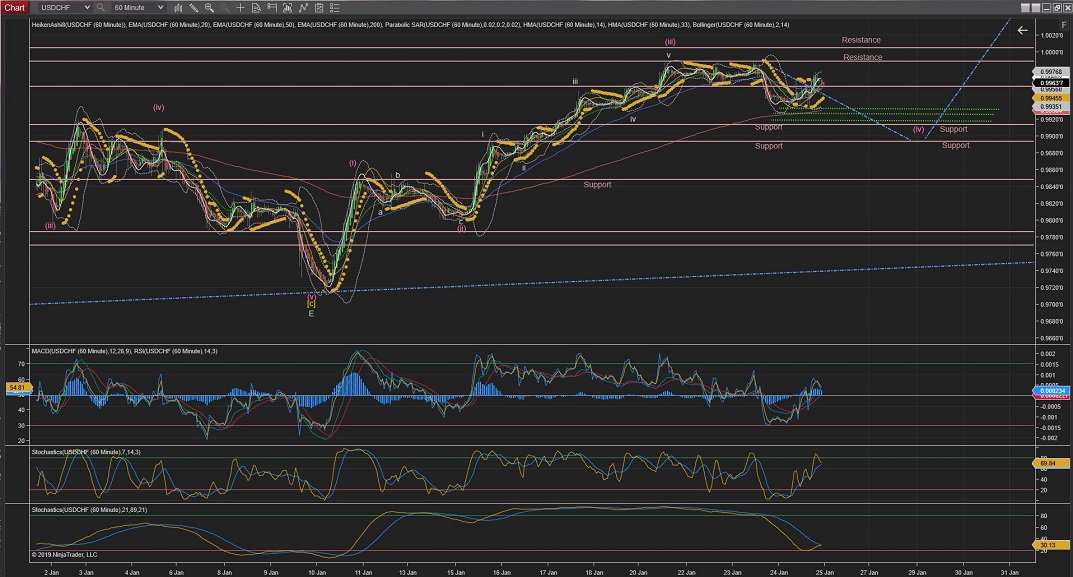
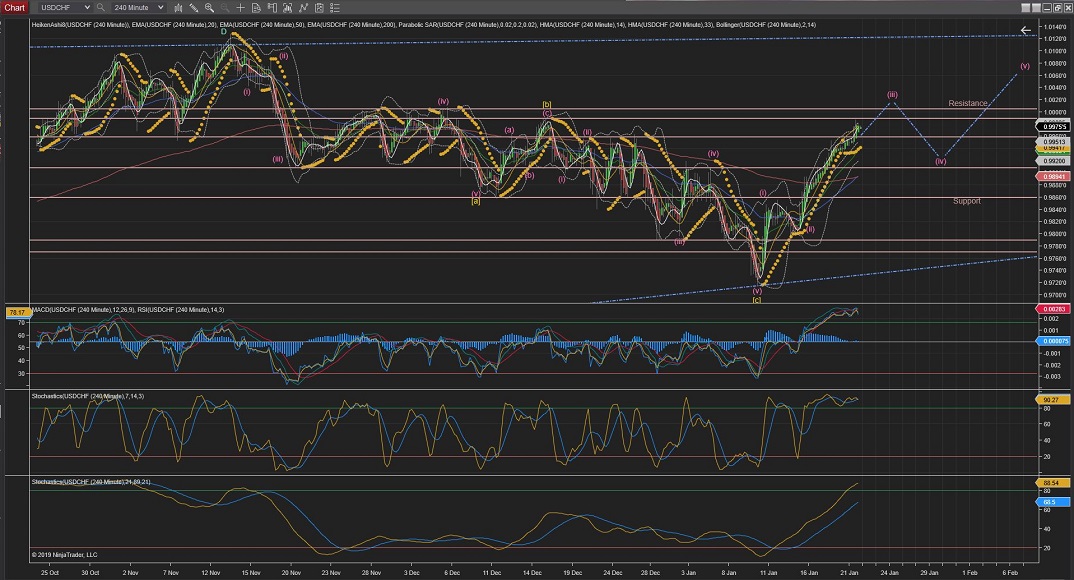
USDCHF is going through Wave (iv) now through .
Wave (iv) most provable end Support would be previous Wave (iv) @ 0.9913 or for an extended correction the previous Wave i @0.9893.
Wave (iv) should not go lower than the previous Wave (i) @9848.
60Mins
4Hours
Daily
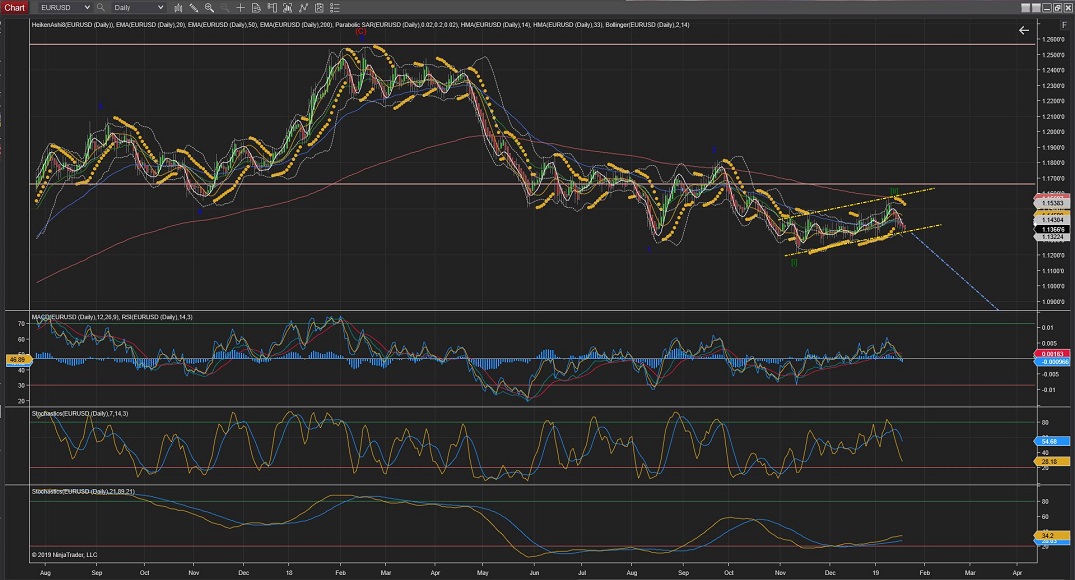
EURUSD
EURUSD
Started Wave (iii) with the first Wave i down hitting Support.
After a Wave ii correction we can expect tomorrow Wave (iii) to continue for another steep fall.
60Mins
4Hours
Daily
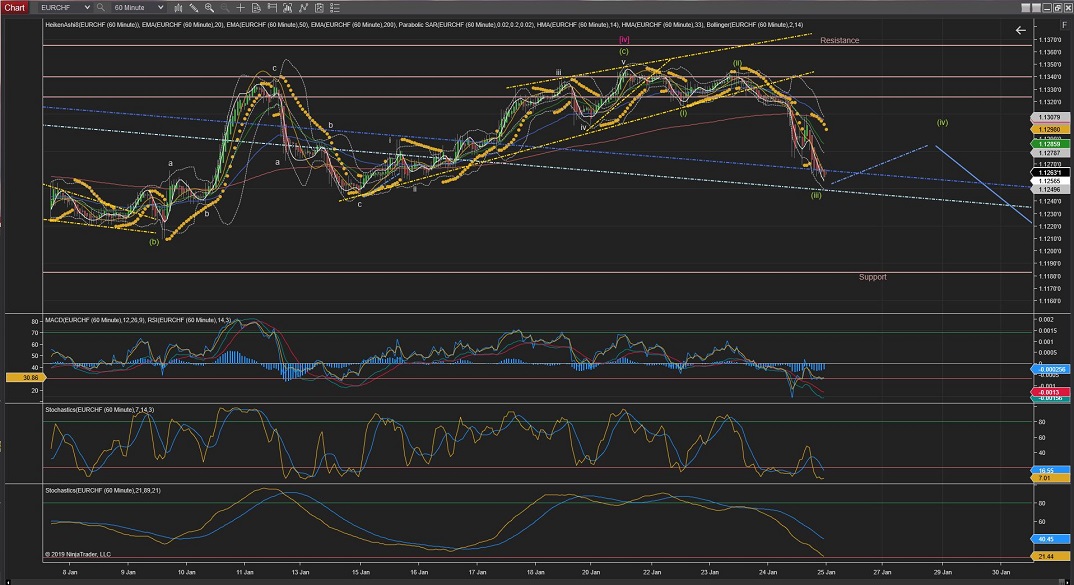
EURCHF
EURCHF appears to be going through Wave (iii) now and we could expect some Resistance at the top long-term-trend level as part of Wave (iv).
Once the price goes through the long-term-trend again will confirm Wave (iii) and we can expect further moves down towards the lower long-trend level.
60Mins
4Hours
Daily
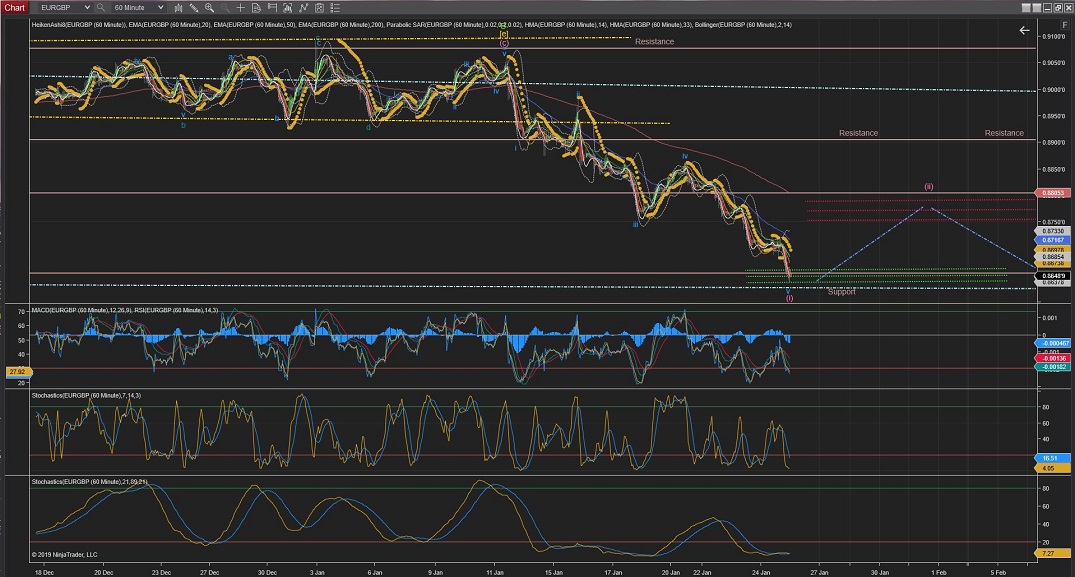
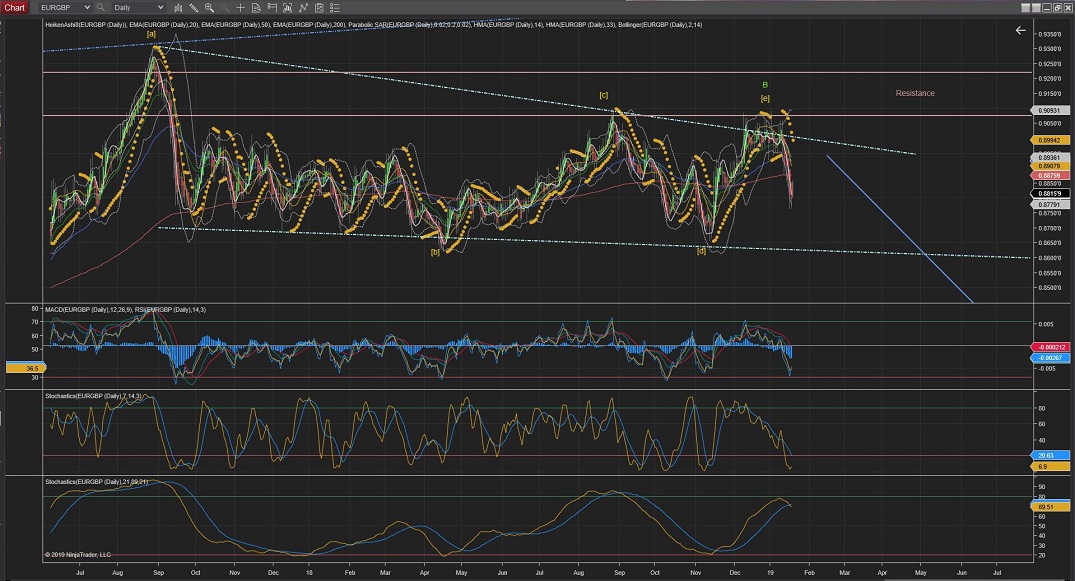
EURGBP
EURGBP might be just about to complete Wave (i) and do a small correction on Wave (ii) before going through the lower trend and support continuing towards 0.8300 levels.
60Mins
4Hours
Daily
Weekly
GBPUSD
GBPUSD might have started Wave [iii] with a small Wave i down and now going through a possible Wave ii.
If this count is right and the alternative more extensive Wave [ii] is not triggered we should expect Wave ii to carry on lower and push through the lower trend tomorrow.
60Mins
4Hours
Daily
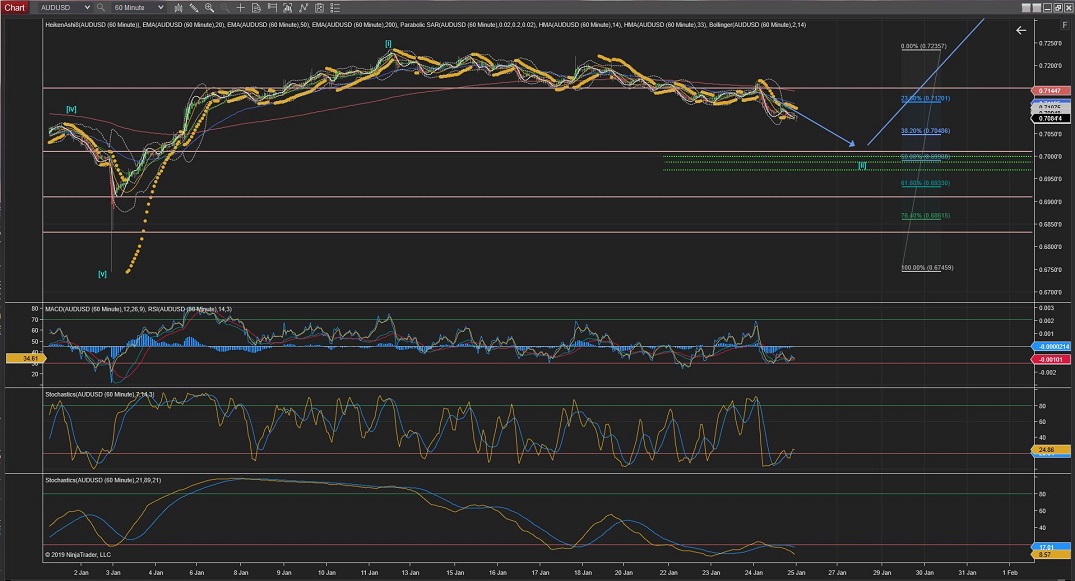
AUDUSD
AUDUSD starting to pick up momentun on the downside towards Resistance and Fib Levels.
Once the price level reaches resistance and/or %50 or %61.8 Fib retracement levels, impulsive waves to the upside could indicate that Wave [iii] is underway.
60Mins
4Hours
Daily
Weekly


 Trading Waves .org