Thu 17-01-2019
USDJPY
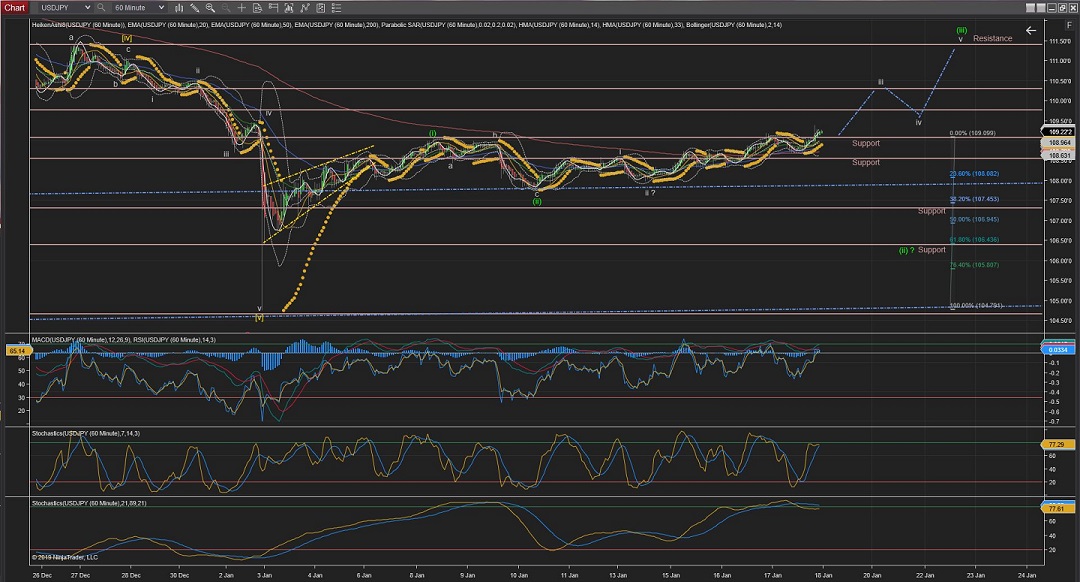
USDJPY has just crossed above the highest of Wave (i) which suppose to confirm Wave (iii) to be on the way.
Although the fact that the move lacks of impulse motion makes the alternate count still a possibility.
From this point forward, if this count is correct, the highest of Wave (i) @109.07 should serve as Support level and so is the previous Wave i @108.56
60Mins
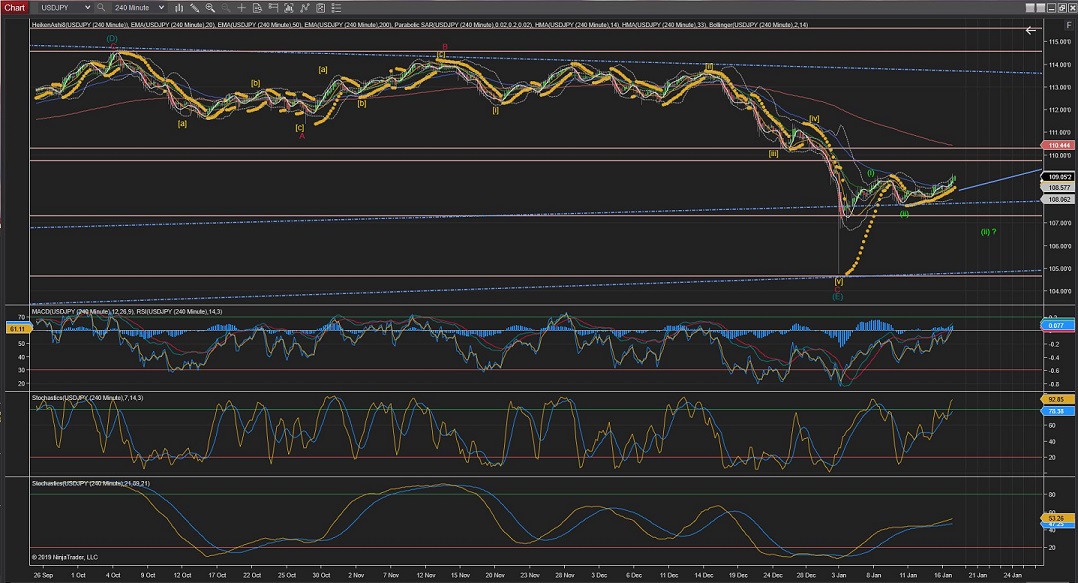
4Hours
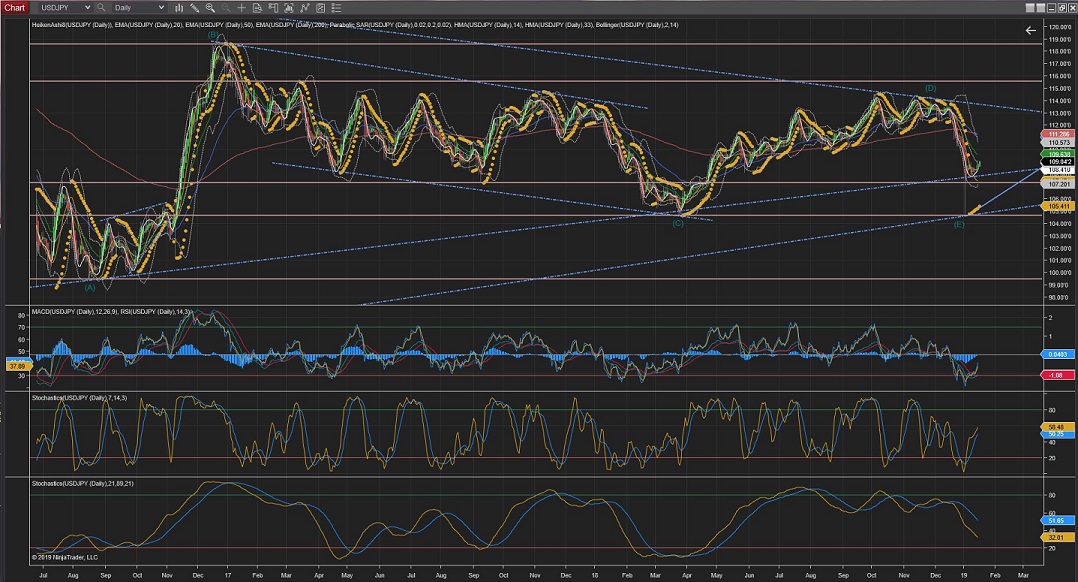
Daily
Weekly
USDCAD
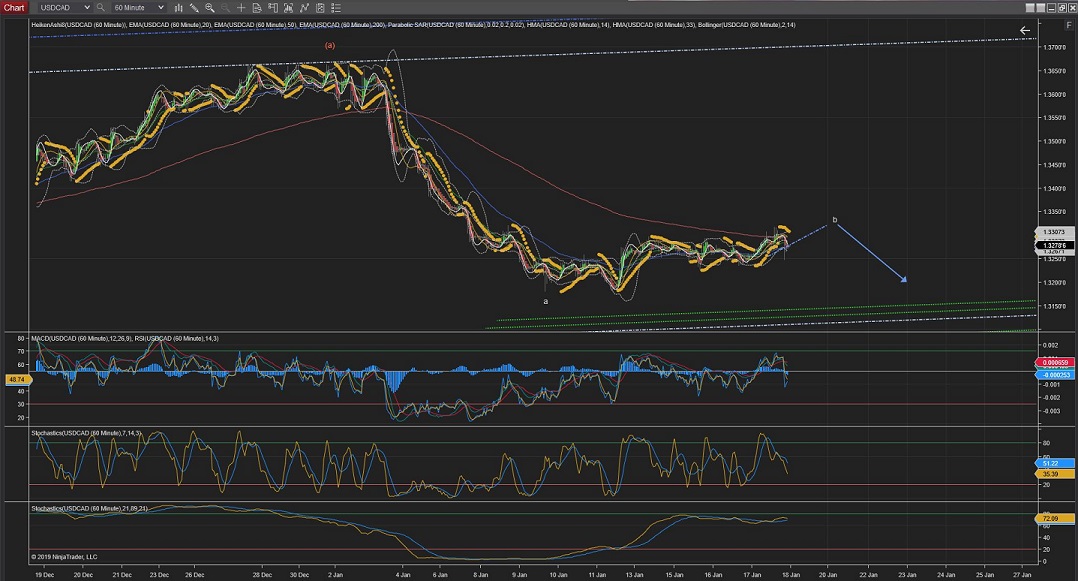
Nothing much has changed since yesterday for USDCAD, as there has not been much price action:
USDCAD looks to be in the middle of a Wave b (Within Wave (b)); Best seen in the 4 Hour Chart.
And looking at the 4 Hour Chart this potential 3 wave structure within the smaller Wave b could finish in the 200EMA.
So this could be the turning point to initiate the final bit of the move towards the lower Trend.
60Mins
4Hours
Daily
USDCHF
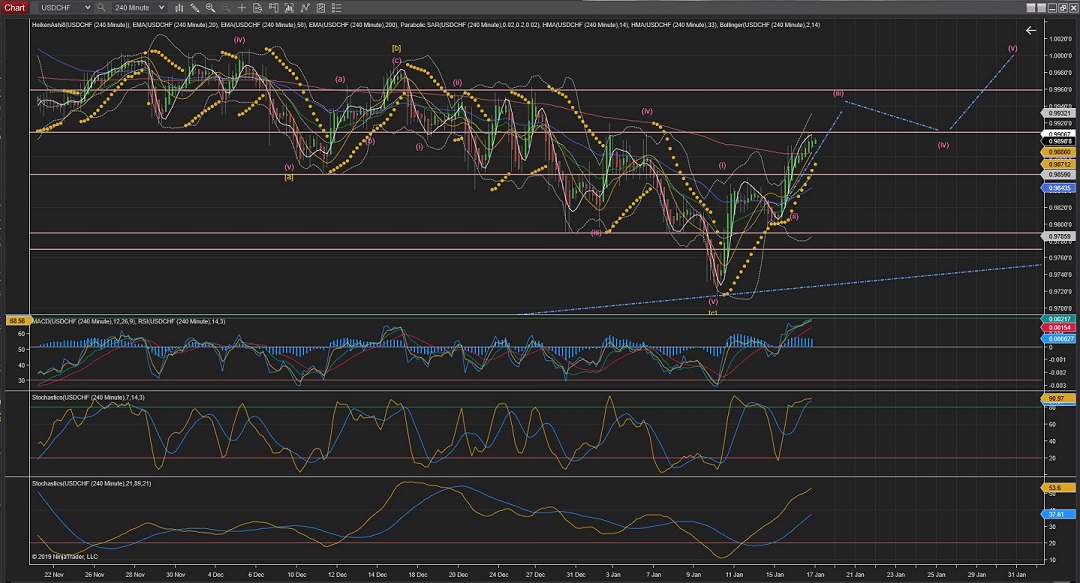
USDCHF looks like just completed Wave iii of Wave (iii).
Wave iv now should remain above the previous Wave i highest @0.9894 (this level would act as Support until Wave (iii) is completed).
60Mins
4Hours
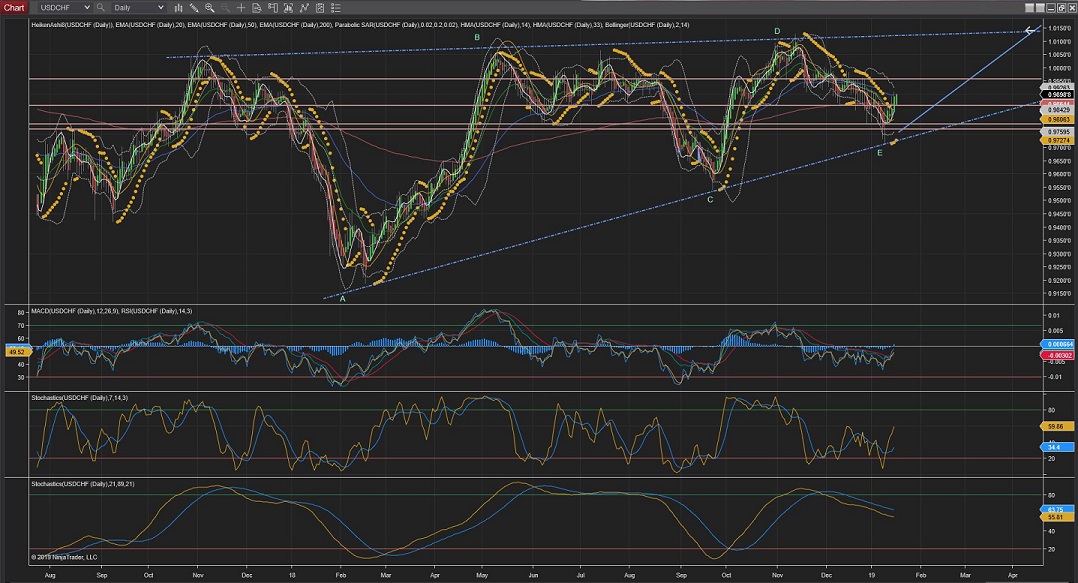
Daily
EURUSD
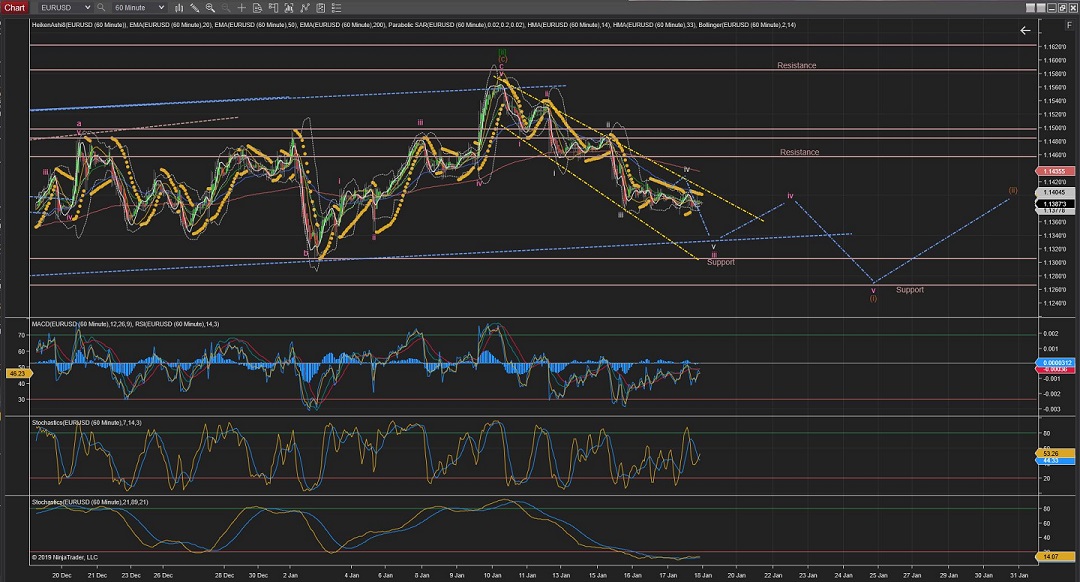
EURUSD is still going through Wave iv of its higher degree Wave iii (pink).
And tomorrow it should hit the lower Trend level to complete Wave iii.
Next week we should see Wave iv correction and the final Wave v completed to finish Wave (i)
60Mins
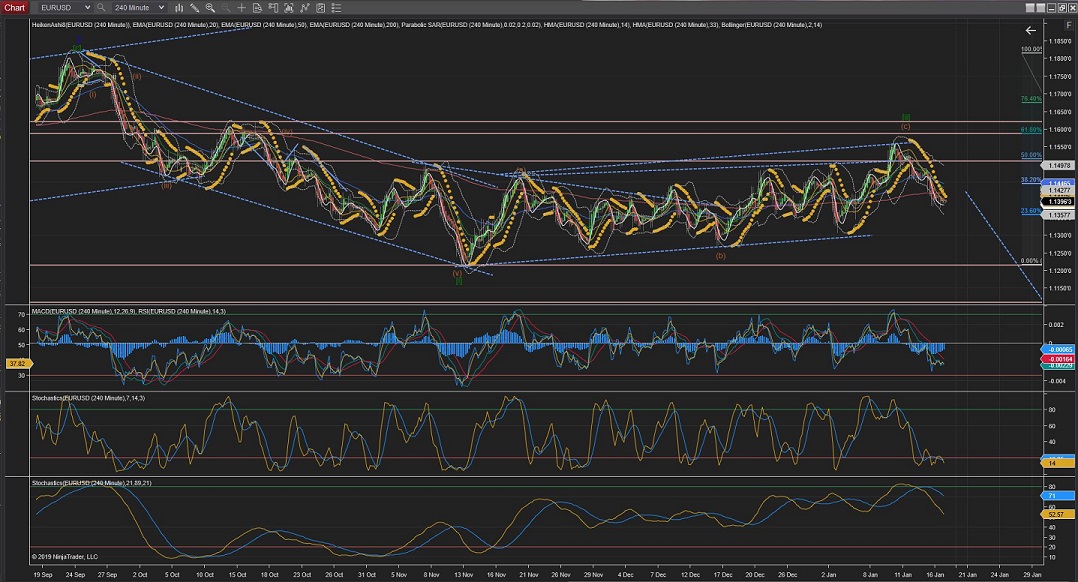
4Hours
Daily
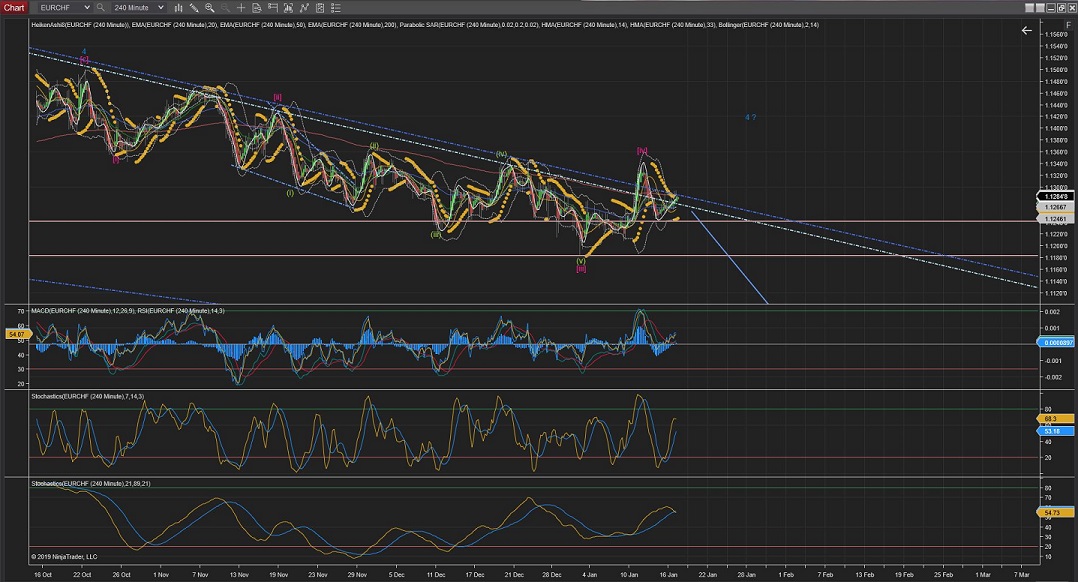
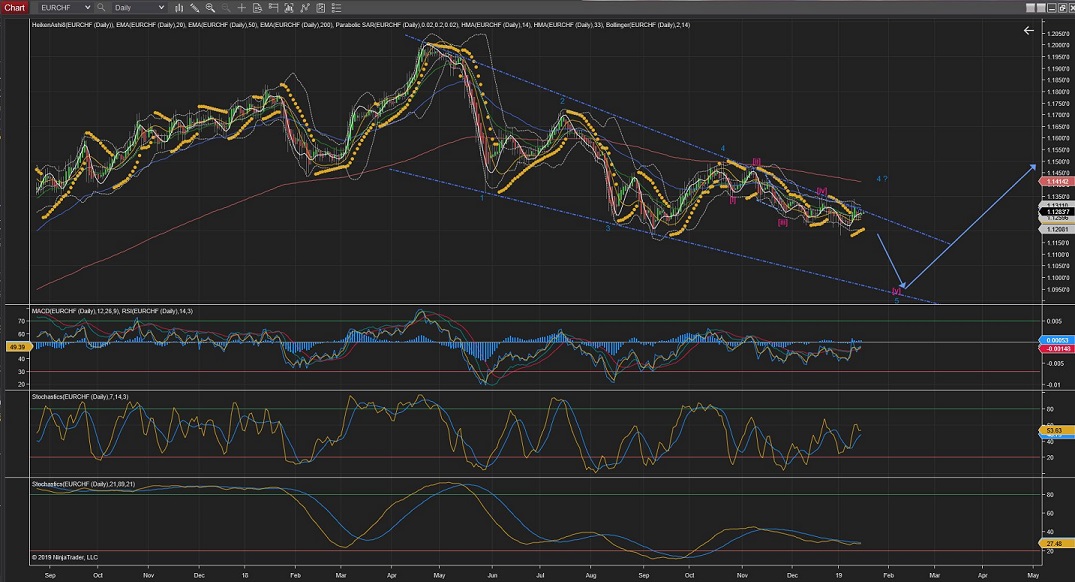
EURCHF
EURCHF is getting very close to dismiss the current count and trigger the alternate for an extended Wave 4 (best pictured in Daily Chart).
If the alternate count is not triggered (by crossing over Previous Wave (iv) highest @1.1340) then the current count stands as a Wave (ii) almost complete and Wave (iii) should start downwards very soon.
60Mins
4Hours
Daily
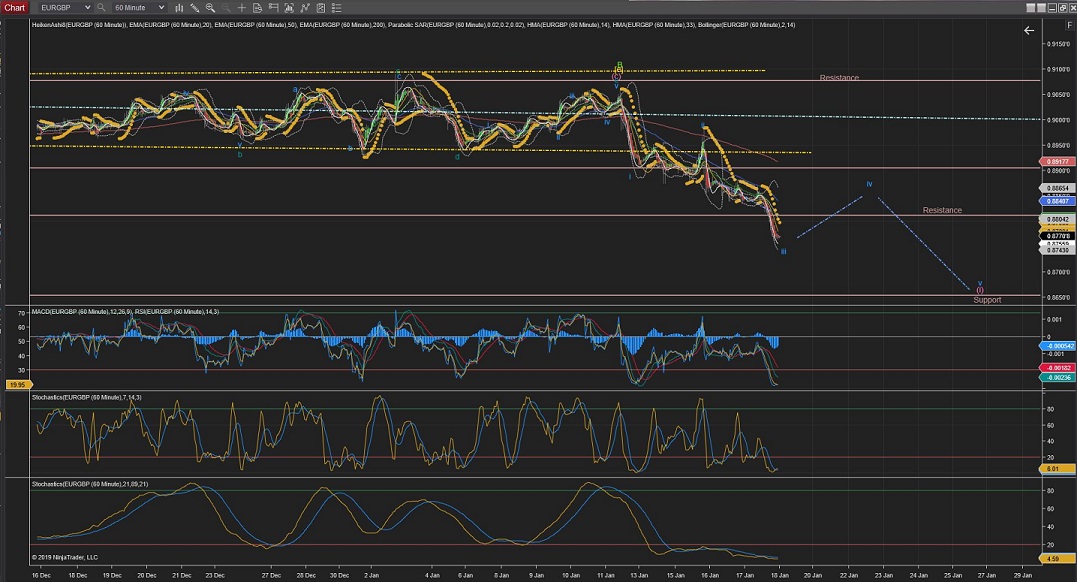
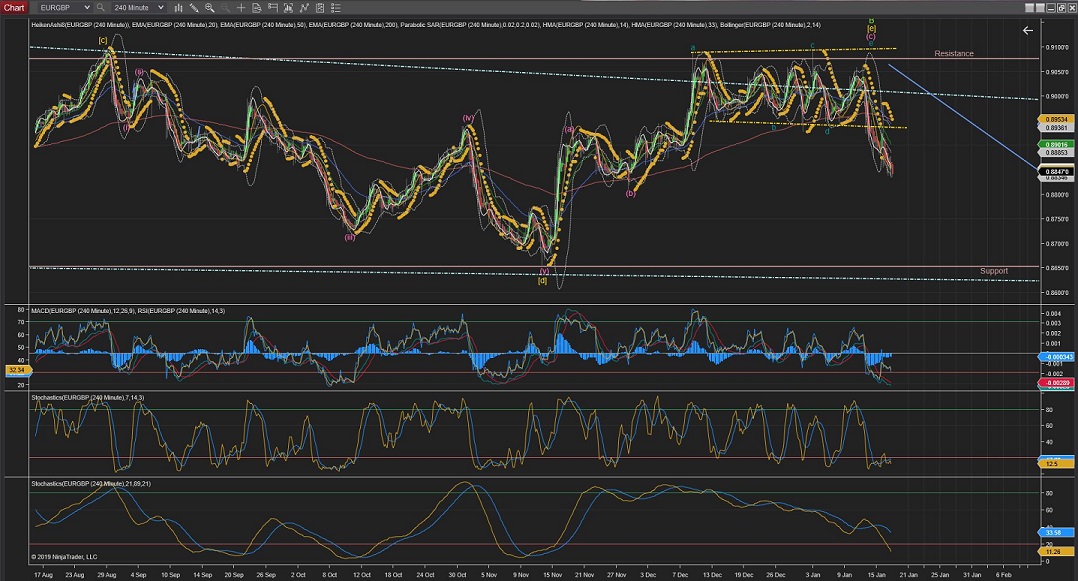
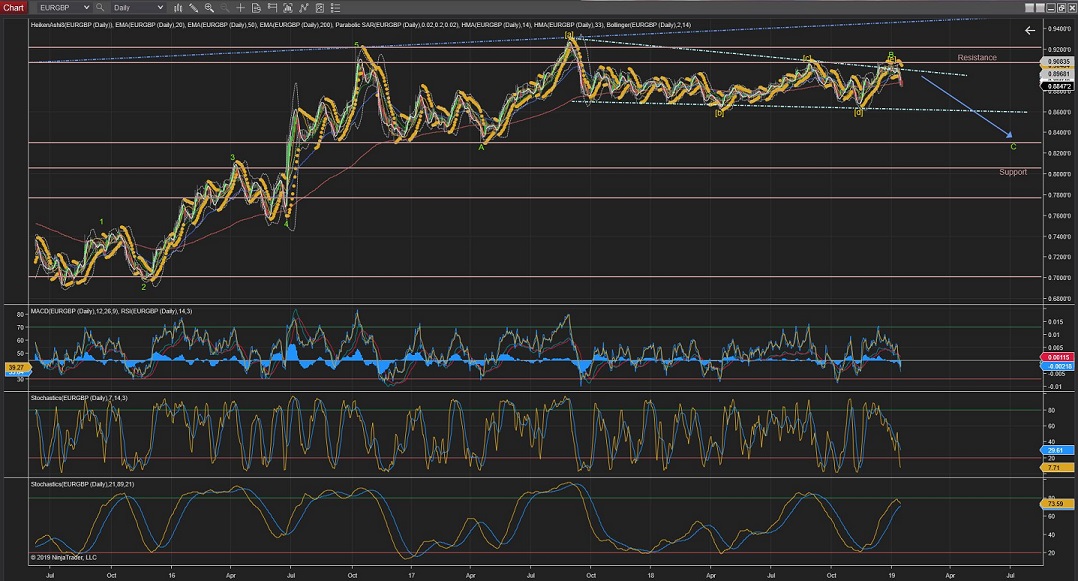
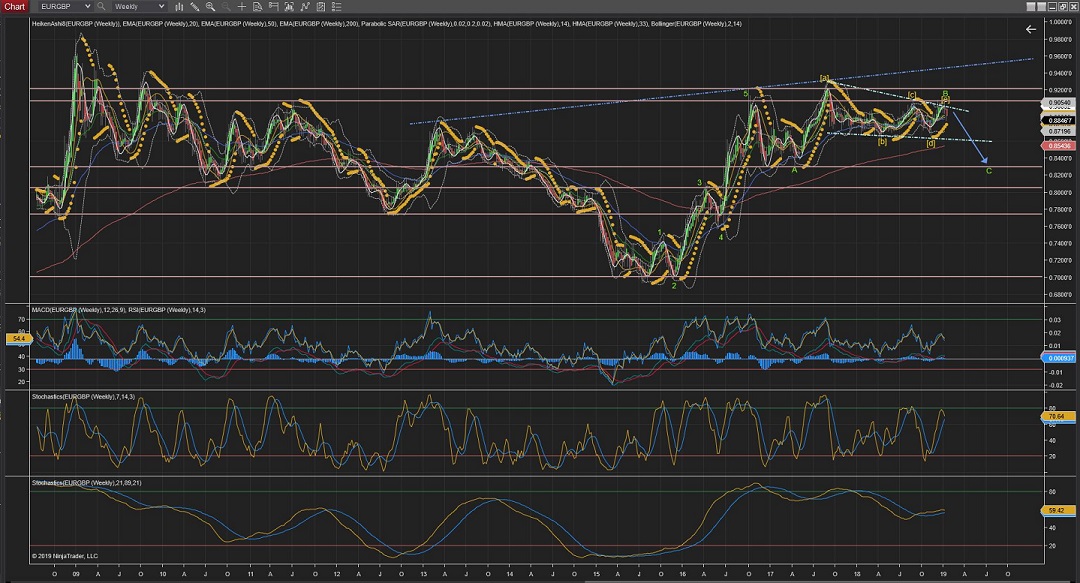
EURGBP
EURGBP Wave iii cross over previous Support levels in an impulsive mode and seems like Wave iv correction would be starting any time now.
Once Wave iv is completed, we should see Wave v underway towards the next levels of support @0.8653
60Mins
4Hours
Daily
Weekly
GBPUSD
GBPUSD finally triggered the alternate count and it might be completed now or should complete it at Resistance levels @1.3034 with the 200EMA(Daily Chart).
Once Wave [ii] completed, Wave (i) of Wave [iii] should start the downtrend.
60Mins
4Hours
Daily
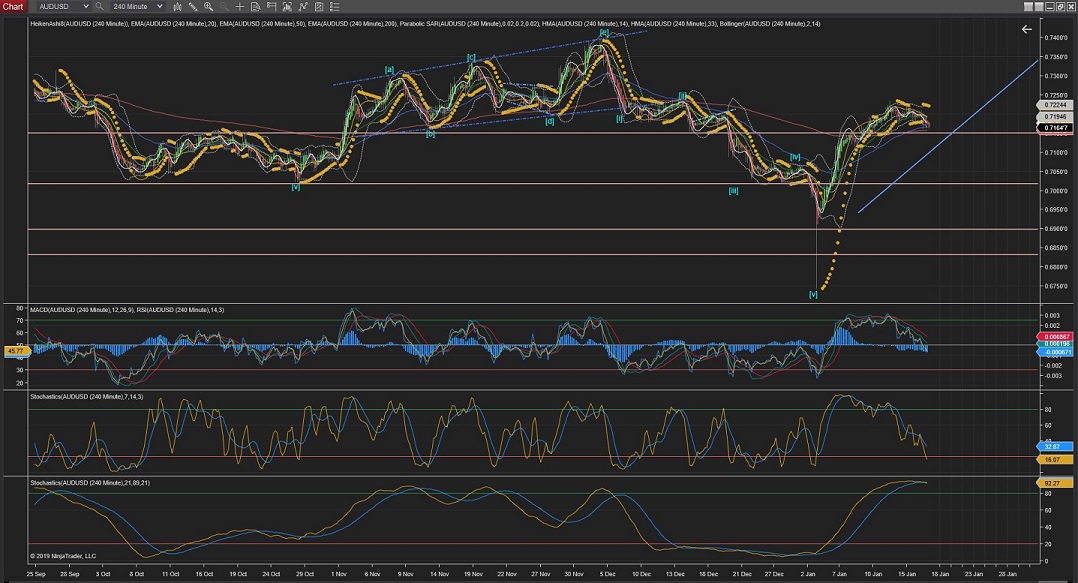
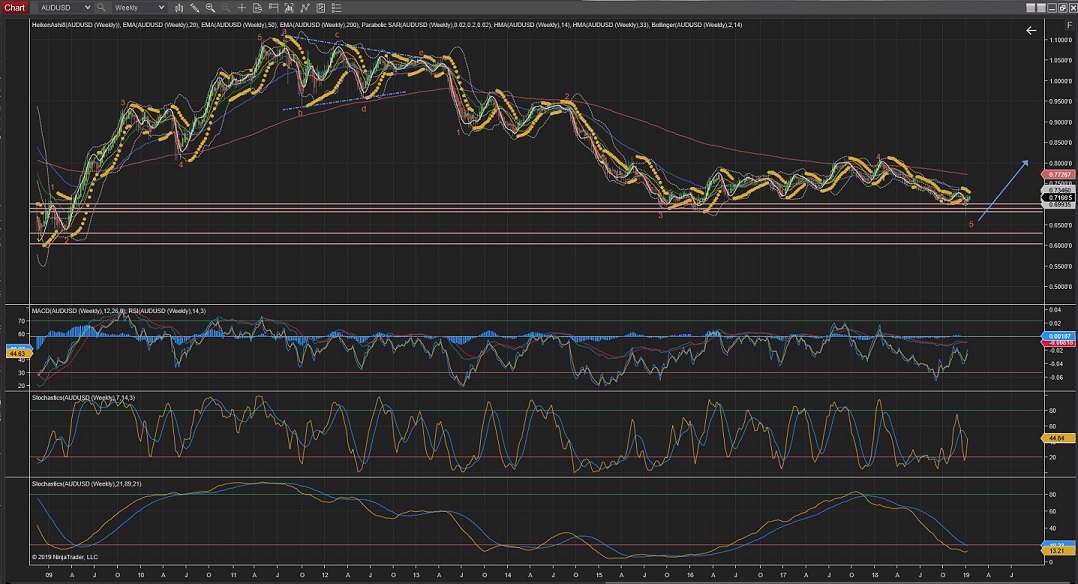
AUDUSD
AUDUSD, as usual, is starting to show some slight movement to the downside to what potentially could be Wave (ii).
Price action is been really quite upto now so, if that changes, maybe some movements could finally start to define some waves that can be worked on.
60Mins
4Hours
Daily
Weekly


 Trading Waves .org