Fri 24-02-2023
Hi everyone, hope you are all great.
So... Let's get into it...
USDJPY
Weekly Chart is showing Wave(1) and Wave (2) completed when the price has crossed the upper long-term trendline...
And then a rise from the lower trend line, after the this long-term correction, under the current count,
suggests Wave (5) of [3] of a long-term raise is well confirmed and looks like finally has come to an end... Time for corrective Wave [4] to take place... And its internal Wave (A) seems to have already been completed... Wave (B) of Wave [4] next...
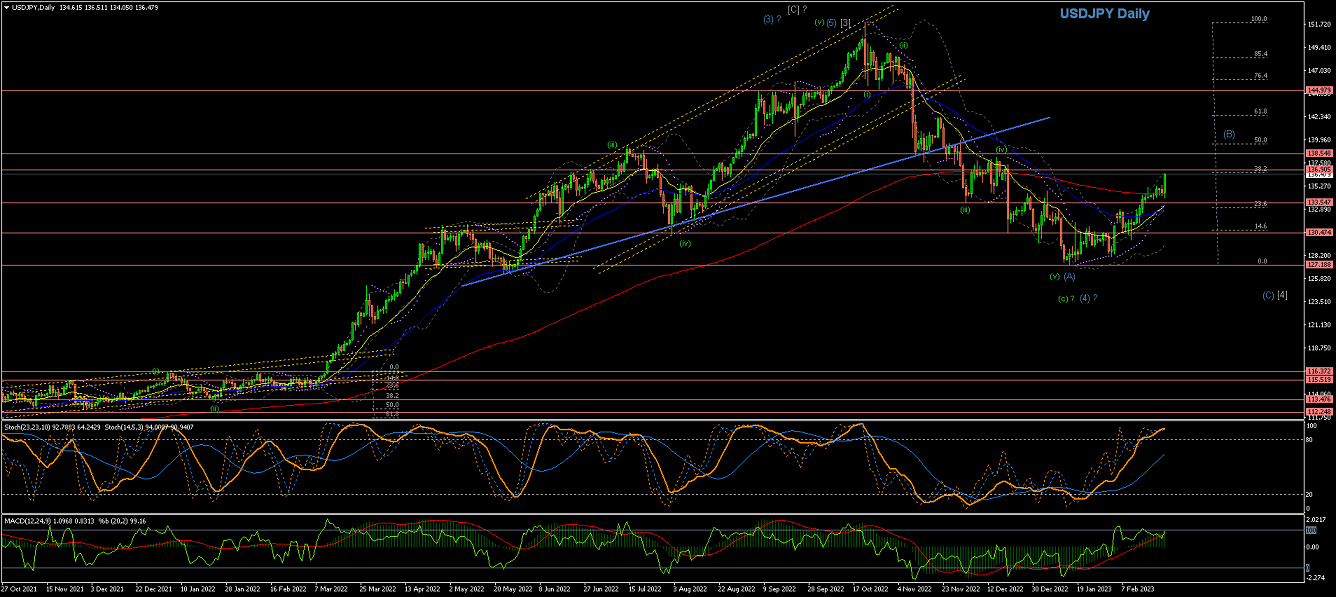
Daily Chart is showing Wave (v) of Wave (5) of Wave [3] completed... then Wave (v) of Wave (A) completed...
Now corrective Wave (B) seems to be taking place, as the price raises through the 200EMA... Watchout for Wave (C) of Wave [4] to bring the price lower again after a top is confirmed...
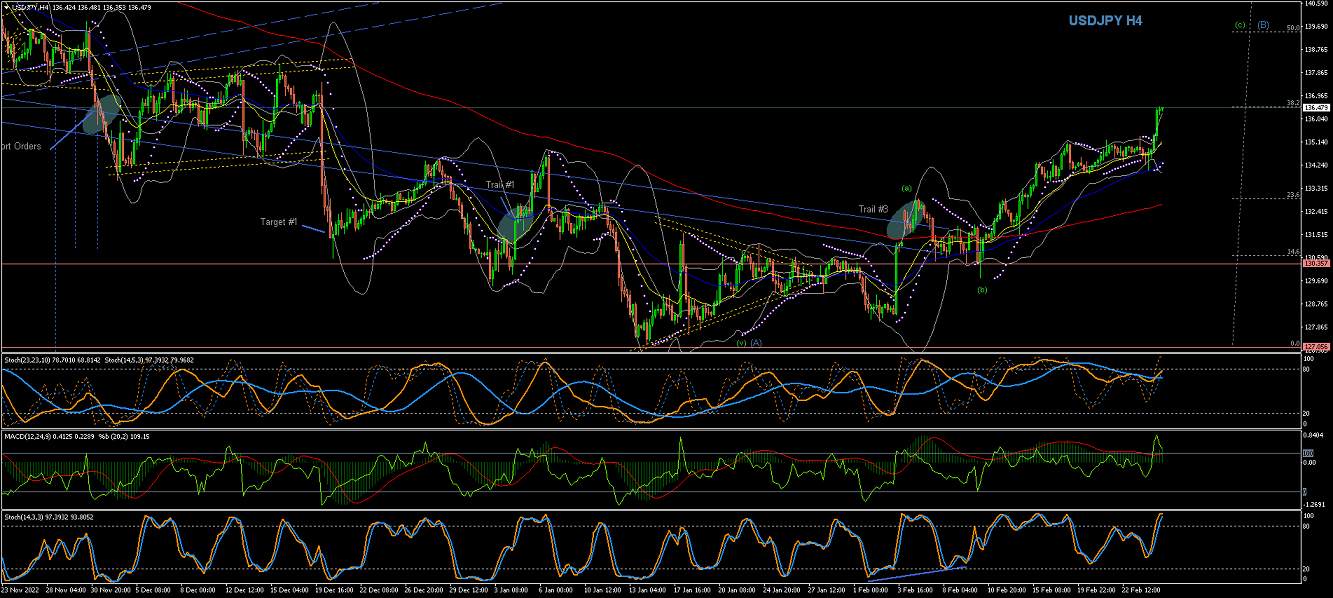
4Hour Chart is showing the internal Waves of Wave (A) completed...
and now Wave (B) should take its corrective form... Although its internal Waves (a) and (b) seem to be completed...
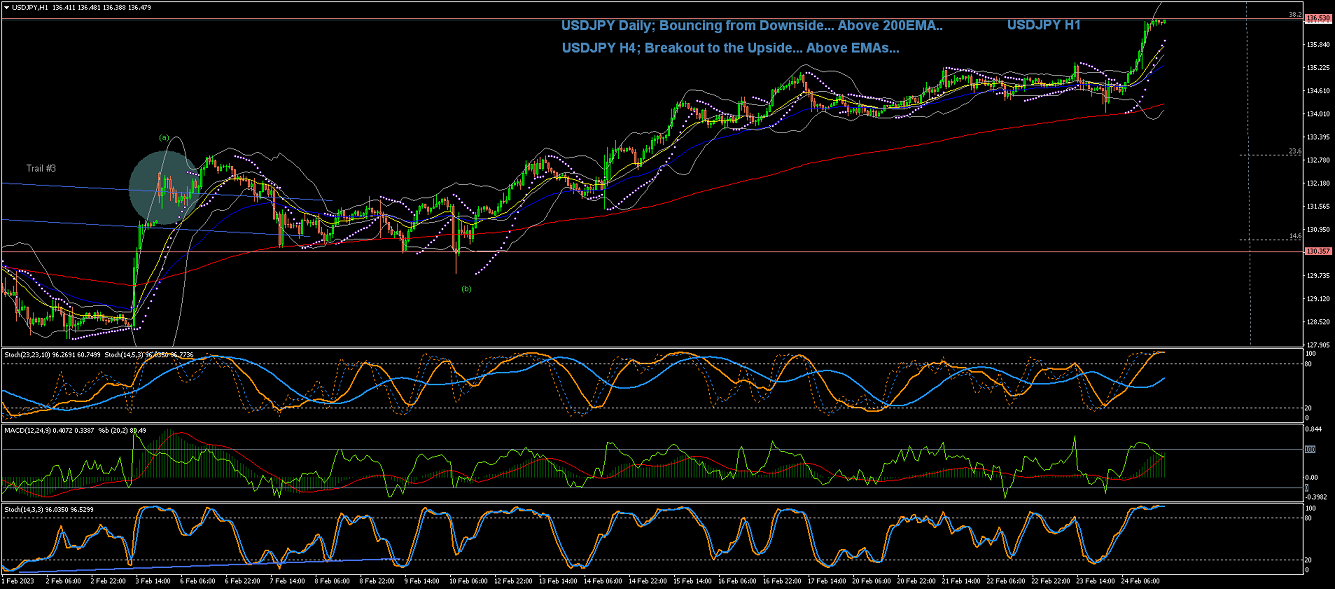
60Min Chart shows Waves (a) and (b) completed on a breakout of a long term Trendlline, as the price keeps raising...
Wave (c) of Wave (C) now be developing to the upside...
EURUSD
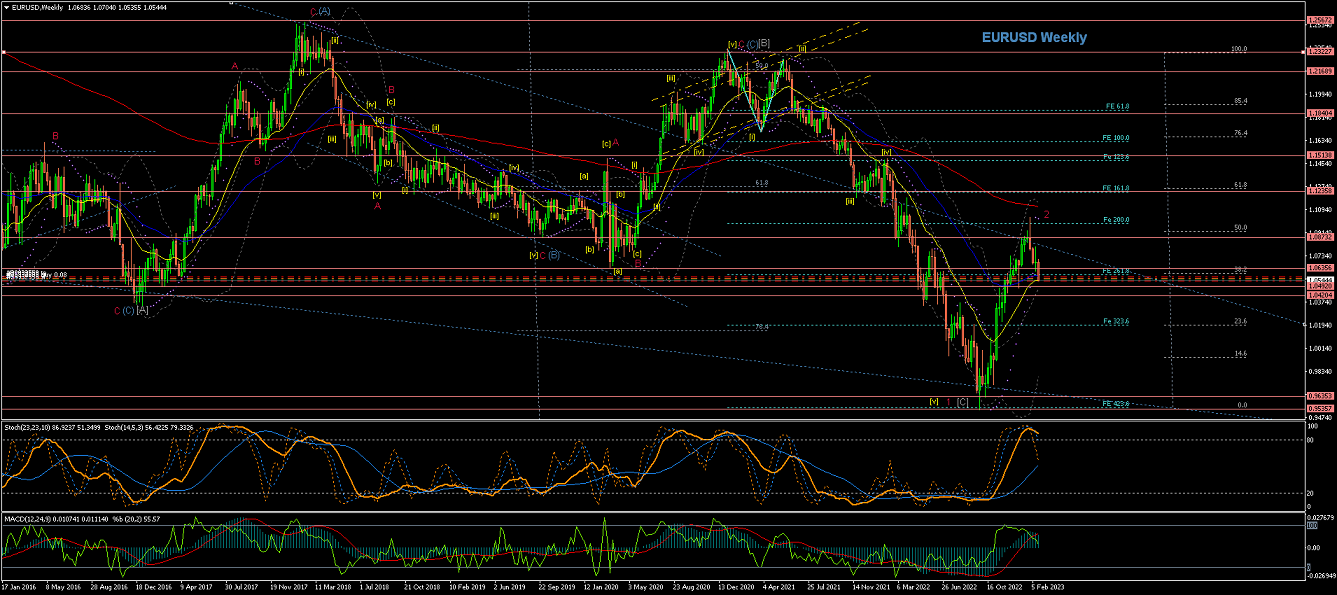
Weekly Chart is showing an extended Wave C(red) of Wave (C) of Wave [B] completed a top...
And then the price reverting into a down Trend as it headed down impulsively across the EMAs,
after a sharp corrective Wave [ii]...
Notice how the price has confirmed Wave [iii] as it has crossed the lowest of Wave [i] and reached its 161.8 extension...
The reaction to the long-term Trendline(blue) formed Wave [iv] correction... And the price pierced through the long-term Trendline(blue) to continue with Wave [v] of Wave 1 red of Wace [C]... Wave 2 red could have now completed as a sharp raise that hit the %50 retracement and is reversing for the potential of a Wave 3 red to bring the price down impulsivelly...
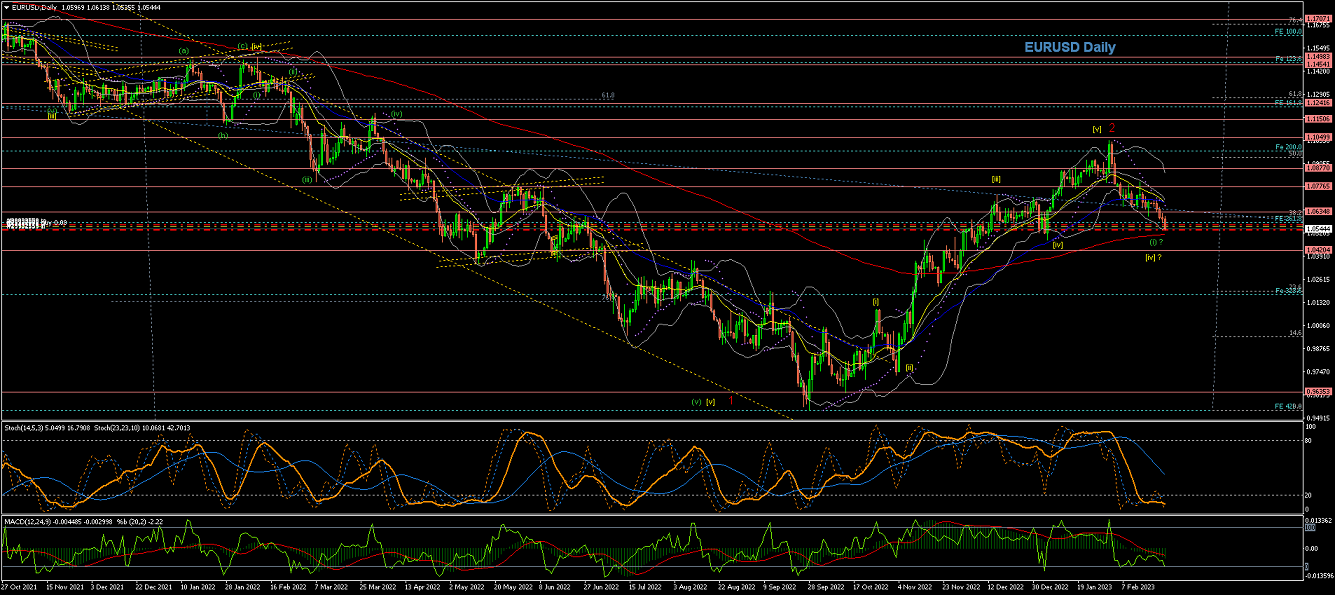
Daily Chart is showing the price has temporally crossed the EMAs for the potential of a new long-term Trend to the downside...
as Waves [i], [ii], [iii], [iv] and Wave [v] look to have completed Wave 1 (red)...
Now the price is raising for what should be corrective Wave 2 (red) which could have come to an end as it is reversing after hitting the %50 retracement...
...
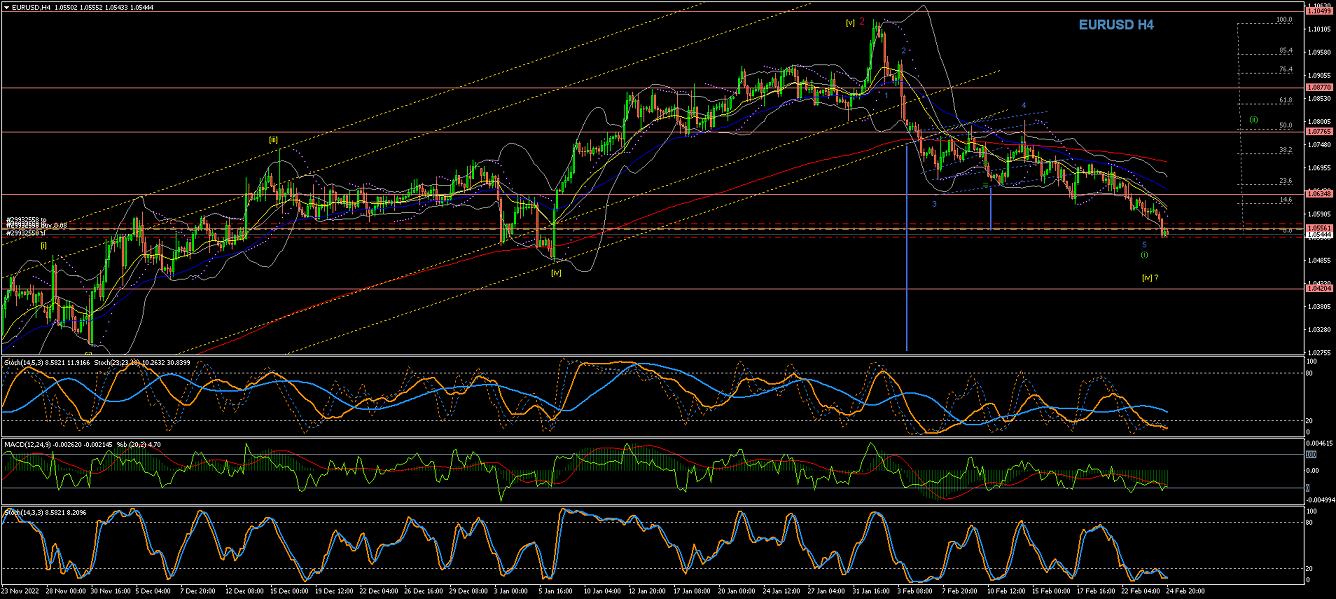
4Hour Chart is showing Wave 5 (blue) under development, as the price breaks out of the Ascending Range...
...
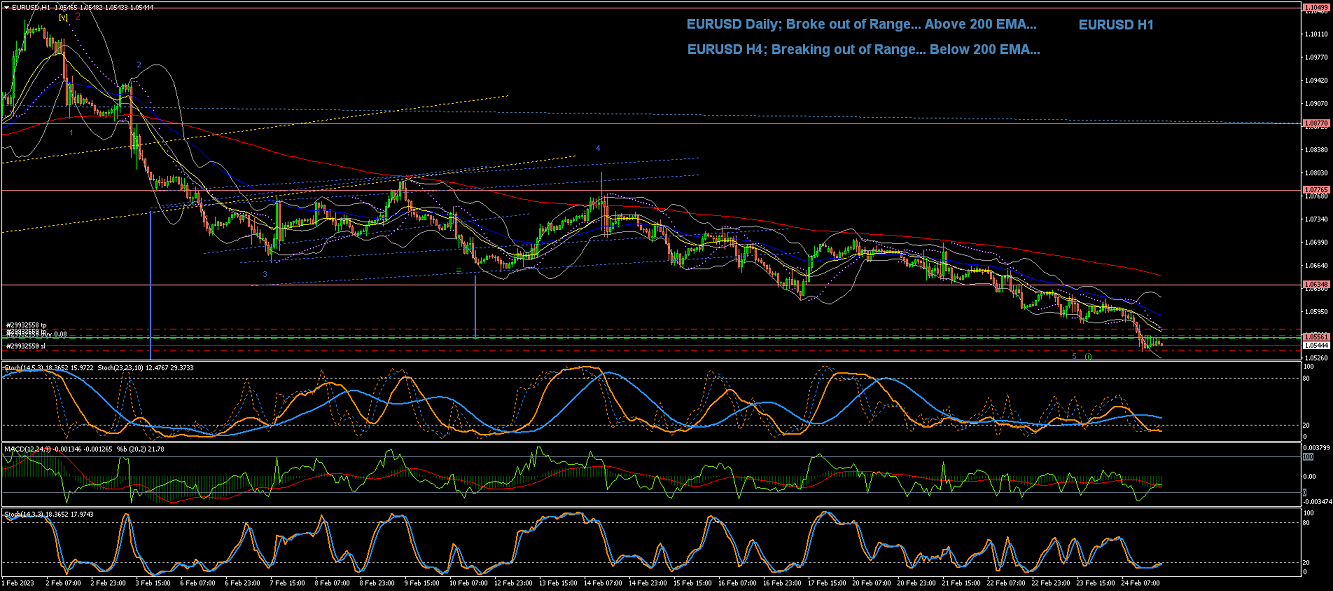
60Min Chart is showing the internal Waves of Wave (i) coming to an end...
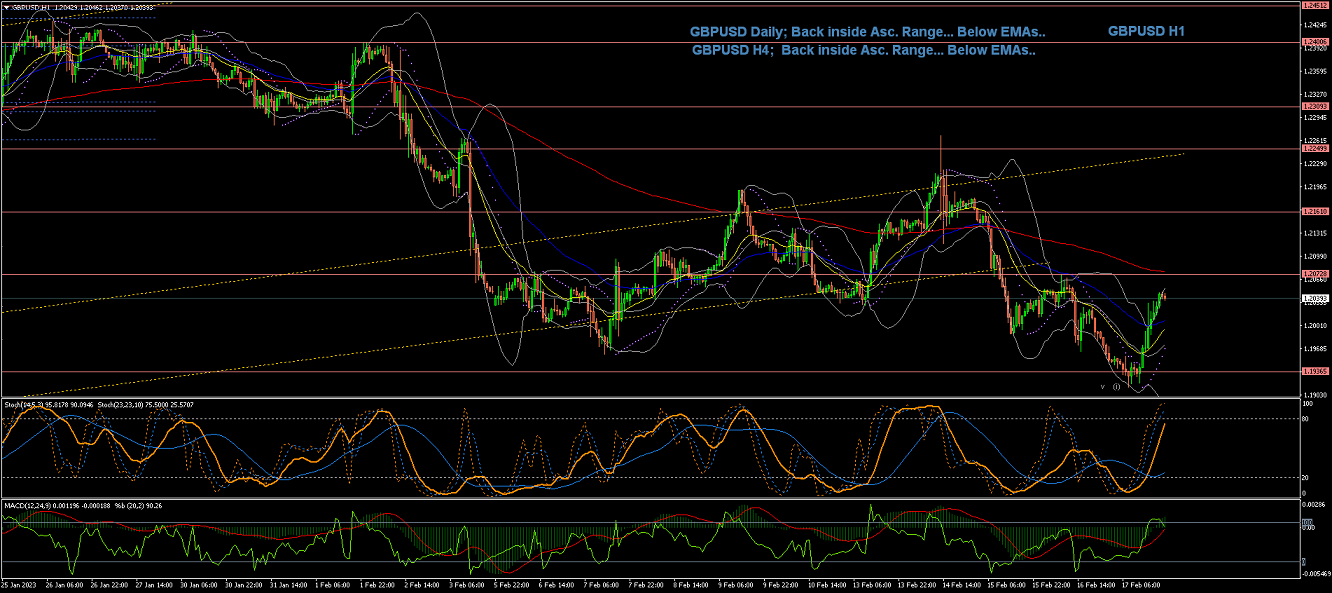
GBPUSD
Weekly chart shows an extended Wave (4) correction crossing the EMAs initially in a rather struggling way...
And then the price has came down lower across the EMAs more impulsively to follow Wave (5), as per current count...
The moves look now more impulsive...
as you would expect for Wave (5)...
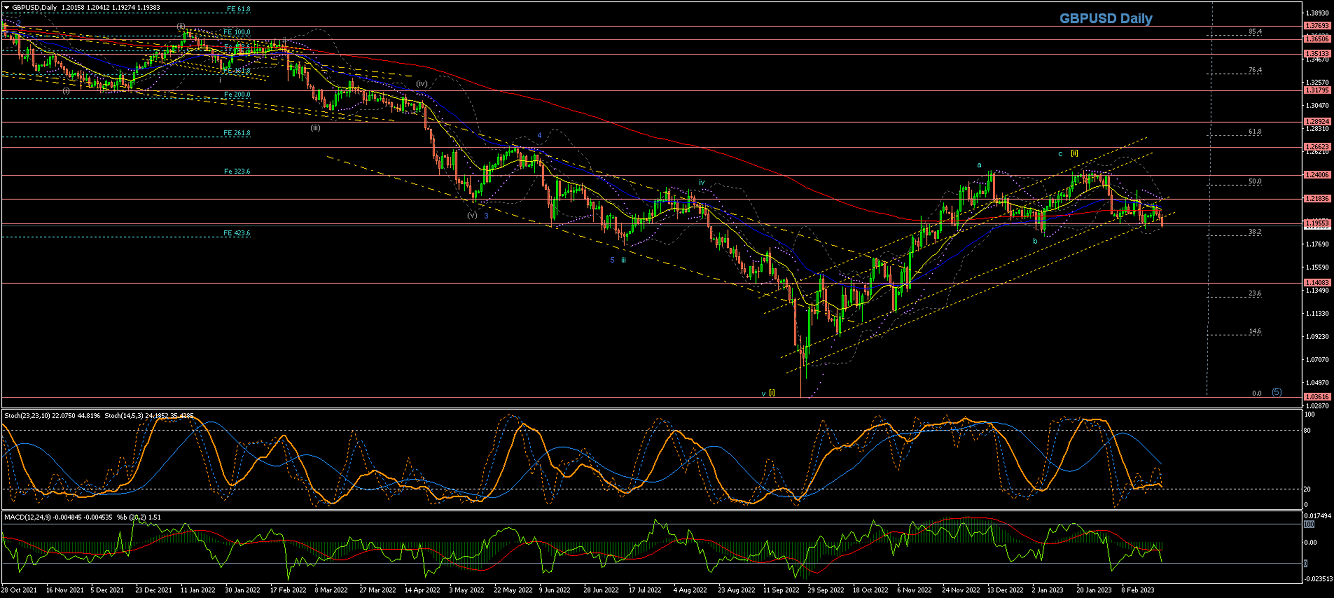
Daily Chart is showing the price completed the breakout of the descending Range formation (yellow) to the downside...
And for this Wave [i] its internal Wave v looks to have come to an end, as the price raised towards the 200EMA to complete Wave [ii] at just above the %50 retracement... Watchout for Wave [iii] to breakout of the current Ascending Range and bring the price down next...
4Hour Chart shows the price raising to complete corrective Wave [ii]... With the potential to breakout of the current Range to the downside; which can bring the price lower and continue with the current long-term Wave [iii] to the downside...
60Min Chart is showing the price moving impulsivelly down... and looking to breakout of the current Range to the downside... so watch out for the potential reversal to the downside...
All the best for everyone and please do not hesitate to contact me if you have any questions or comments.
Andres
info@tradingwaves.org
Please be aware: that these Analysis are own opinions, not Trading advice; Trading carries a high level of risk, and may not be suitable for all investors. Before deciding to trade you should carefully consider your investment objectives, level of experience, and risk appetite.


 Trading Waves .org