Fri 11-11-2022
Hi everyone, hope you are all great.
So... Let's get into it...
USDJPY
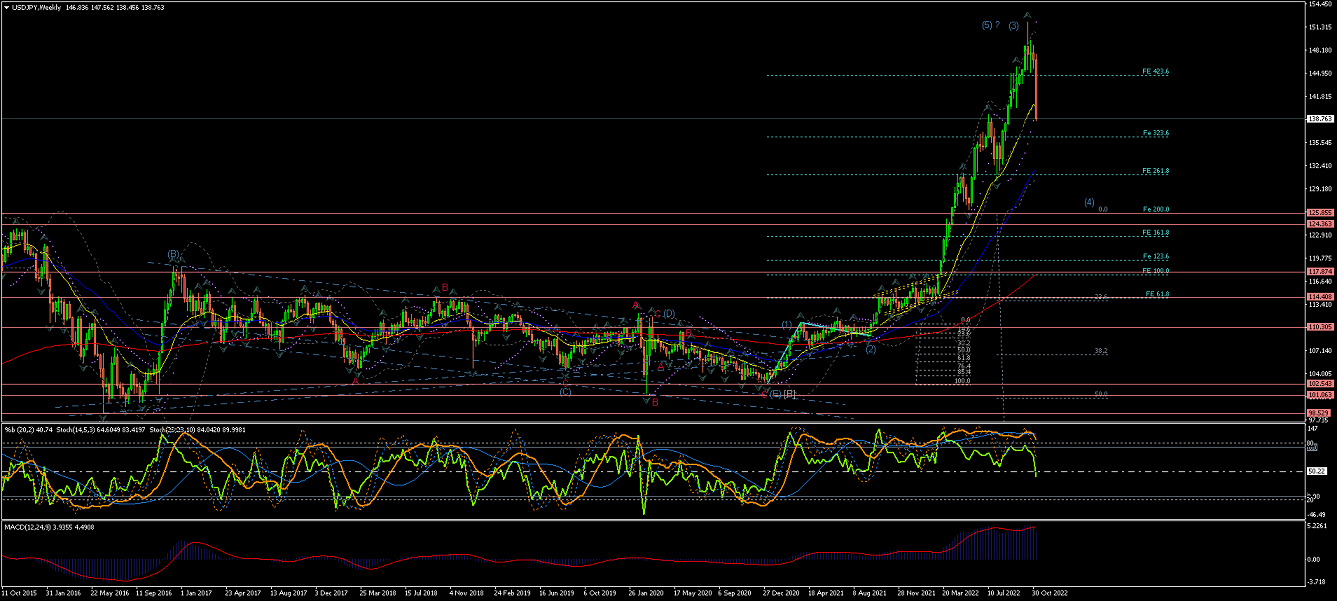
Weekly Chart is showing Wave (1) could be completed now that the price has crossed the upper long-term trendline...
And then a rise from the lower trend line, after the this long-term correction, under the current count,
suggests Wave (3) of a long-term raise is well confirmed and looks like finally has come to an end...
Daily Chart is showing Wave (1) completed... then Wave (2) completed with a small correction (of %38 retracement)...
and then the price raising above the highest point of Wave (1), suggested Wave (3) developed, with its internal Waves likely completed... So watchout for corrective Wave (4)...
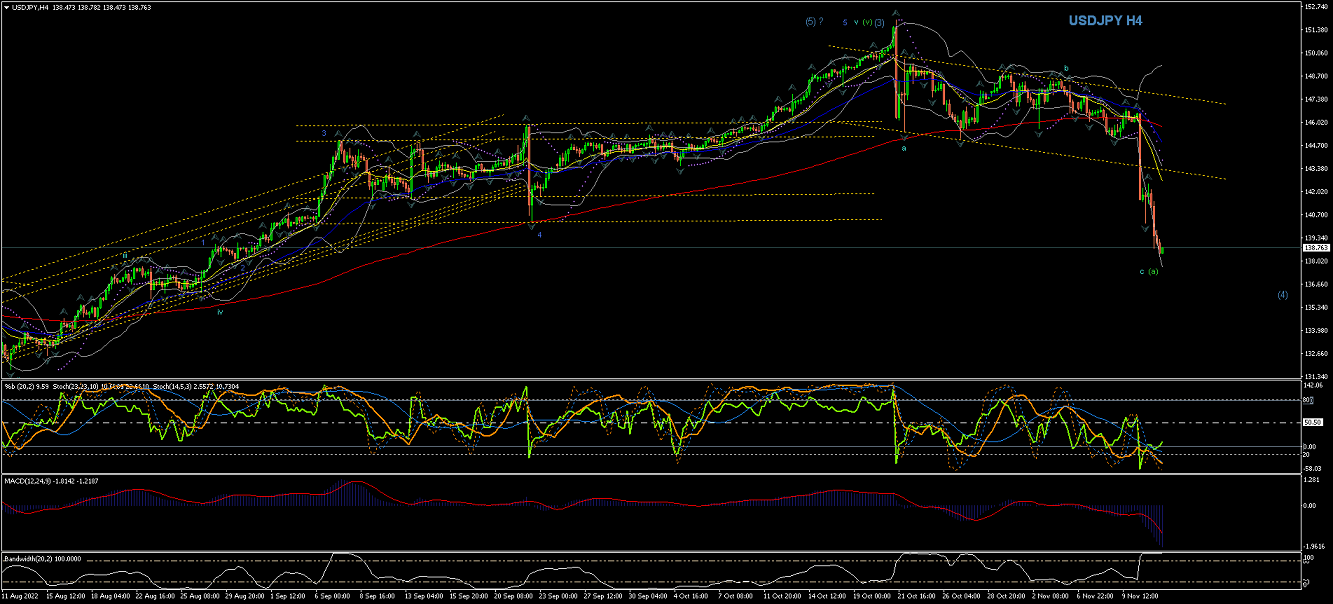
4Hour Chart is showing the internal Waves of Wave (3) completed...
and now Wave (4) should take its corrective form...
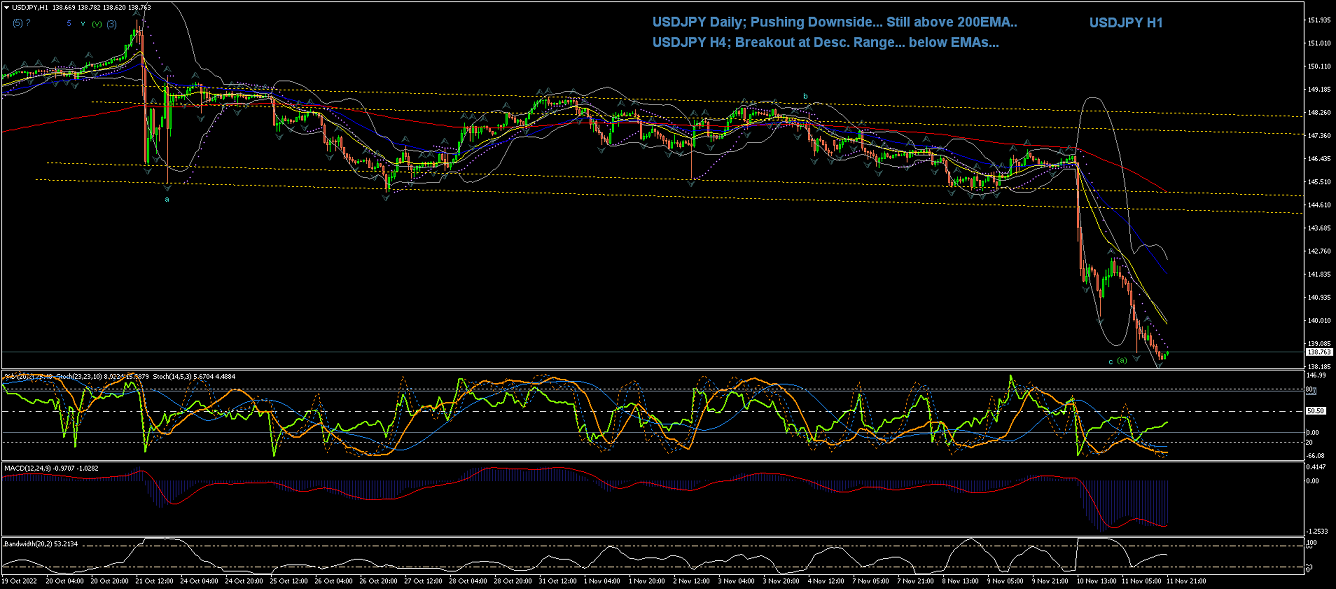
60Min Chart shows Wave (3) could be completed on a breakout of the current 4Hour Range...
Wave (4) developing...
EURUSD
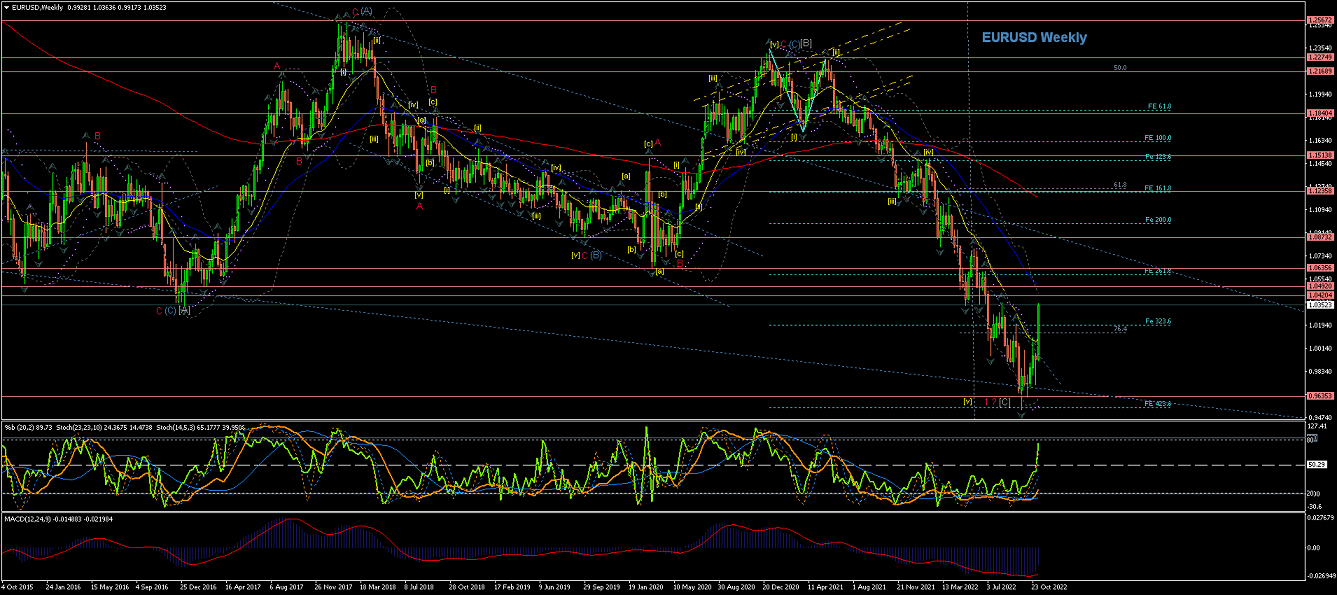
Weekly Chart is showing an extended Wave C(red) of Wave (C) of Wave [B] completed...
And then the price reverting into a down Trend as it headed down impulsively across the EMAs,
after a sharp corrective Wave [ii]...
Notice how the price has confirmed Wave [iii] as it has crossed the lowest of Wave [i] and reached its 161.8 extension...
The reaction to the long-term Trendline(blue) formed Wave [iv] correction... And the price pierced through the long-term Trendline(blue) to continue with Wave [v]...
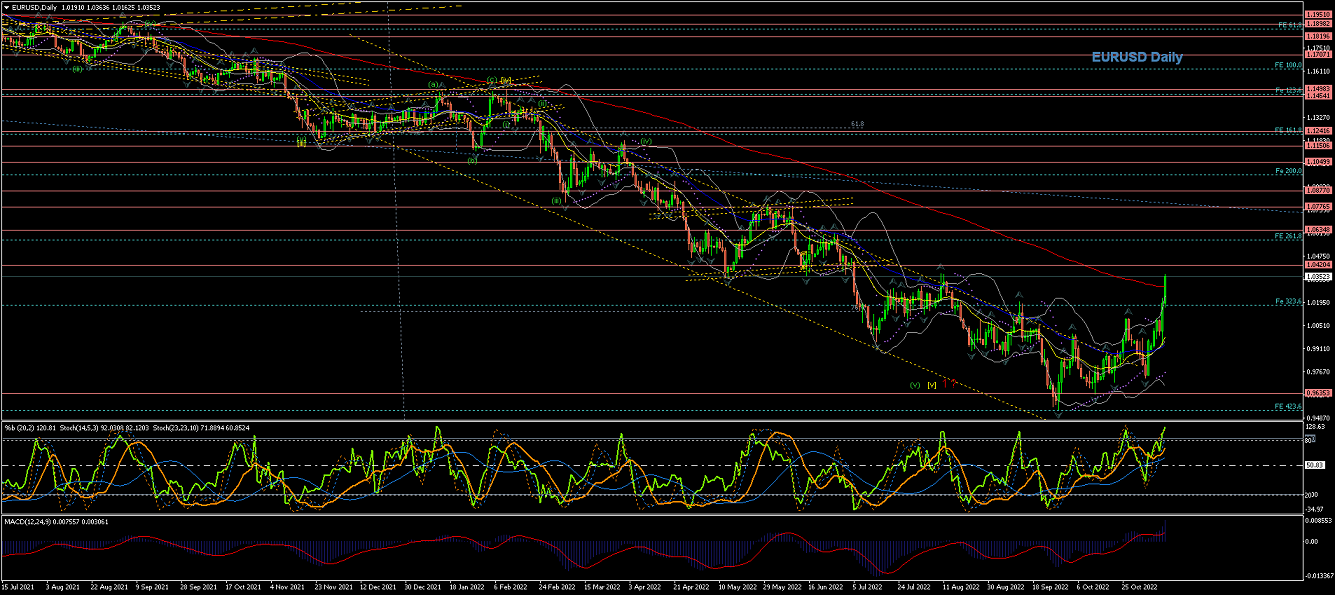
Daily Chart is showing the price has temporally crossed the EMAs for the potential of a new long-term Trend to the downside...
as Waves [i], [ii], [iii] and Wave [iv] are looking completed...
There were further downside moves after Wave [iv] correction...
to continue with Wave [v]... now looking completed, as the price pierces sharply through the 200EMA...
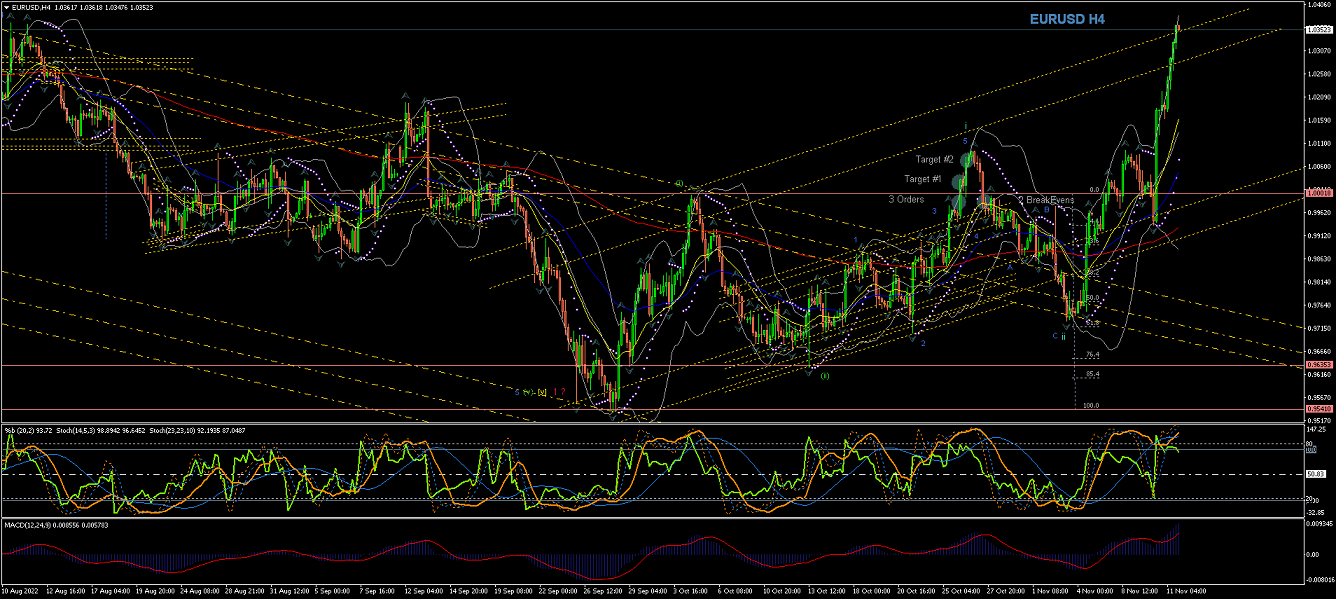
4Hour Chart is showing Wave [v] well developed and completed ...
as the price broke out of the Range to the Upside now... reversing up through the EMAs...
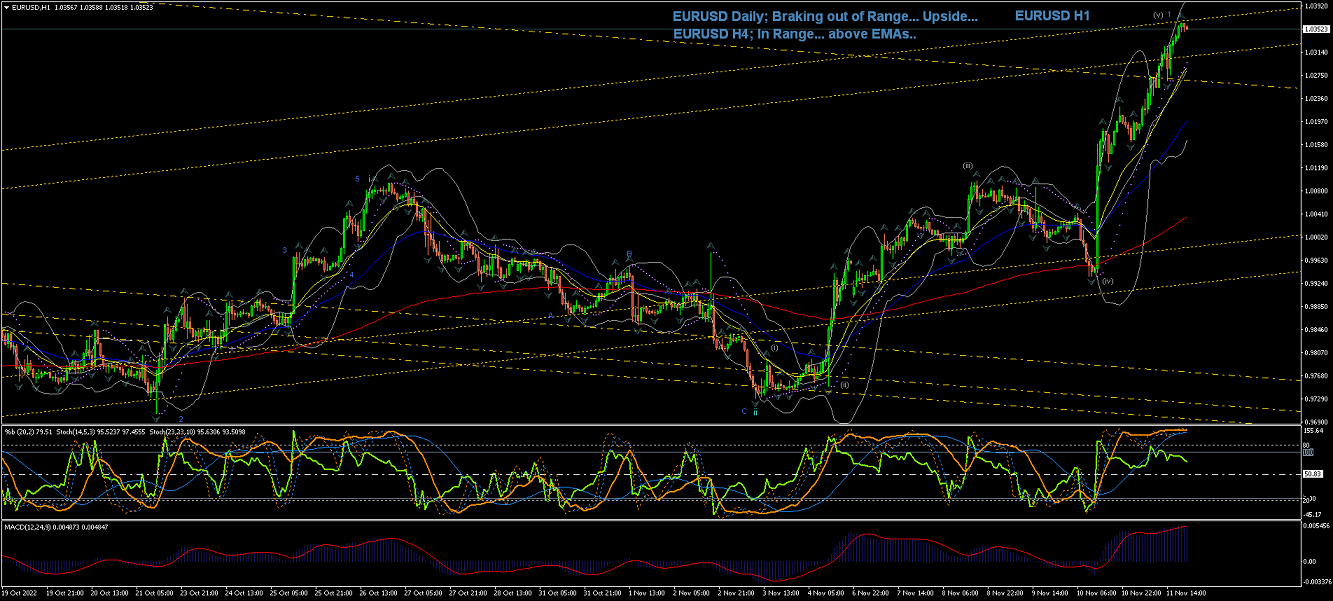
60Min Chart is showing signs of Wave ii completed... ...and Wave 1 (blue) of Wave iii completed within a Range (under current count)...
GBPUSD
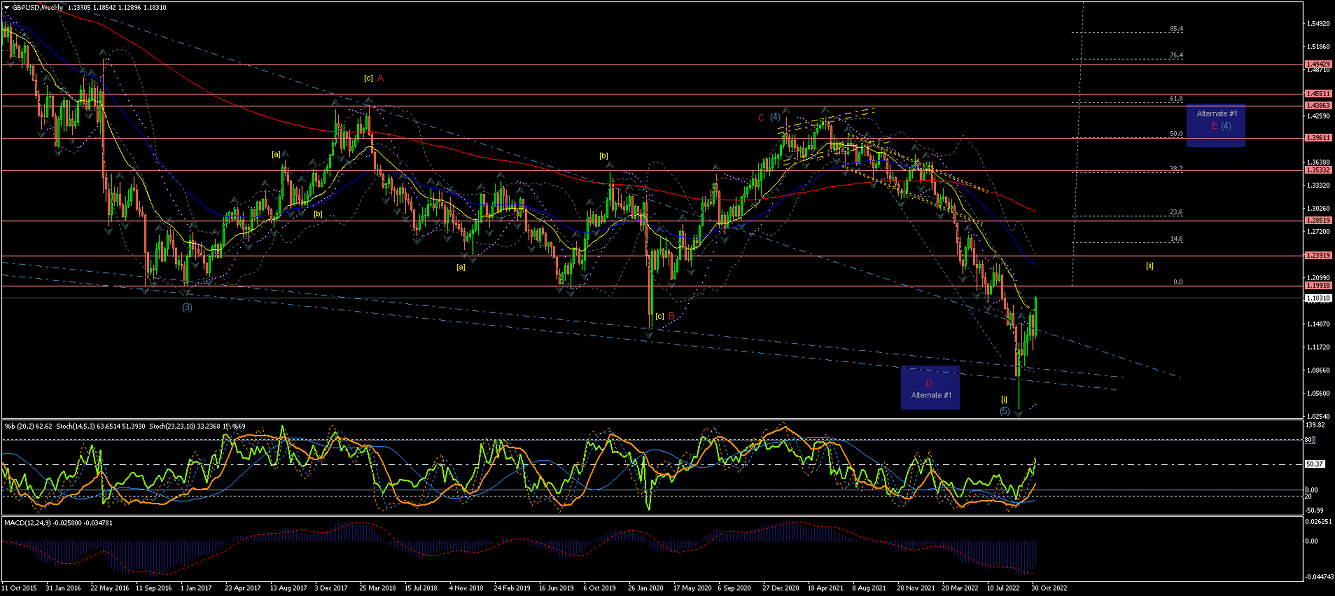
Weekly chart shows an extended Wave (4) correction crossing the EMAs in a rather struggling way...
And now the price has started coming down lower across the EMAs more impulsively to follow Wave (5), as per current count...
The moves look now more impulsive...
as you would expect for Wave (5)...
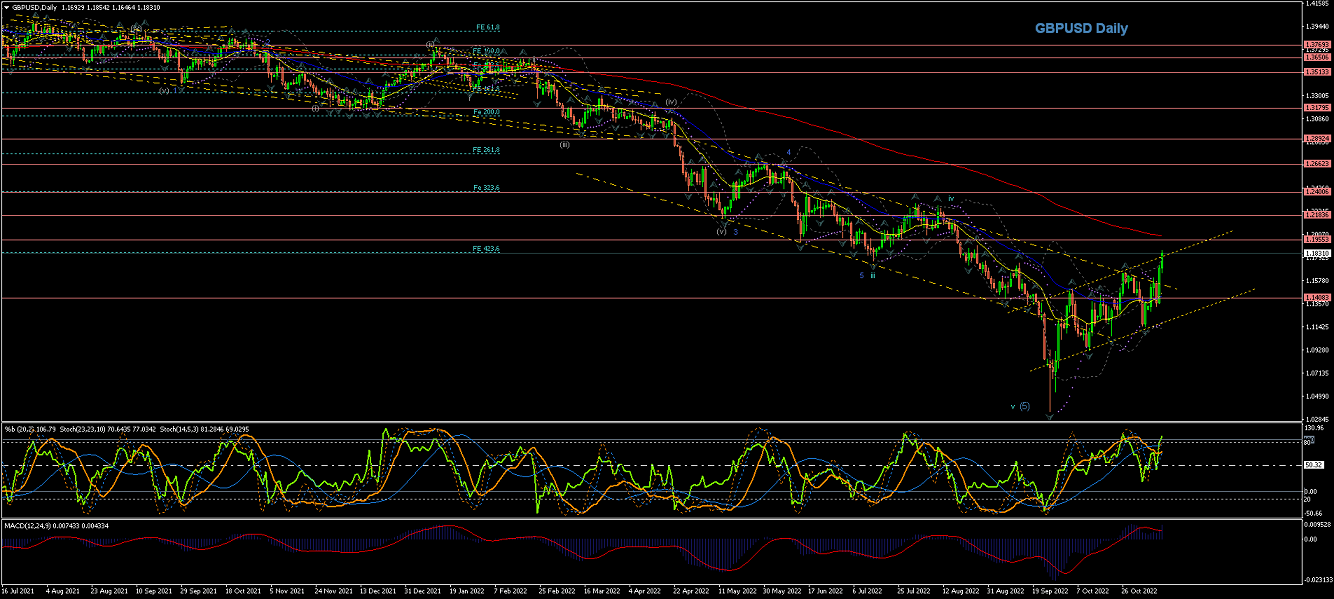
Daily Chart is showing the price completed the breakout of the descending Range formation (yellow) to the downside...
And for this Wave (5) its internal Wave v looks to have come to an end, as the price heads towards the 200EMA...
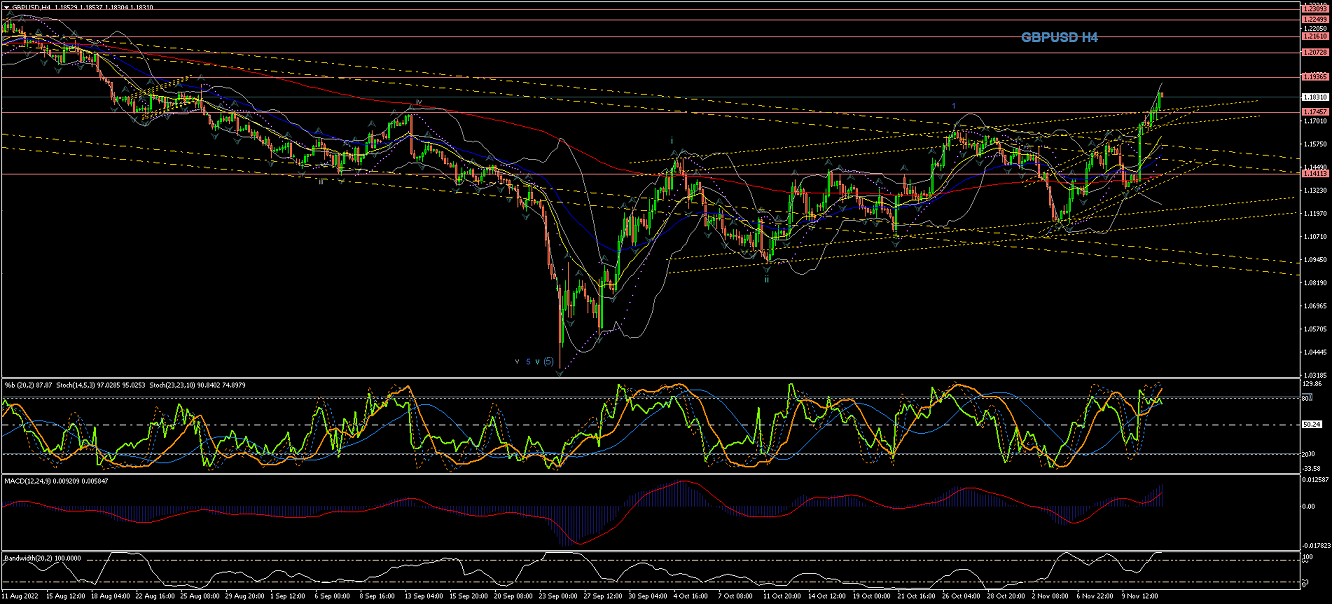
4Hour Chart shows the price raising above the EMAs in a series of Waves 1 and 2... Looking to breakout of the current Ranges; which can bring the price much higher...
60Min Chart is showing the price moving impulsively up... and looking to breakout of the current Ranges... so watch out for the potential of reversal correction to the upside...
All the best for everyone and please do not hesitate to contact me if you have any questions or comments.
Andres
info@tradingwaves.org
Please be aware: that these Analysis are own opinions, not Trading advice; Trading carries a high level of risk, and may not be suitable for all investors. Before deciding to trade you should carefully consider your investment objectives, level of experience, and risk appetite.


 Trading Waves .org