USDJPY
Wave (iii) seems to have started on to what appears to be the first series of waves up on a long term move.
Note that this Wave (iii) will not be confirmed until it breaks through Resistance at previous Wave (i) levels and the alternative count could be an extended Wave (ii).
Although it does not affect the current wave count direction, I have changed the numbering for a more clear and improved wave count.
Please notice that I have added the Weekly Chart also to show more info on the updated count.
60Mins
4Hours
Daily
Weekly
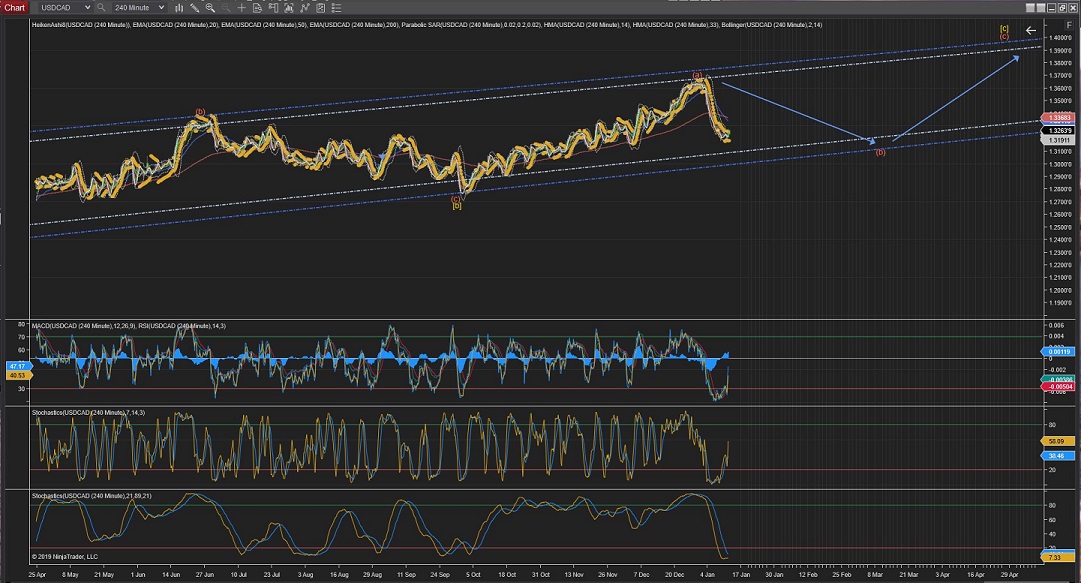
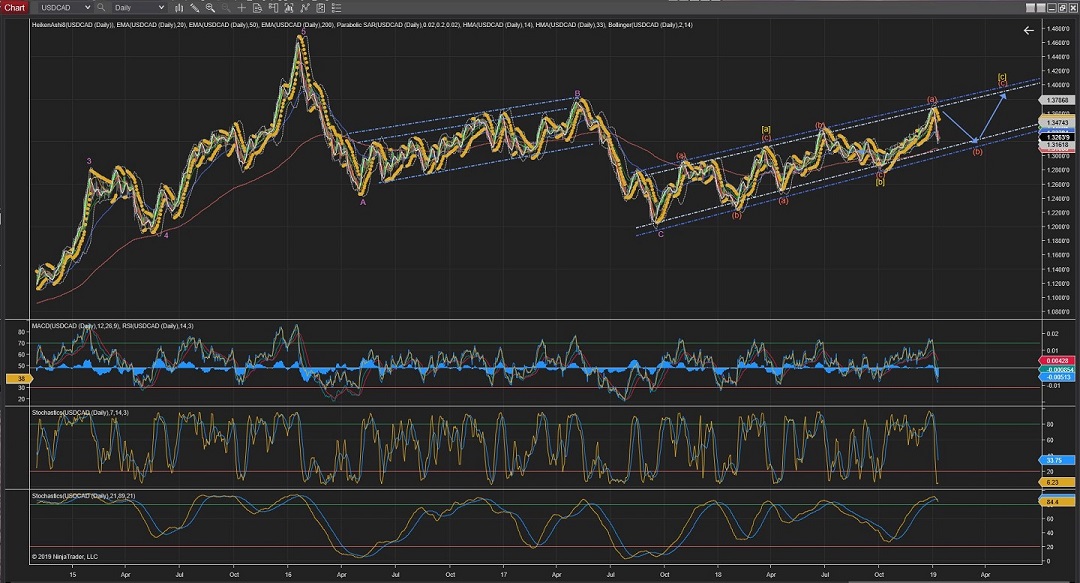
USDCAD
USDCAD has raising towards 200EMA levels on the Hour Chart but soon should carry further down towards the lower Trend levels.
60Mins
4Hours
Daily
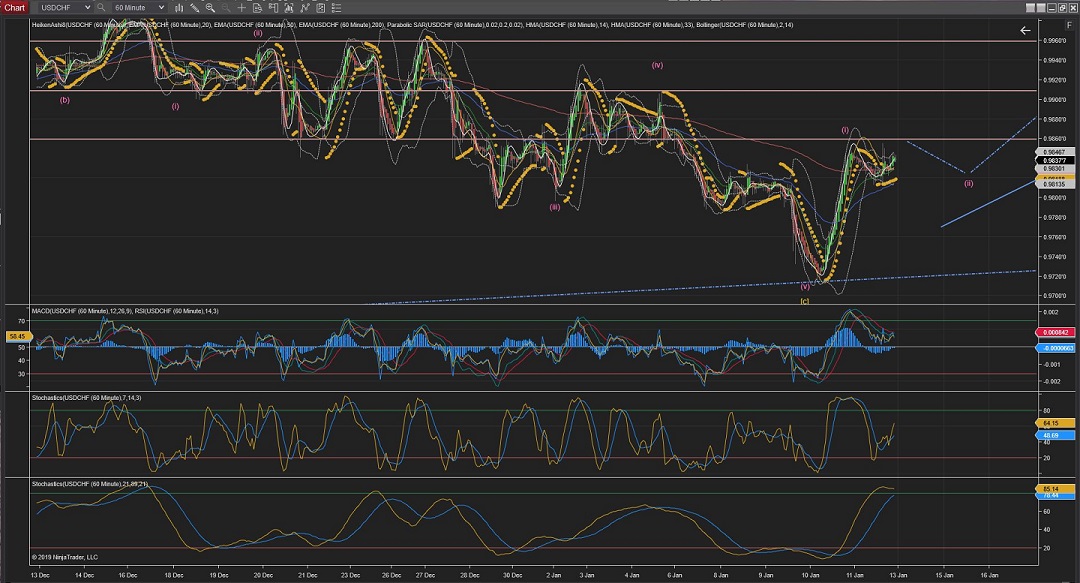
USDCHF
USDCHF has finally made the move up in a very impulsive fashion showing what it looks like the first wave up towards the Upper Trend.
Nest, watch out for a slight correction on a possible Wave [ii].
60Mins
4Hours
Daily
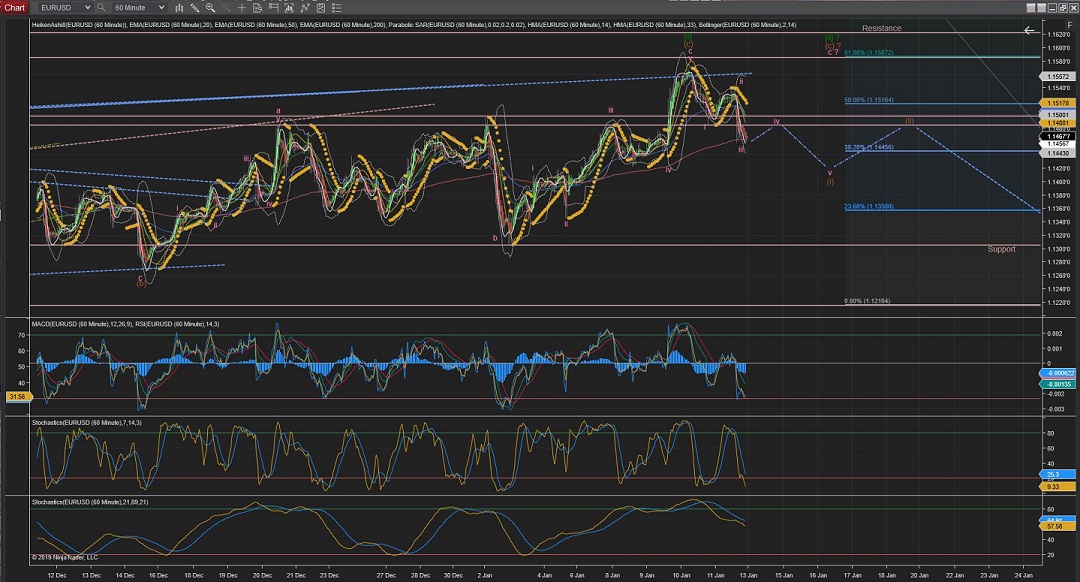
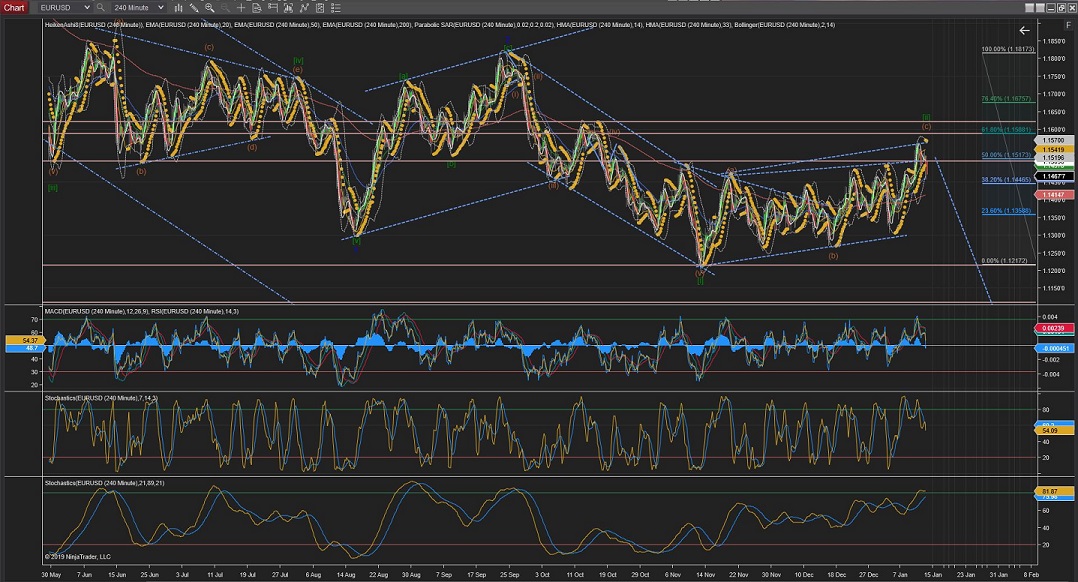
EURUSD
EURUSD appear to have started the long term move down on Wave [iii] with an impulsive Wave (i) down to what appears to be on the Wave iii at the moment.
Although there is still a posibility of being a combinated correction of Wave [ii].
If the 5 waves down are completed in the next session, completing Wave (i), we can then ignore this alternative count and expect Wave (ii) correction before continues the way down on Wave (iii) during next week.
60Mins
4Hours
Daily
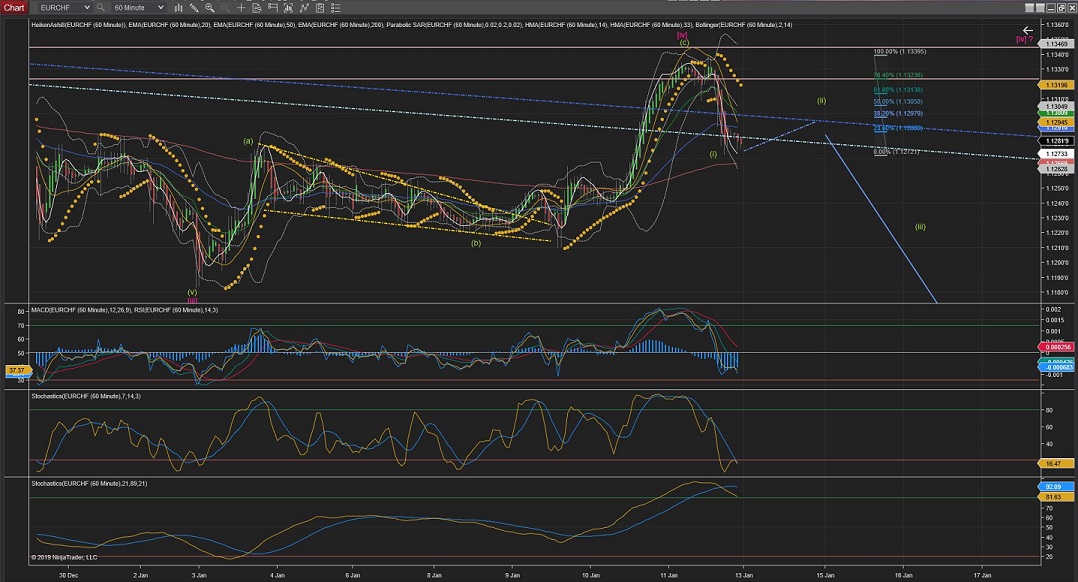
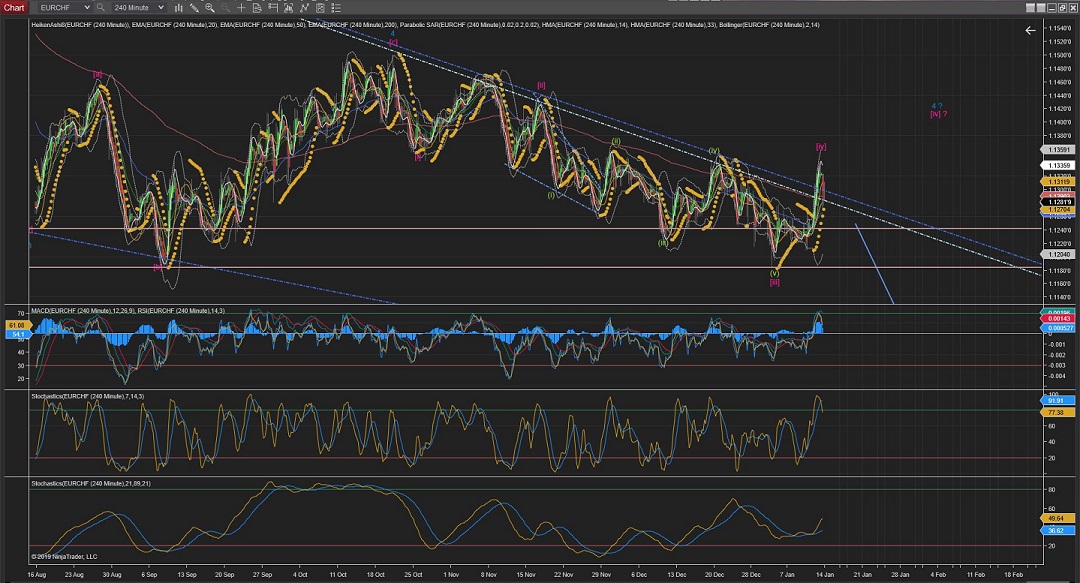
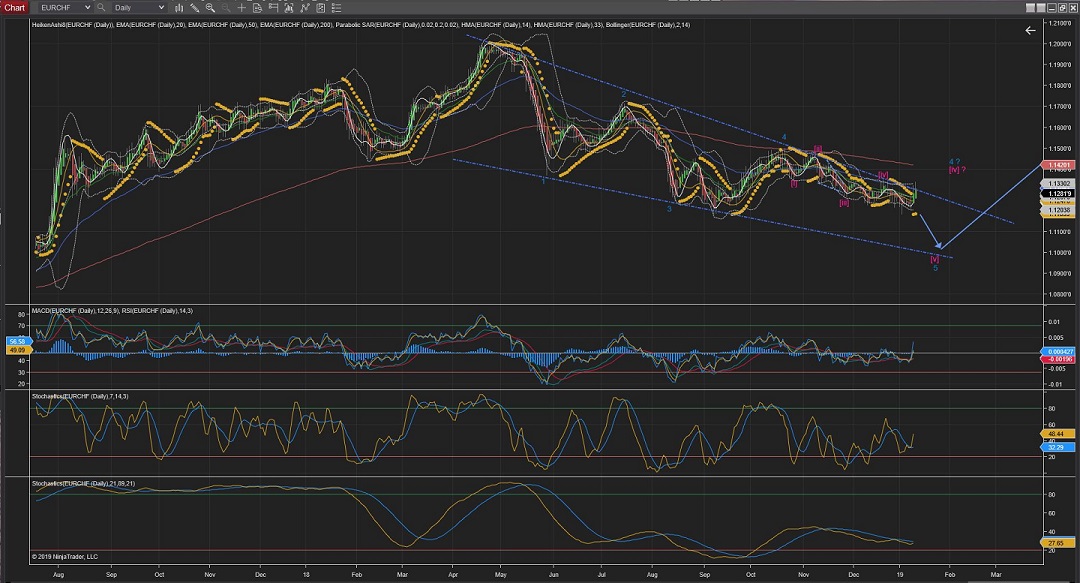
EURCHF
EURCHF has made a very impulsive Wave (i) to the downside crossing the upper Trend levels again to what it seems to be a first Wave towards the lower Trend again.
However, there is also the posibility of an extended Wave 4 (best seen in the Daily Chart), which could extend the price action further up before going down again to complete the Wave 5.
60Mins
4Hours
Daily
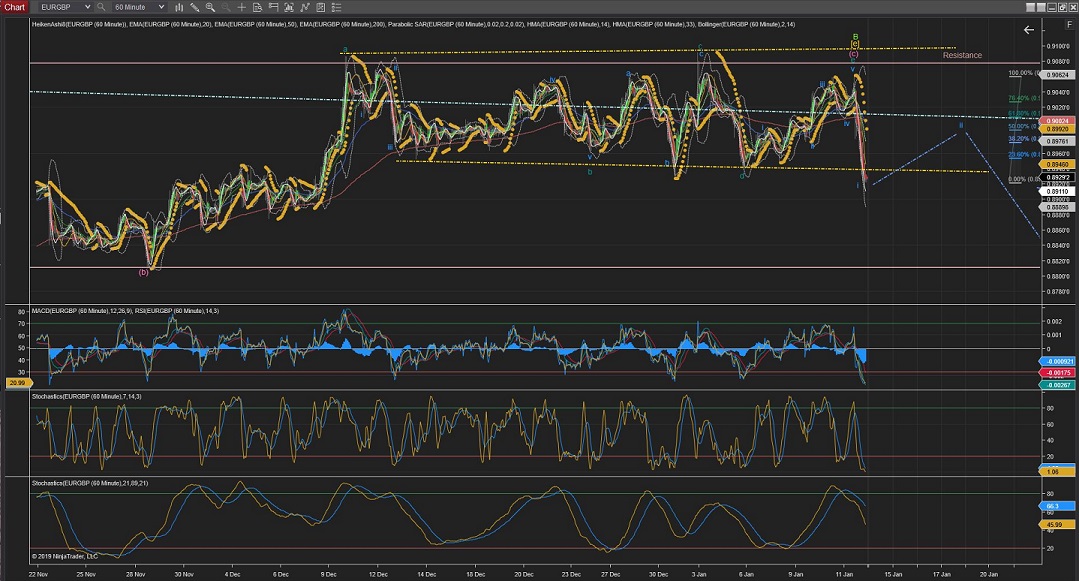
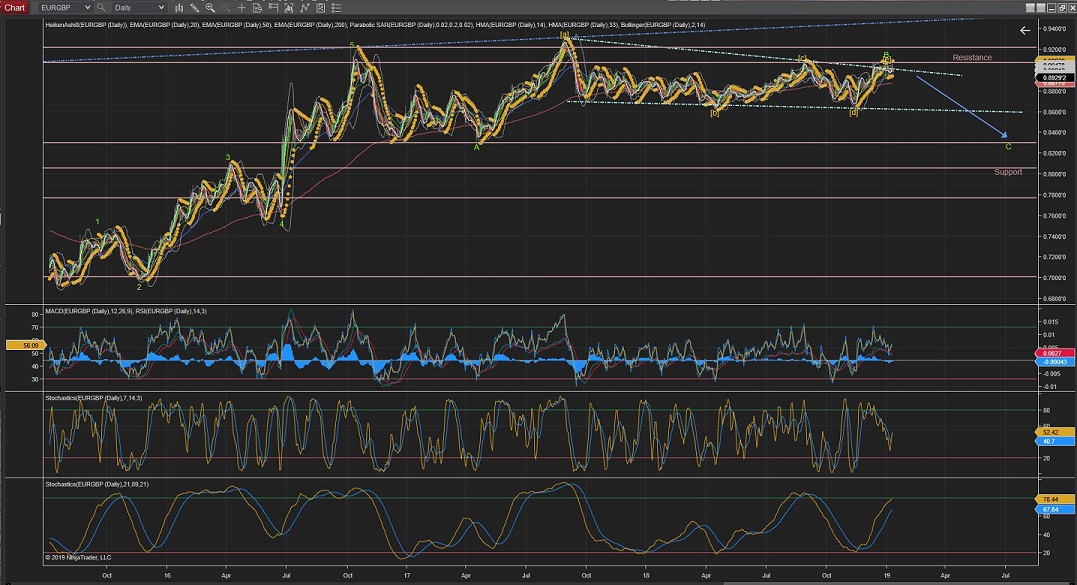
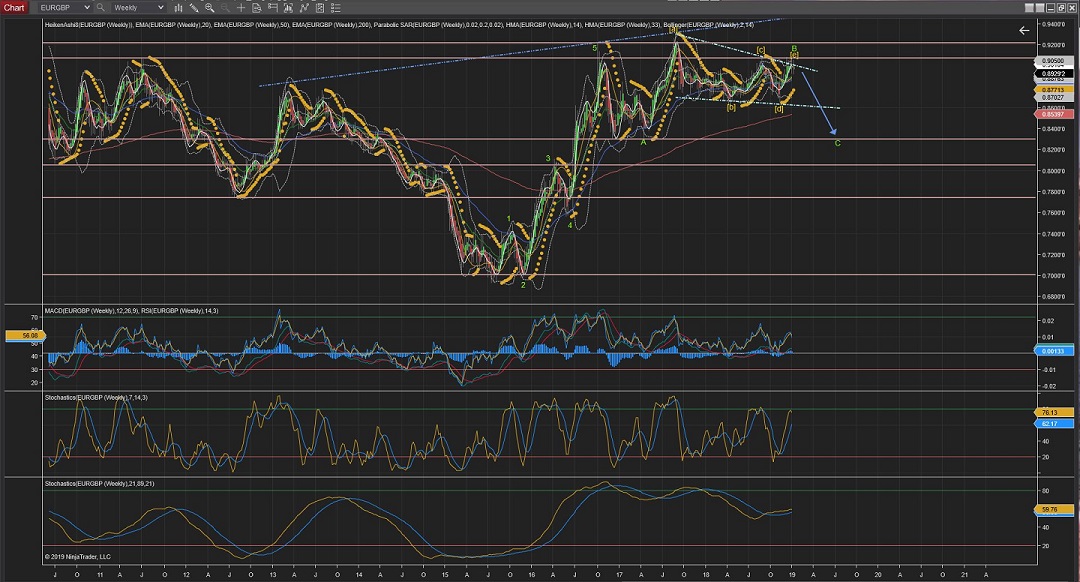
EURGBP
EURGBP failed to touch the upper smaller trend and made an impulsive move to the downside to what might well be the start of the Wave C (best seen on the Daily and Weekly Charts).
It has now finished Wave i and I would expect a small correction in Wave ii before carrying on with another impulsive Wave iii to the downside.
Please notice the Weekly Chart to clarify current long term count.
60Mins
4Hours
Daily
Weekly
GBPUSD
I have updated the GBPUSD 4Hour/Daily charts to show the alternative count showing an extended possible correction for Wave 2.
However, I am still sticking to the current count for the time being.
On the Hourly chart it seems like the Wave v is about to be completed, which would mean a trend change towards the downside.
My expentancy still is that early next week we should see GBPUSD starting the series of waves down to develop Wave [iii]. (which coincidentally would be at the same time as the last of Brexit parlamentary talks/negotiations...)
60Mins
4Hours
Daily
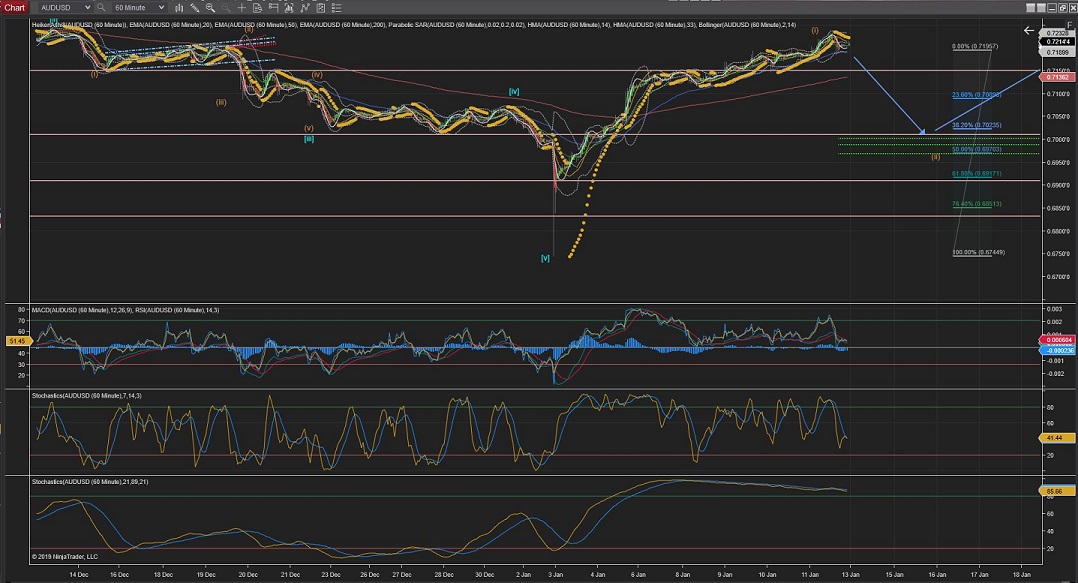
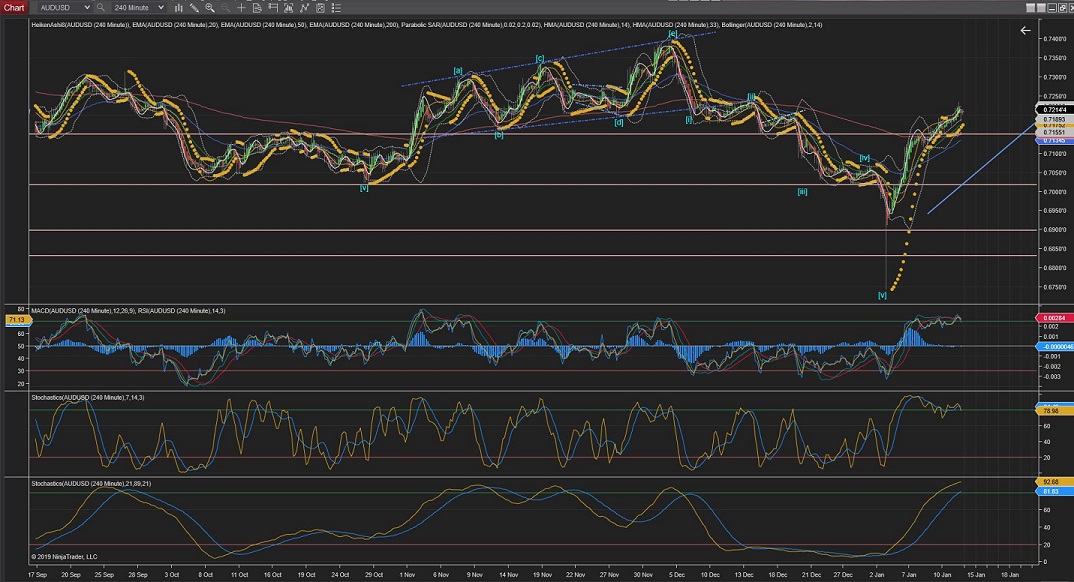
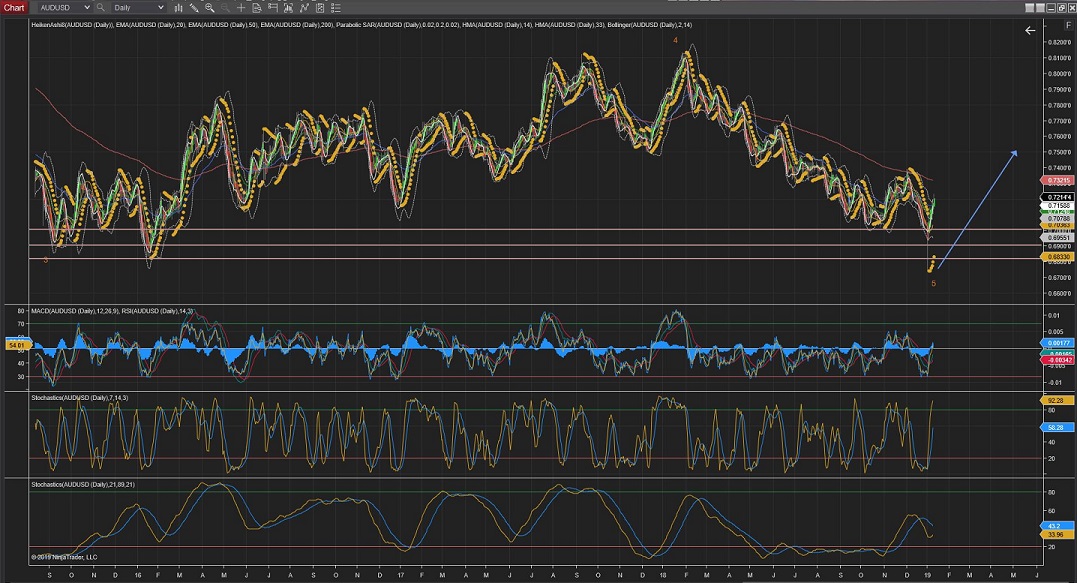
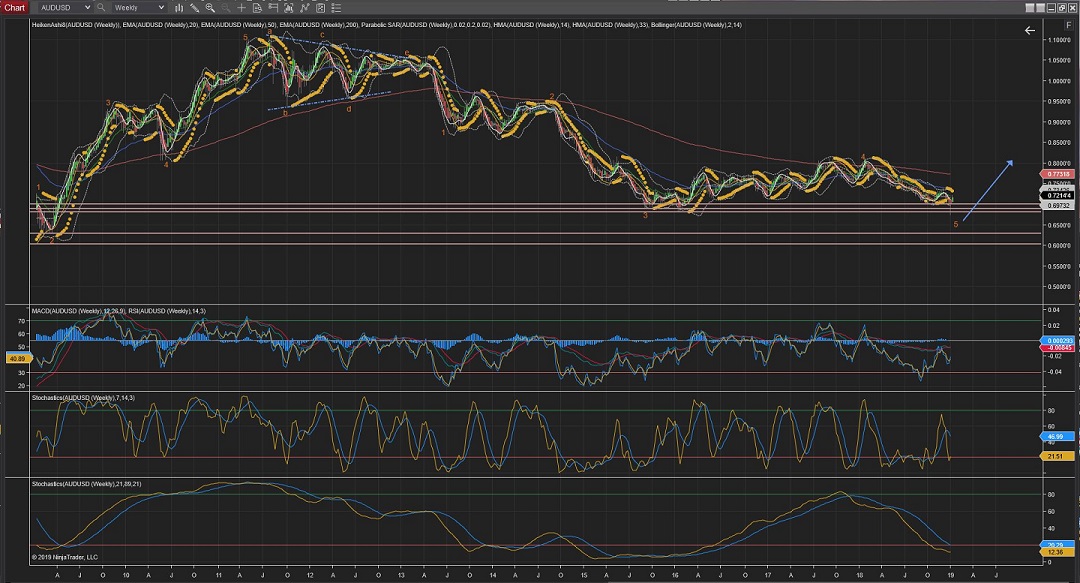
AUDUSD
Nothing much has changed for AUDUSD as it is steadily moving up in a very slow motion and there is still not much price action so I will stick to the original Wave structure where Wave (i) is still underway and Wave (ii) should follow towards Fib retracement levels.
60Mins
4Hours
Daily
Weekly


 Trading Waves .org