Fri 04-02-2022
Hi everyone, hope you are all great.
So... Let's get into it...
USDJPY
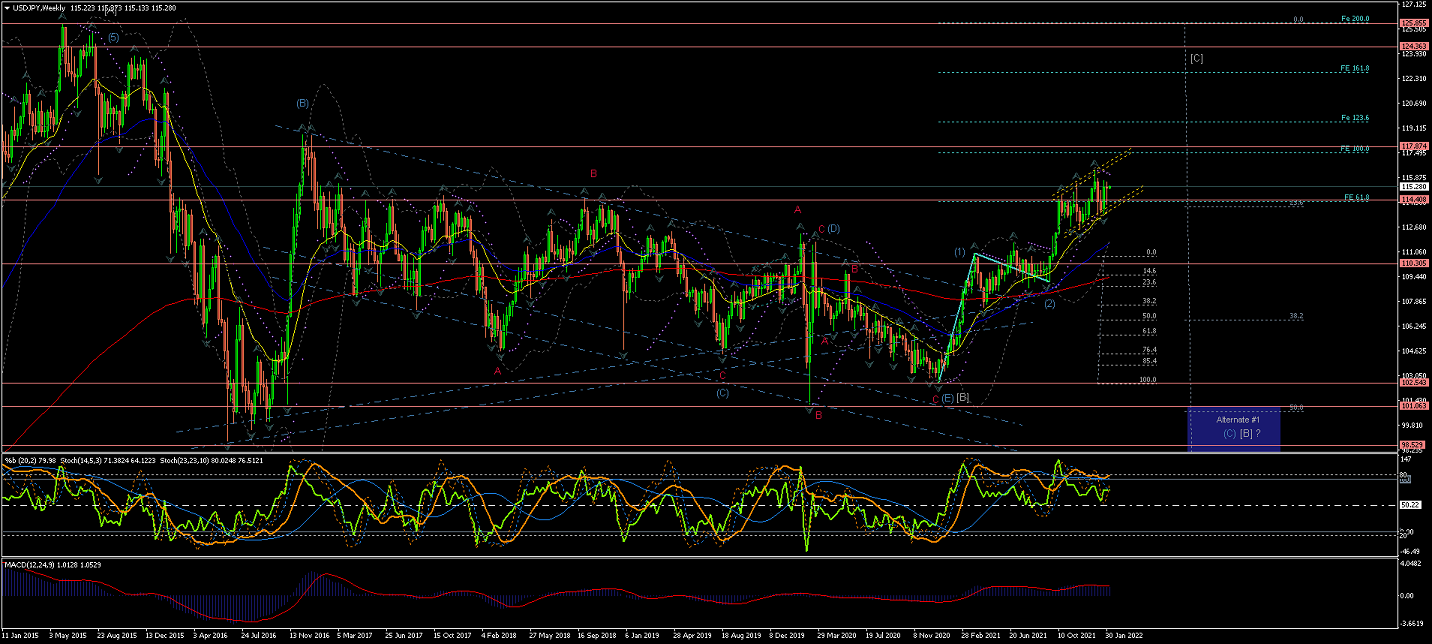
Weekly Chart is showing Wave (1) could be completed now that the price has crossed the upper long-term trendline...
A rise from the lower trend line, after the this long-term correction, under the current count,
suggests the beginning of the start of Wave (1) of a long-term raise.
And now, after a short corrective Wave (2), the price is looking to continue on Wave (3)...
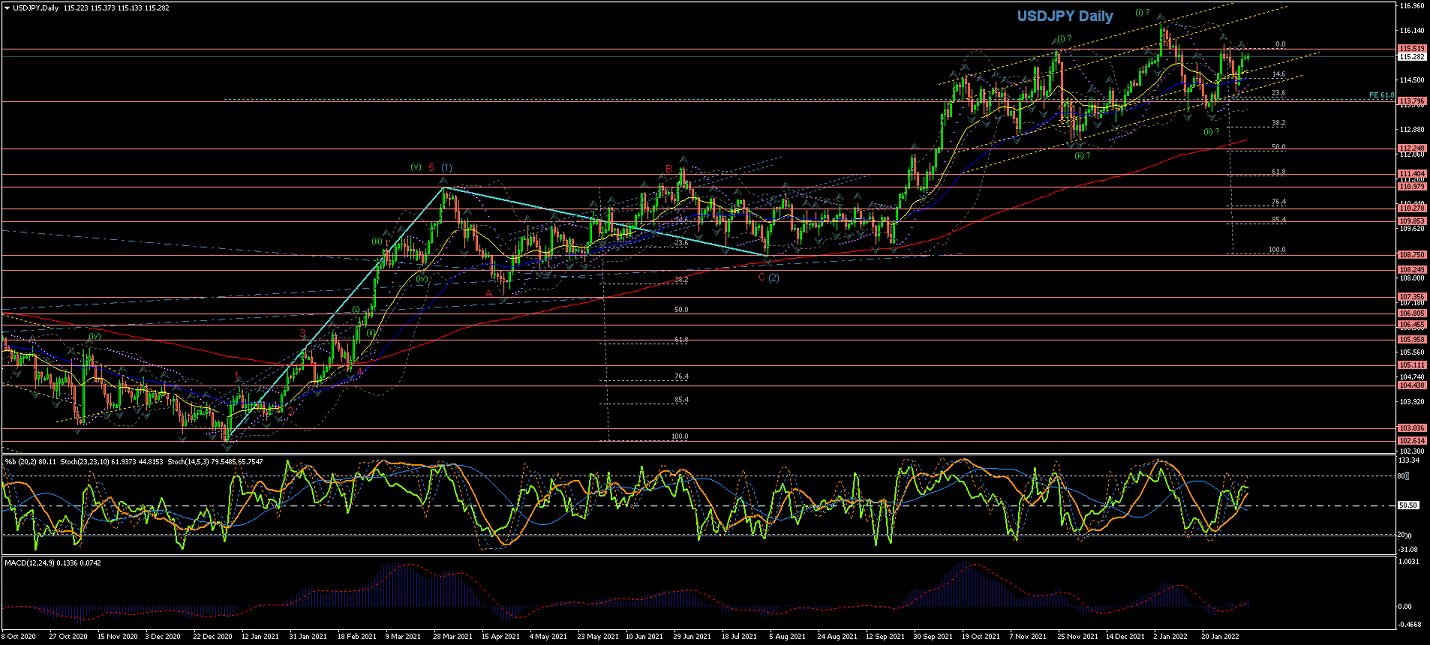
Daily Chart is showing Wave (1) completed... then Wave (2) completed a correction up to the %38 retracement of Wave (1)...
and now the price raising above the highest point of Wave (1), suggesting Wave (3) underway, with its internal Wave (i) likely completed... and Wave (ii) possibly underway... unless Wave (iii) is already on the way... time will give clarity on to this count...
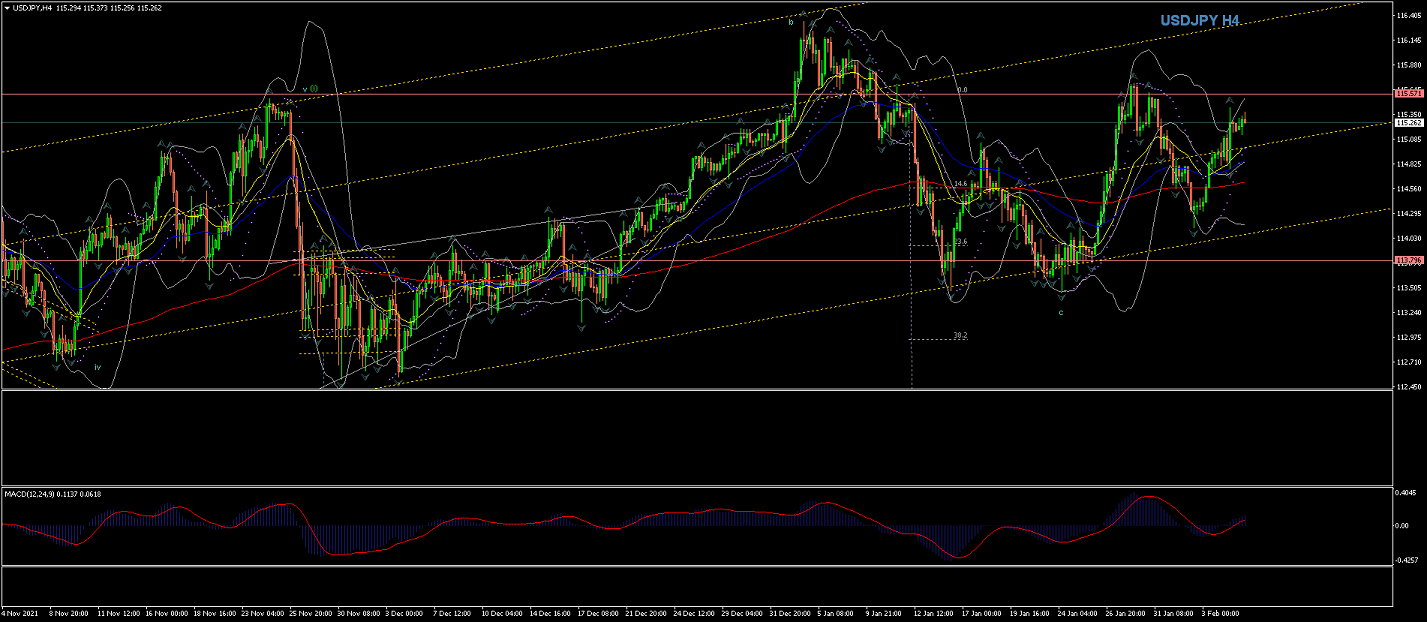
4Hour Chart is showing Wave (ii) possibly completed within the current Range...
(at the %38 retracement...)
Lets see this Range's breakout direction to confirm count, as mentioned in the 4hr Chart analysis...
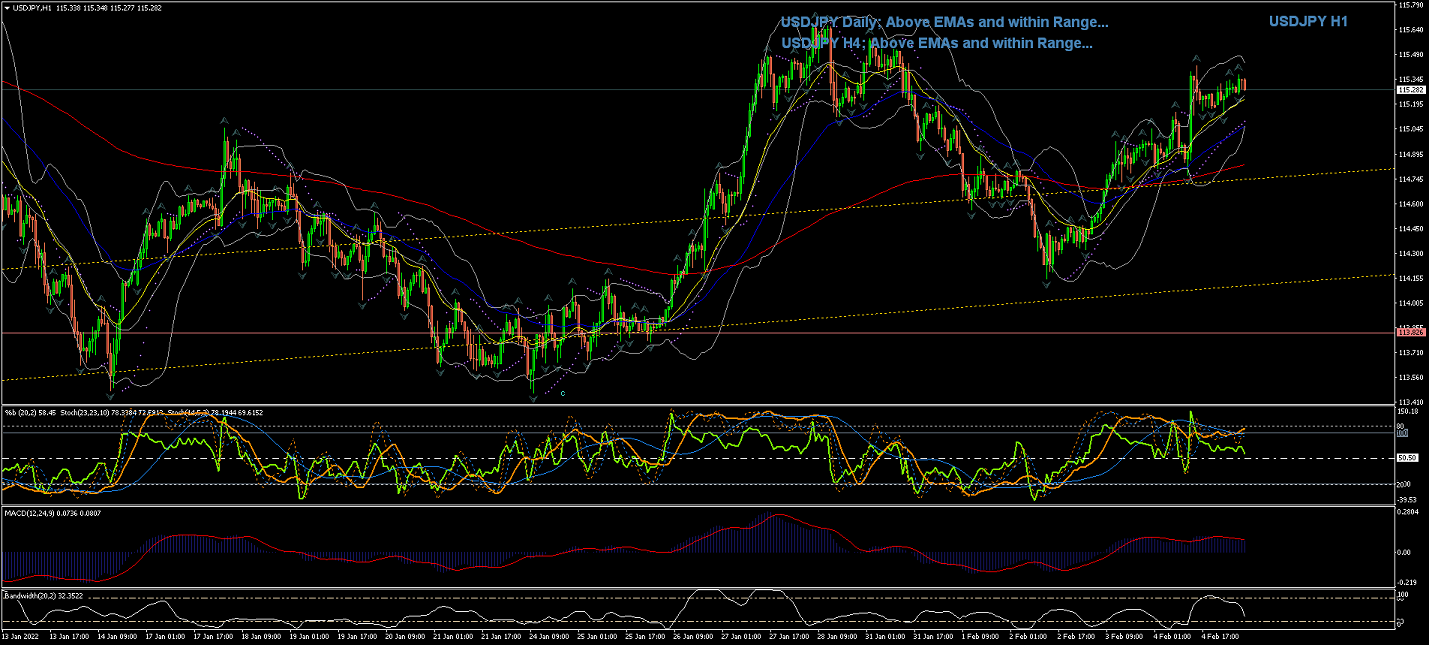
60Min Chart shows the price still within the Range and possibly completed Wave c of Wave (ii)...
EURUSD
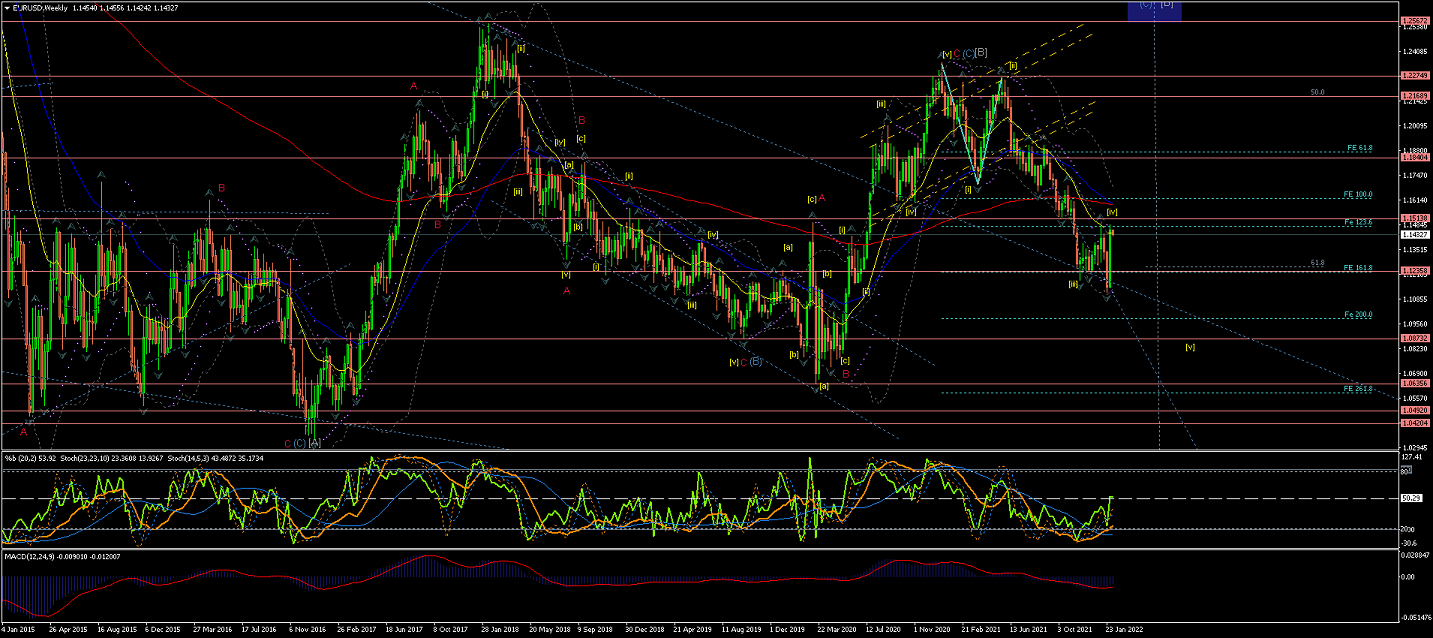
Weekly Chart is showing an extended Wave C(red) of Wave (C) of Wave [B] now showing to be completed...
And also showing signs of the price reverting into a down Trend as it headed down impulsively across the EMAs,
after a sharp corrective Wave [ii]...
Notice how the price has confirmed Wave [iii] as it has crossed the lowest of Wave [i] and reached its 161.8 extension...
Current reaction to the long-term Trendline(blue) should be something interesting to watch for... and should form Wave [iv] correction...
And the price looks to be piercing through the long-term Trendline(blue) to continue with Wave [v]...
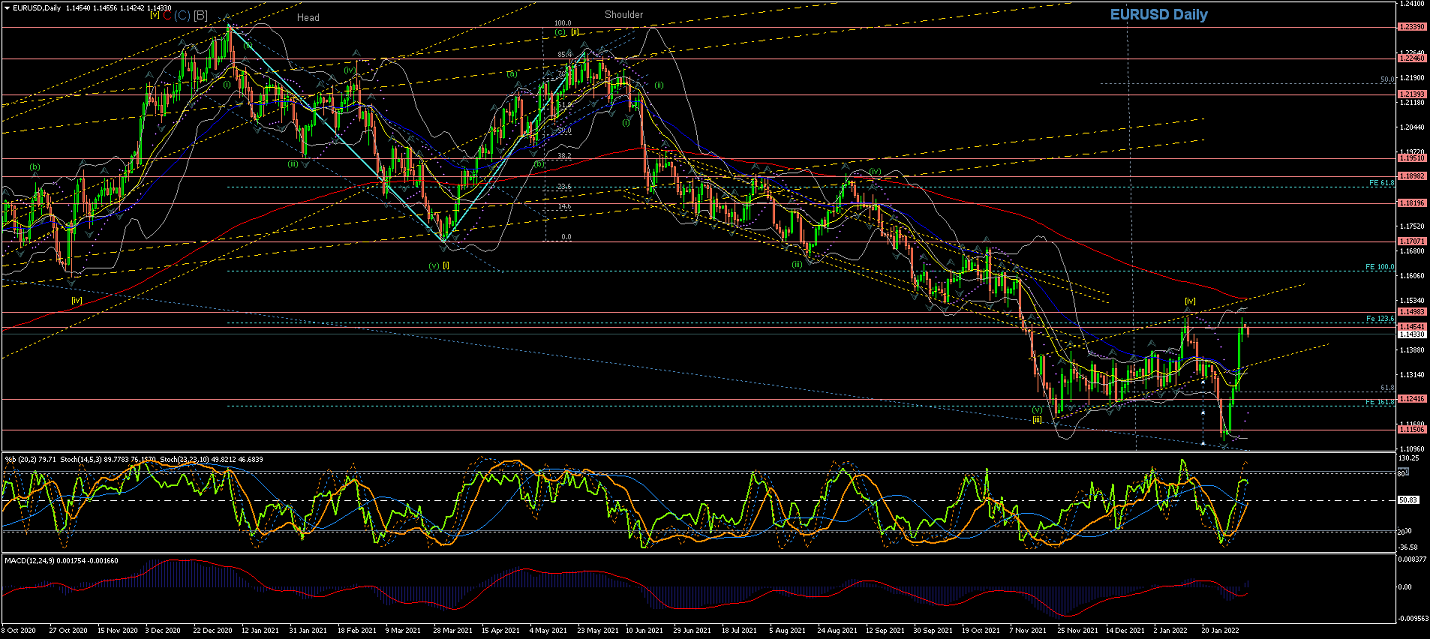
Daily Chart; Since Wave C(red) was completed, the price has temporally crossed the 200EMA and lower Trendline for the potential of a new long-term Trend to the downside...
as Wave [i] and Wave [ii] are looking completed...
Wave [iii] seems to have made strong impulsive moves...
We were expecting further downside moves after corrective Wave [iv] is completed... and that is likely what is happening now... Wave [v] is on??
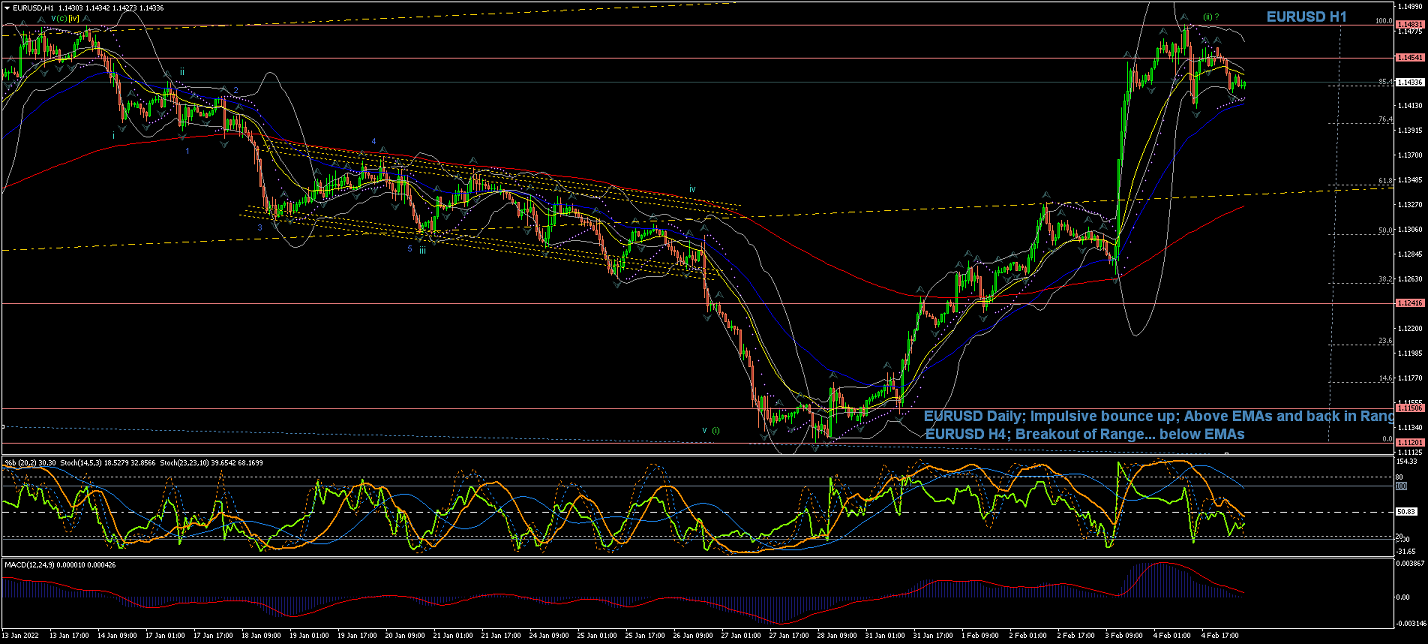
4Hour Chart is showing Wave (v) has completed Wave [iii]...
Then Wave [iv] brought the price up and sideways in a corrective fashion...
And now Wave [v] developing as the price broke out of the Range to the downside... although its internal Wave (ii) reached the 0 retracement of Wave (i), almost invalidating the current count...
60Min Chart is showing the price back into the Range for a sharp Wave (ii) that has touched the 100% retracement of Wave (i), almost invalildating this short term count....
Let's wait to see where the price goes next to confirm whether this count remains valid and confirms Wave (iii) on the way...
GBPUSD
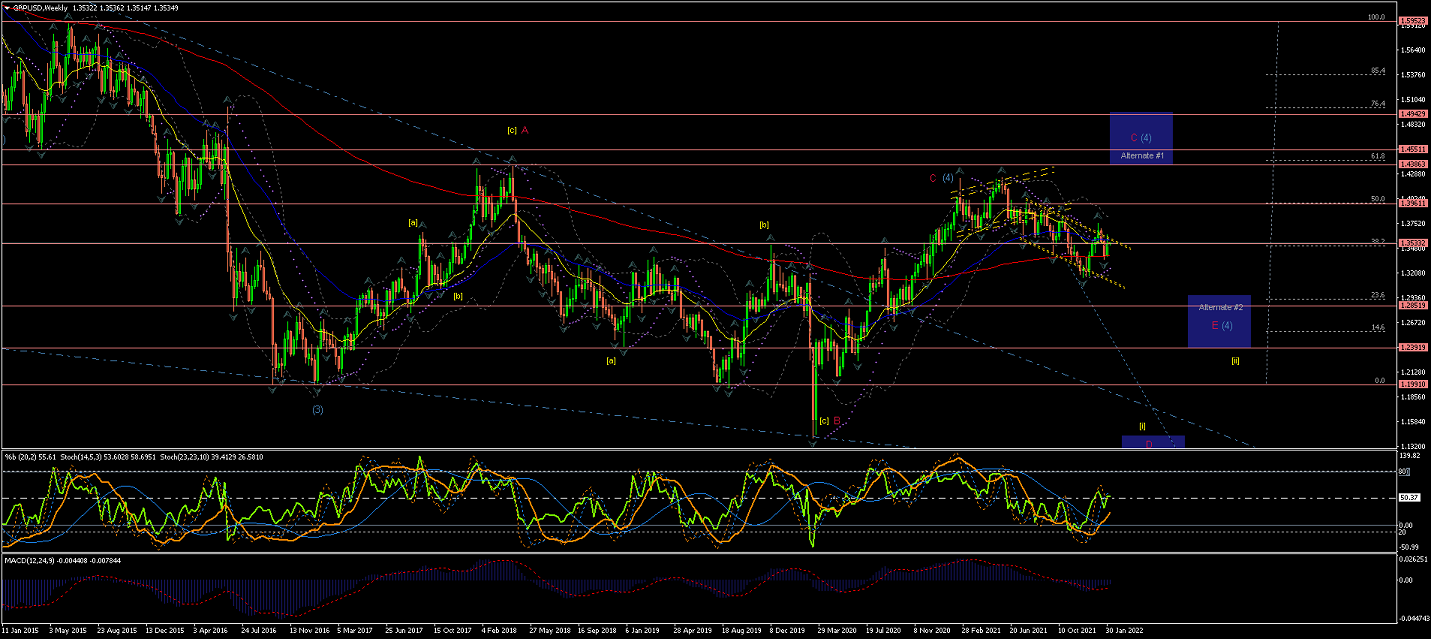
Weekly chart shows an extended Wave (4) correction crossing the EMAs in a rather struggling way...
Although the price has started coming down lower to follow Wave (5), as per current count...
Regardless of the direction, the moves still look weak and corrective... and for Wave (5) I would expect rather more impulsive moves to the downside...
(Note Alternate #1 for a possible larger Wave (4) developing...).
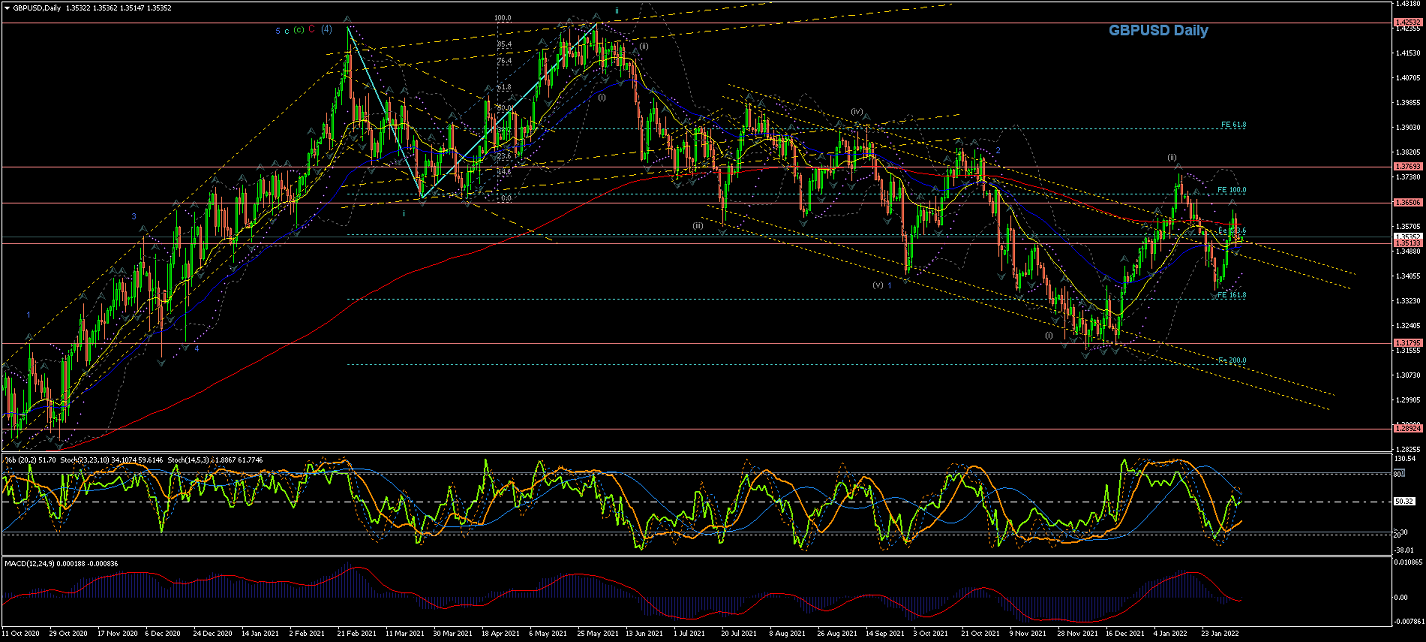
Daily Chart is showing the Wave C(red) completing Wave (4)...
Next, if this count is correct, we should expect the price to continue the moves down impulsively for Wave (5)...
so for the current count to work the price still needs to complete the breakout of the now descending Range formation (yellow) to the downside...
And for this Wave (5) there could be a series of Waves 1 -2 forming to the downside...
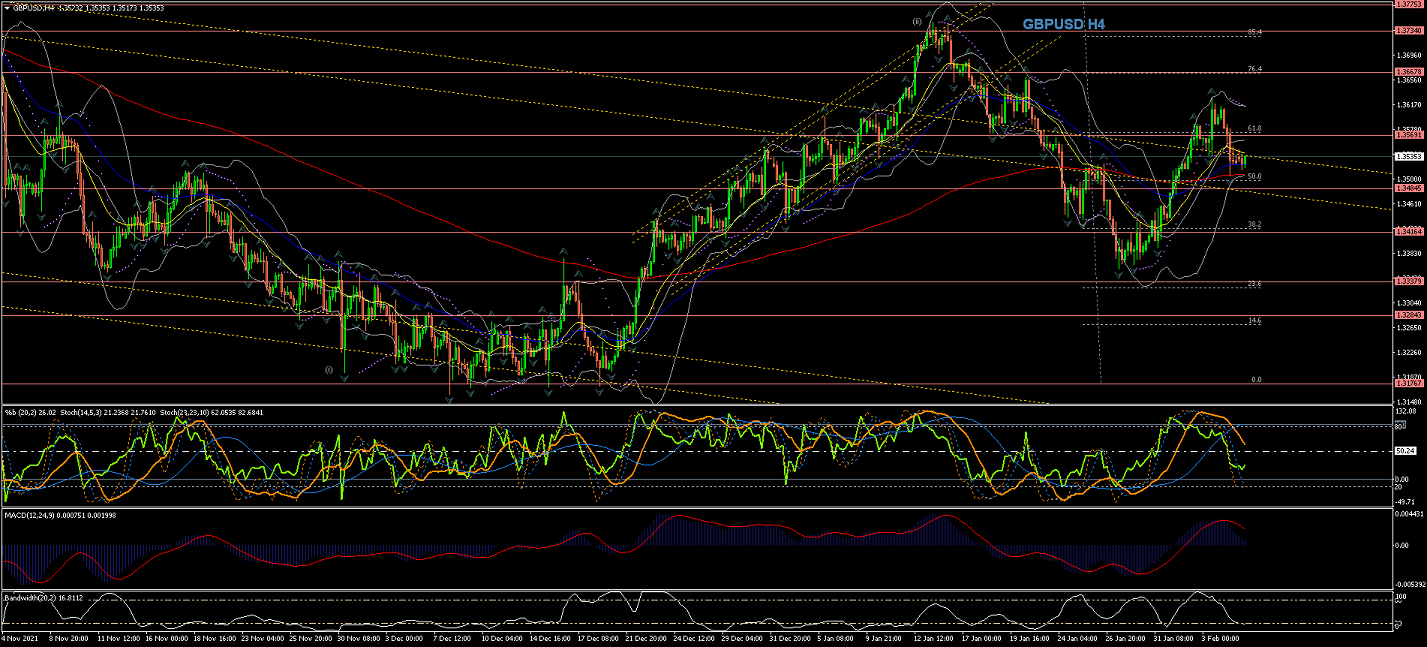
4Hour Chart shows the price broke out of the current Range, which triggered an alternate count which I marked as now forming Waves (i) and (ii) of Wave 3(blue)... best seen in the Daily Chart...
Current Wave (ii) has reached the %85 retracement of its Wave (i) so, if this count is to remain valid, we should expect moves to the downside... otherwise I will have to revise more longer term counts...
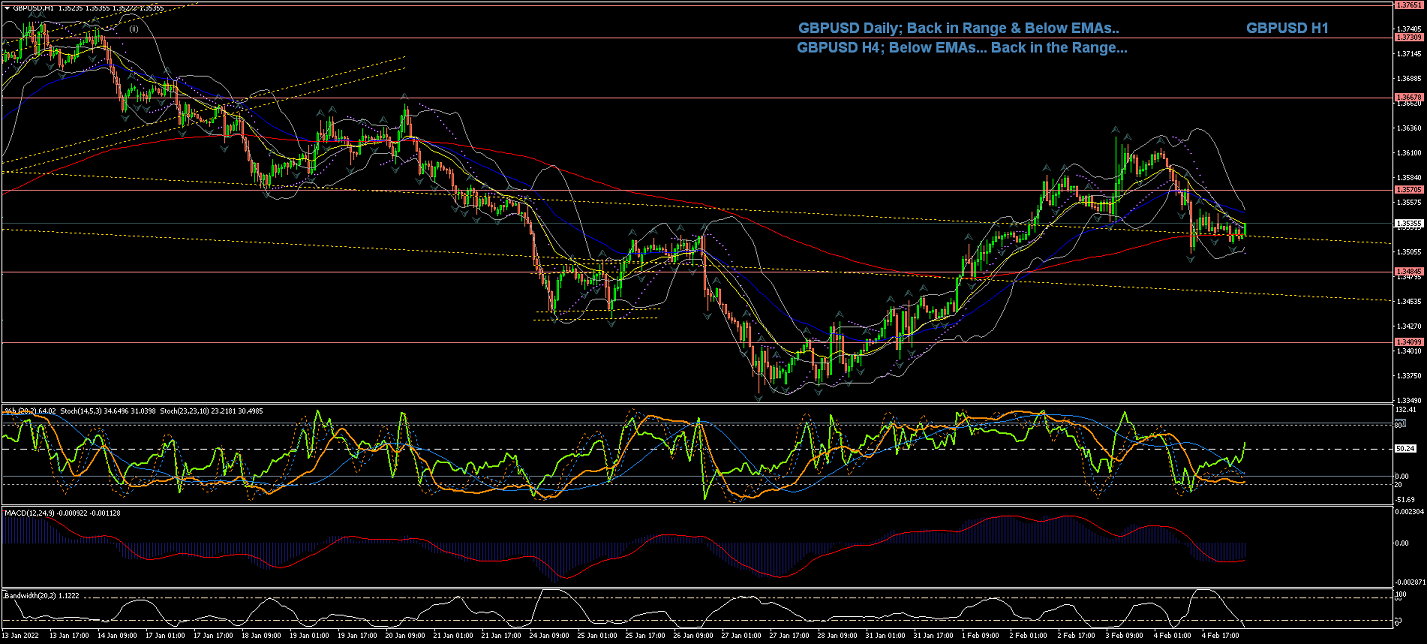
60Min Chart is showing the price moving steadily up within an Ascending Range... watchout for its breakout (to the downside for the current count to work)
All the best for everyone and please do not hesitate to contact me if you have any questions or comments.
Andres
info@tradingwaves.org
Please be aware: that these Analysis are own opinions, not Trading advice; Trading carries a high level of risk, and may not be suitable for all investors. Before deciding to trade you should carefully consider your investment objectives, level of experience, and risk appetite.

 Trading Waves .org