Fri 21-01-2022
Hi everyone, hope you are all great.
So... Let's get into it...
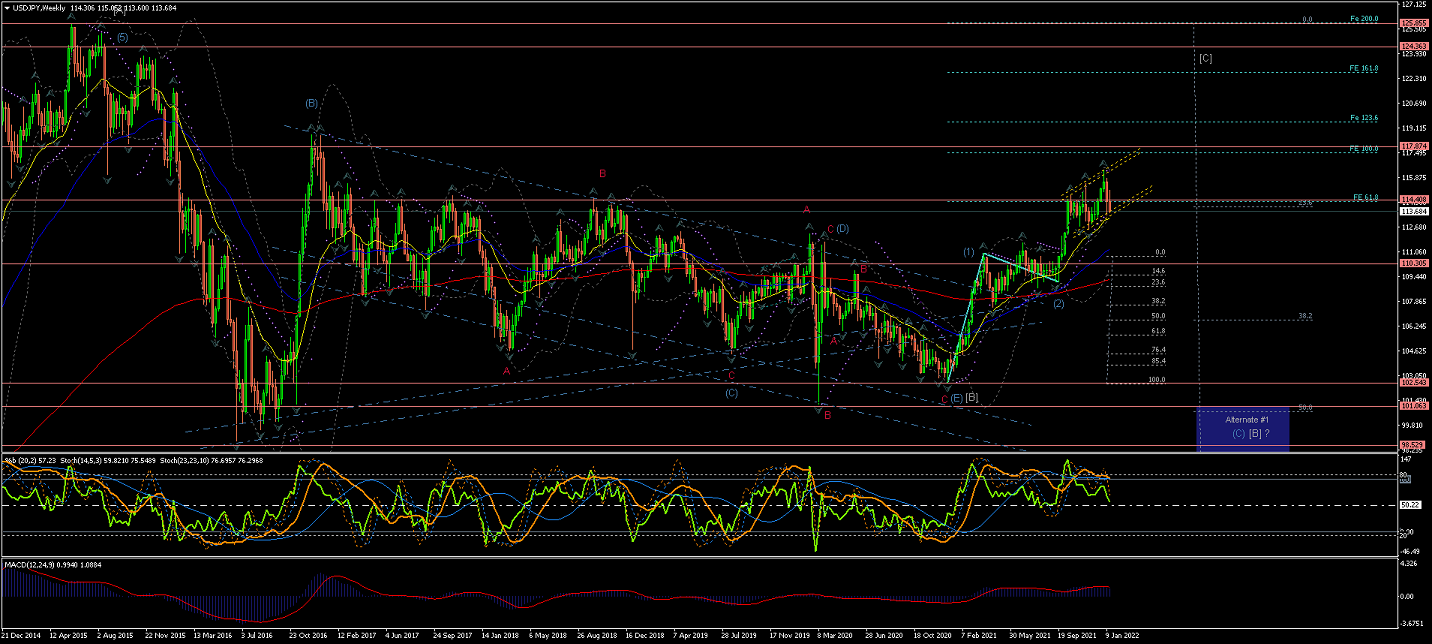
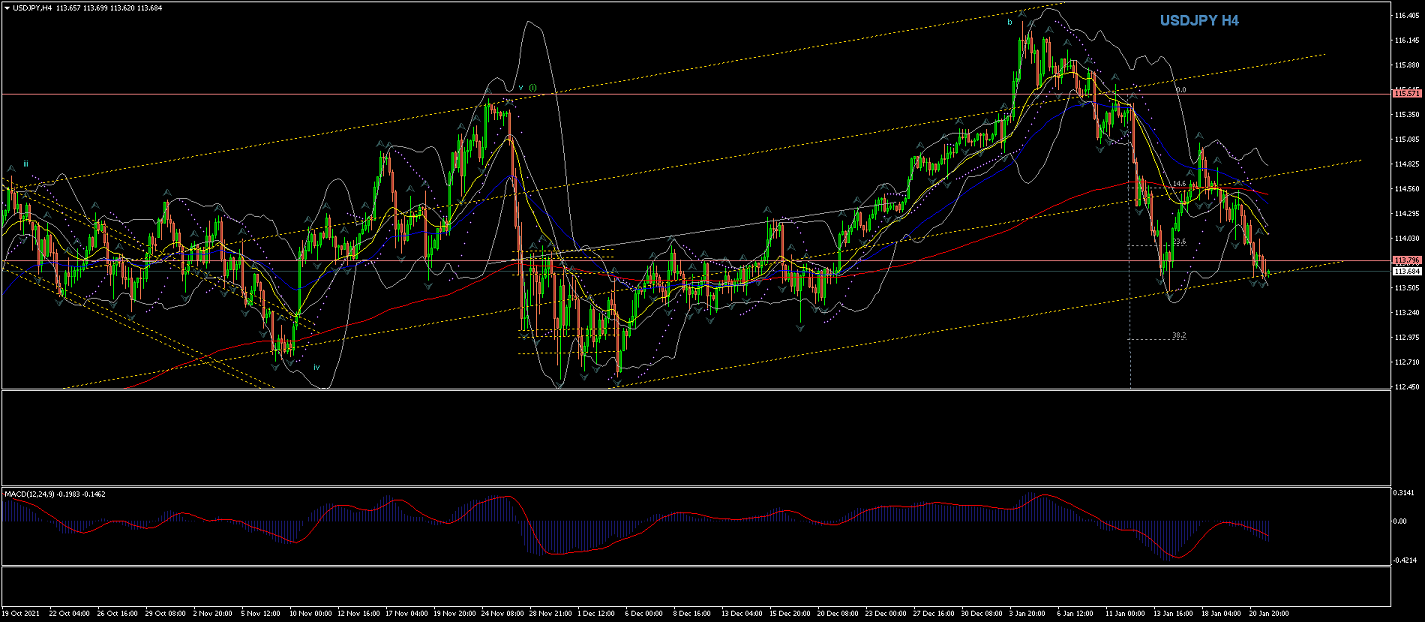
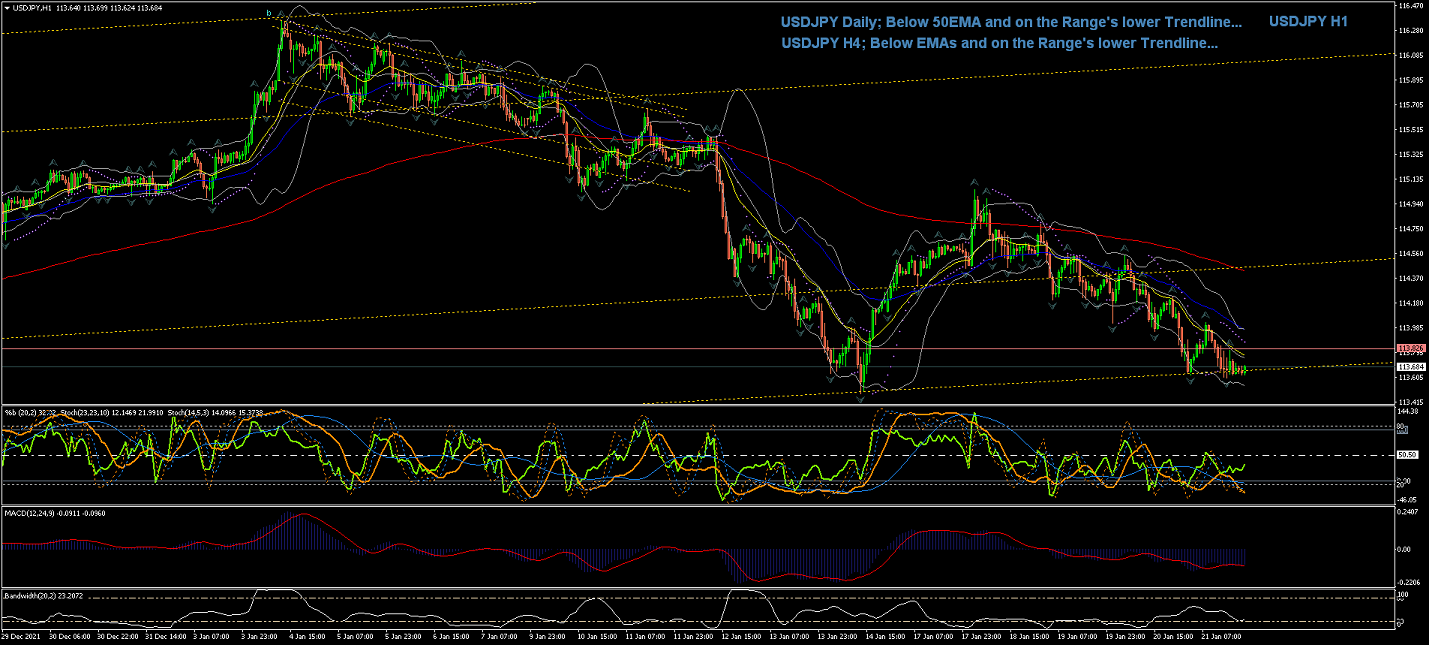
USDJPY
Weekly Chart is showing Wave (1) could be completed now that the price has crossed the upper long-term trendline...
A rise from the lower trend line, after the this long-term correction, under the current count,
suggests the beginning of the start of Wave (1) of a long-term raise.
(Price re-entering the long-term Range and subsequent drop across the %50 retracement would favor Alternate #1 count for an extended Wave (C) of Wave [B] correction towards the %62)
Daily Chart is showing Wave (1) completed... (and the EMAs impulsively after nearly a year)...
Wave (2) has already hit the %38 retracement of Wave (1)...
and then the price raised above the highest point of Wave (1), suggesting Wave (3) underway, with its internal Wave (i) likely completed... and Wave (ii) underway...
4Hour Chart is showing the latest 5 impulsive waves up, which I marked as Waves i, ii, iii, iv & v
completed Wave (i) at the top Trendline of the newly-formed Range...
That hints Wave (ii) underway for corrective moves down...
so, under the current count, we should expect a Breakout of the current Range to the Downside to complete Wave c of Wave (ii)...
(unles Wave (ii) has already been completed at the %38 retracement...)
60Min Chart shows the price still within the Range and completed Wave b of Wave (ii)...
So, if this count continues to be correct, watch out for further corrective moves to the downside... to continue the current correction with Wave c to finally complete current count's Wave (ii)...
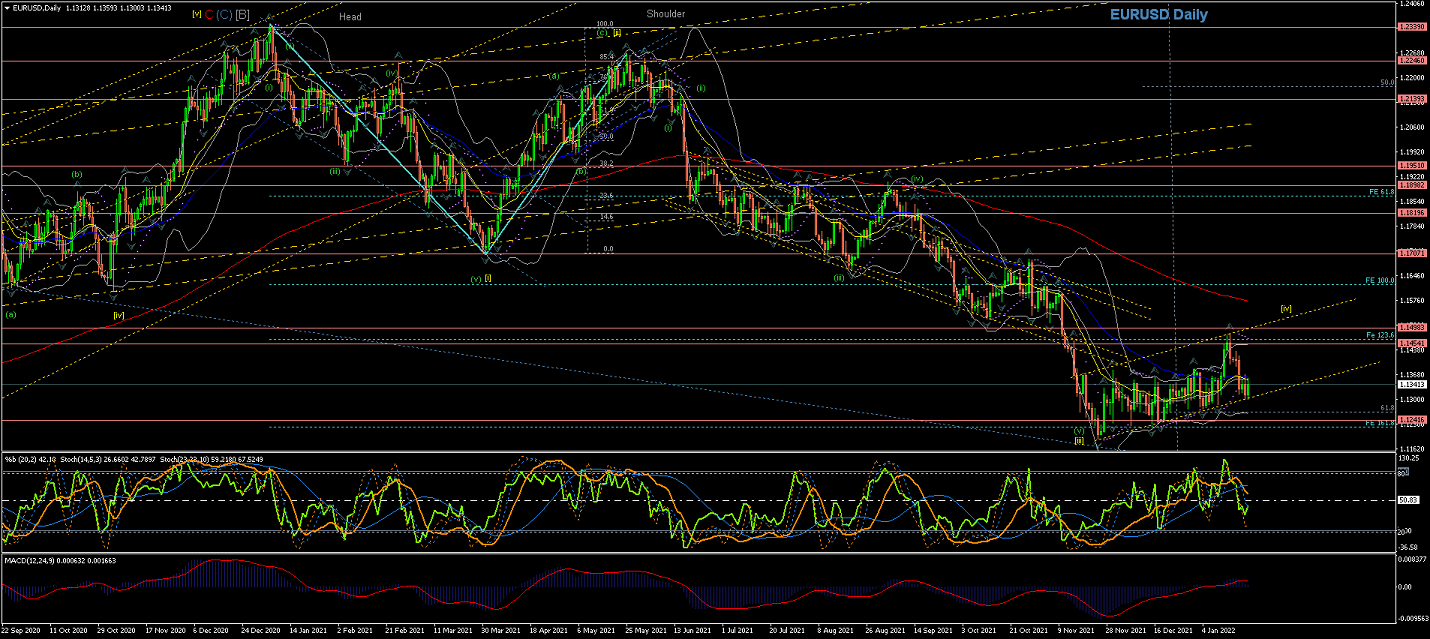
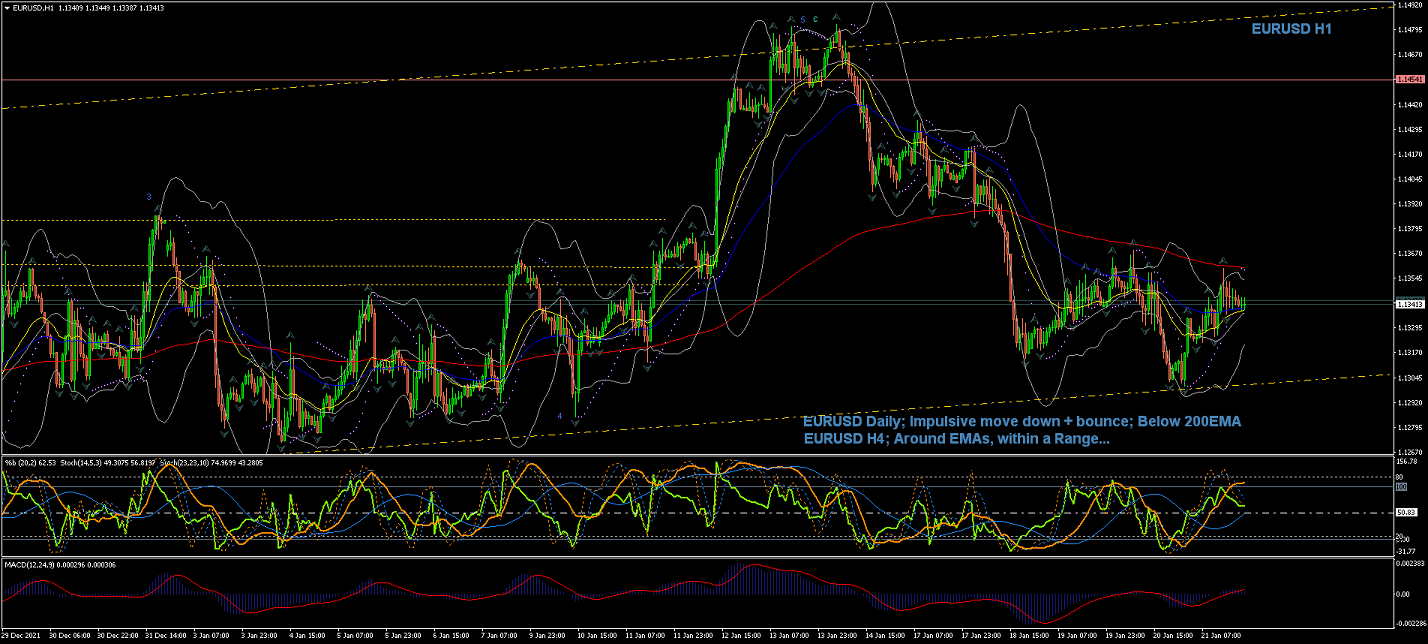
EURUSD
Weekly Chart is showing an extended Wave C(red) of Wave (C) of Wave [B] now showing to be completed...
And also showing signs of the price reverting into a down Trend as it headed down impulsively across the EMAs,
after a sharp corrective Wave [ii]...
Notice how the price has confirmed Wave [iii] as it has crossed the lowest of Wave [i] and reached its 161.8 extension...
Current reaction to the long-term Trendline(blue) should be something interesting to watch for... and should form Wave [iv] correction...
Daily Chart; Since Wave C(red) was completed, the price has temporally crossed the 200EMA and lower Trendline for the potential of a new long-term Trend to the downside...
as Wave [i] and Wave [ii] are looking completed...
Wave [iii] seems to have made strong impulsive moves... and has been confirmed as the price remains below the lowest point of Wave [i] @1.17071...
For this count to remain correct we should still expect further downside moves after corrective Wave [iv] is completed...
4Hour Chart is showing Wave (v) has completed Wave [iii]...
And now Wave [iv] is bringing the price up in a corrective fashion...
60Min Chart is showing a Range after the completion of Wave [iii]... which is forming Wave [iv]... more visible in the 4 hour Chart...
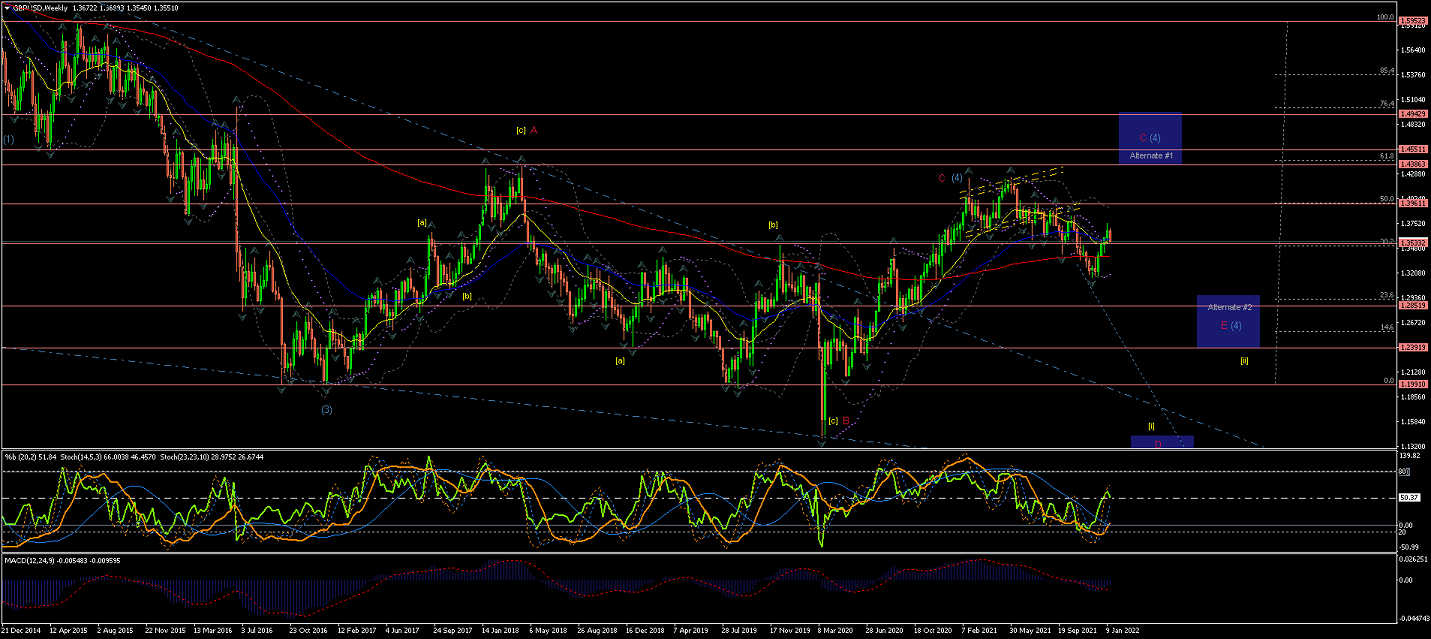
GBPUSD
Weekly chart shows an extended Wave (4) correction crossing the EMAs in a rather struggling way...
Although the price has started coming down lower to follow Wave (5), as per current count...
Regardless of the direction, the moves still look weak and corrective... and for Wave (5) I would expect rather more impulsive moves to the downside...
(Note Alternate #1 for a possible larger Wave (4) developing...).
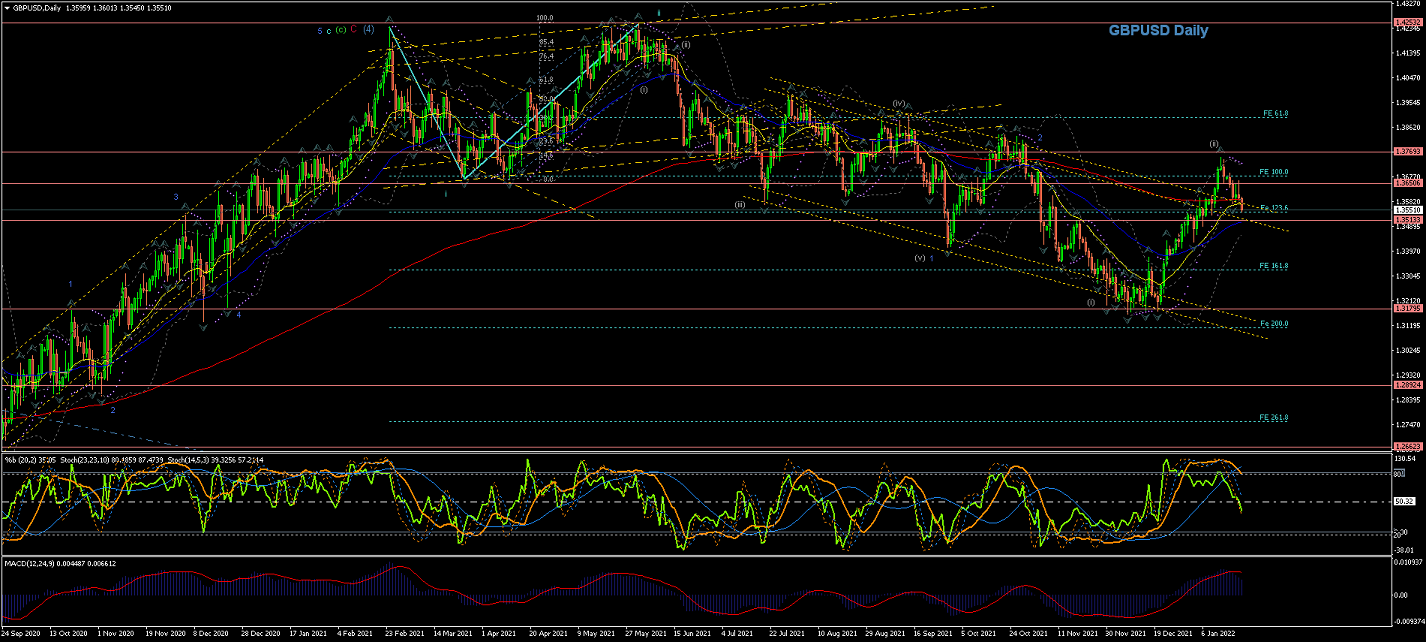
Daily Chart is showing the Wave C(red) completing Wave (4)...
Next, if this count is correct, we should expect the price to continue the moves down impulsively for Wave (5)...
so for the current count to work the price still needs to complete the breakout of the now descending Range formation (yellow) to the downside...
And for this Wave (5) there could be a series of Waves 1 -2 forming to the downside...
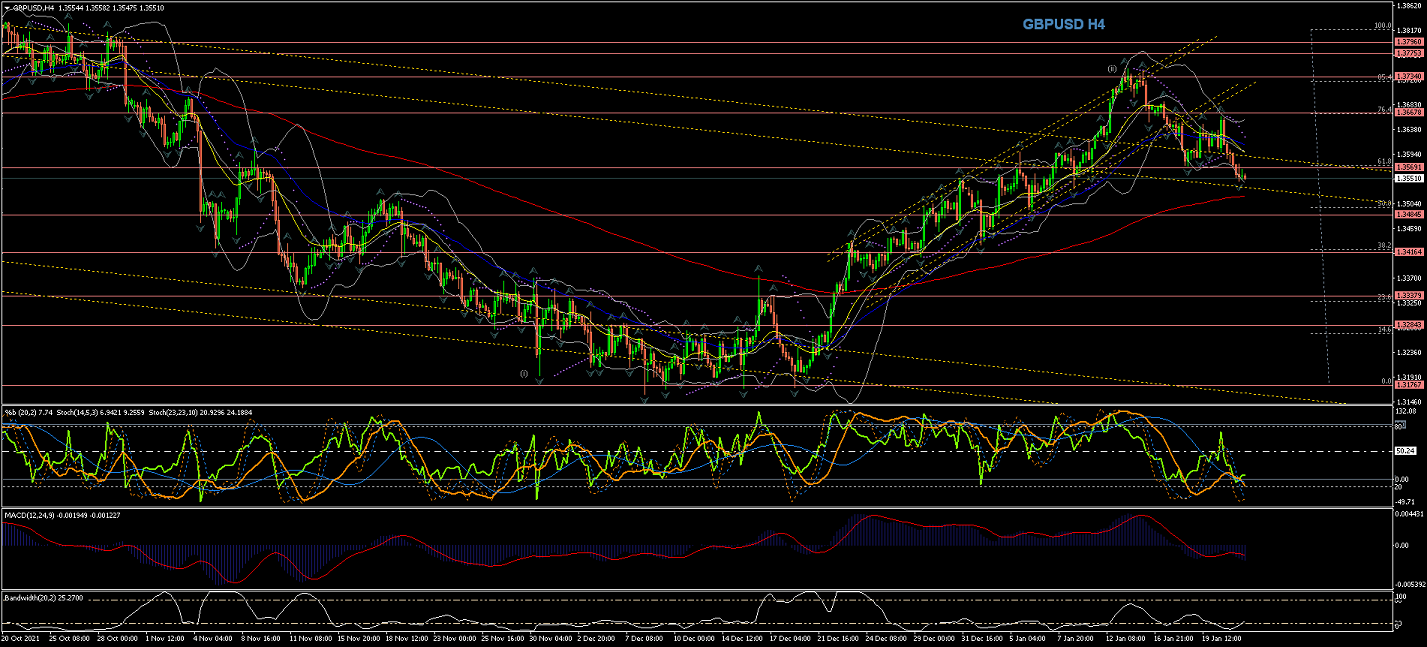
4Hour Chart shows the price broke out of the current Range, which triggered an alternate count which I marked as now forming Waves (i) and (ii) of Wave 3(blue)... best seen in the Daily Chart...
Current Wave (ii) has reached the %85 retracement of its Wave (i) so, if this count is to remain valid, we should expect moves to the downside... otherwise I will have to revise more longer term counts...
60Min Chart is showing the price moving steadily up within an Ascending Range... watch out for its breakout (to the downside for the current count to work)
All the best for everyone and please do not hesitate to contact me if you have any questions or comments.
Andres
info@tradingwaves.org
Please be aware: that these Analysis are own opinions, not Trading advice; Trading carries a high level of risk, and may not be suitable for all investors. Before deciding to trade you should carefully consider your investment objectives, level of experience, and risk appetite.


 Trading Waves .org