Fri 01-10-2021
Hi everyone, hope you are all great.
So... Let's get into it...
USDJPY
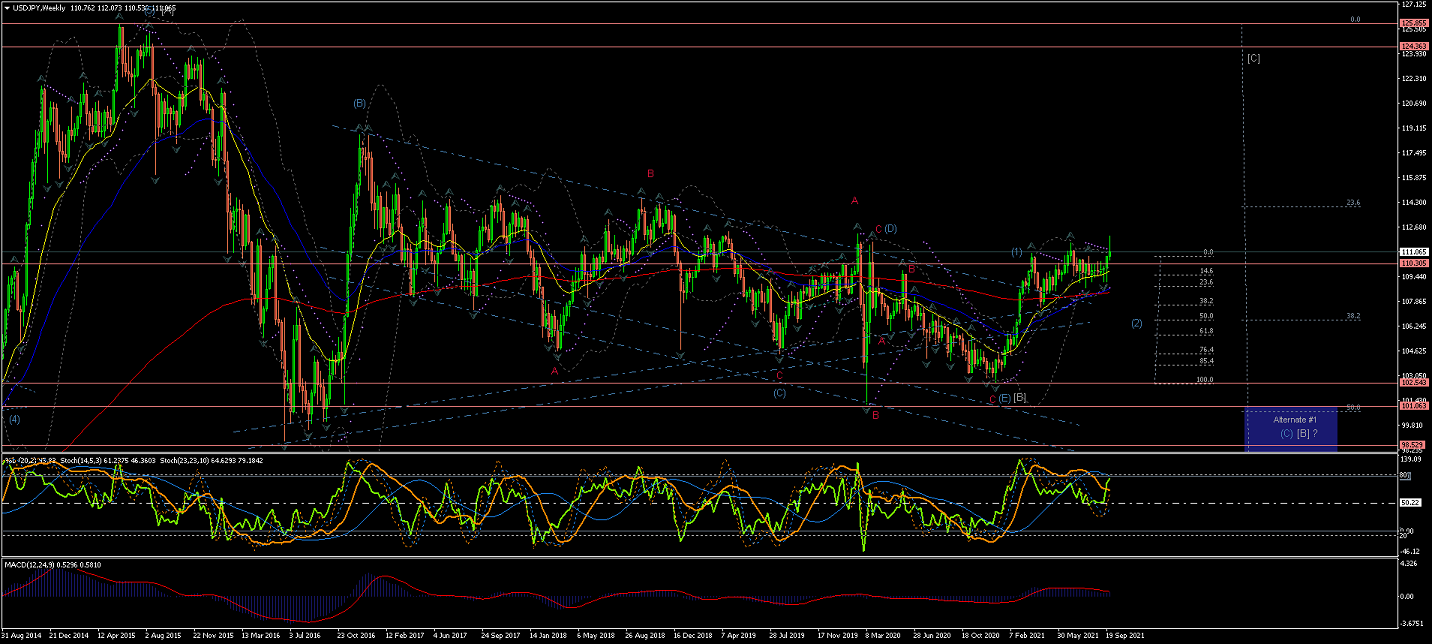
Weekly Chart is showing Wave (1) could be completed now that the price has crossed the upper long-term trendline...
A rise from the lower trend line, after the this long-term correction, under the current count,
suggests the beginning of the start of Wave (1) of a long-term raise.
(Price re-entering the long-term Range and subsequent drop across the %50 retracement would favor Alternate #1 count for an extended Wave (C) of Wave [B] correction towards the %62)
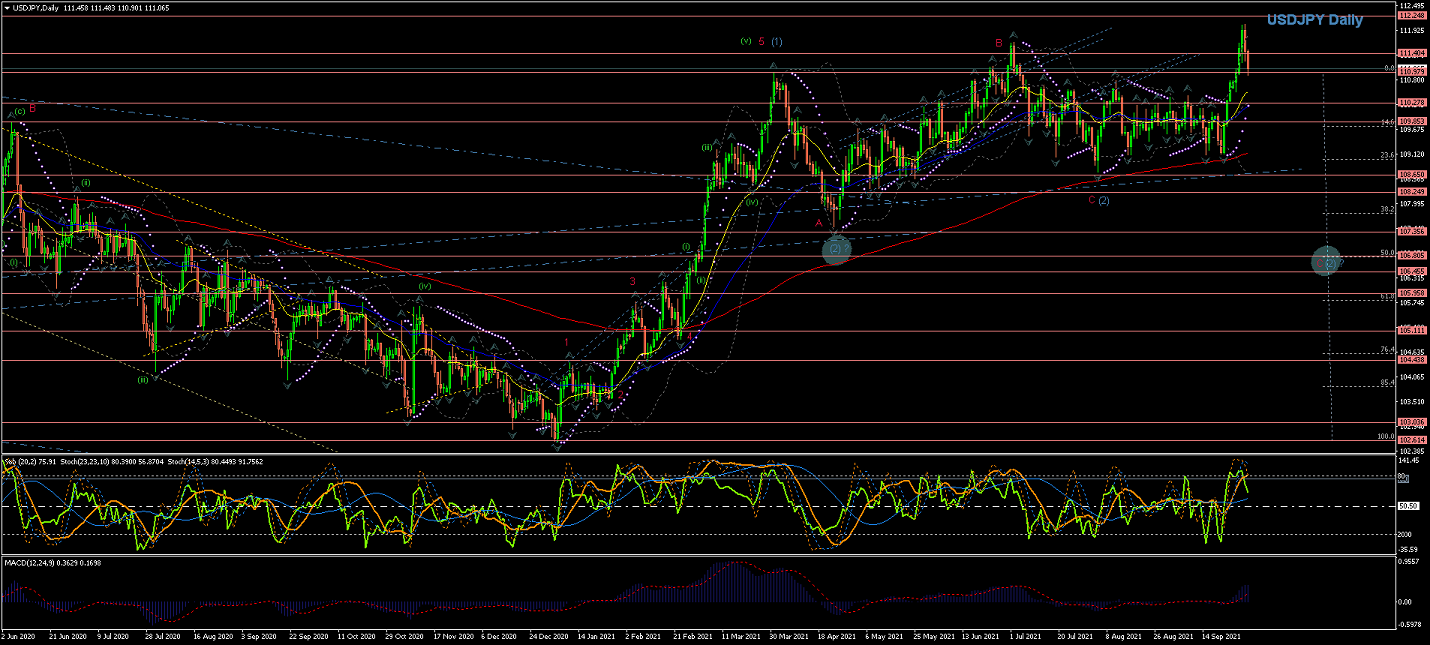
Daily Chart is showing Wave (1) should be completed as the price has now crossed the EMAs impulsively after nearly a year... let's see the price reaction to the long-term Trendline (blue)...
At first glance Wave (2) has already hit the %38 retracement of Wave (1)... as the Alternate count suggests (circled))...
On the other hand, the updated main count indicates that Wave (2) could be completed with its Wave C(red) as a false Expanded Flat correction...
And a further Alternate count suggests Wave c(red) to complete Wave (2) as an extended correction towards the %50/%62 retracement levels...
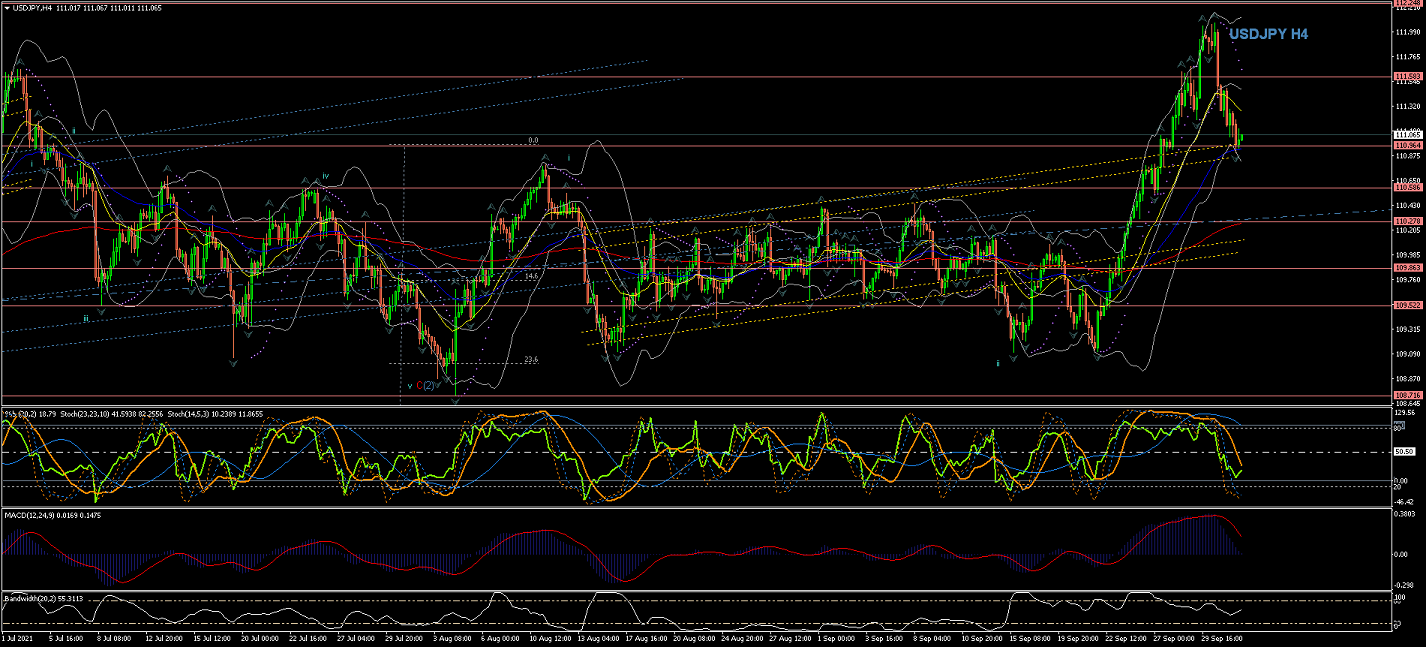
4Hour Chart is showing Wave C(red) completed... however, the price went up again,
which I marked as initial Waves i & ii completed...
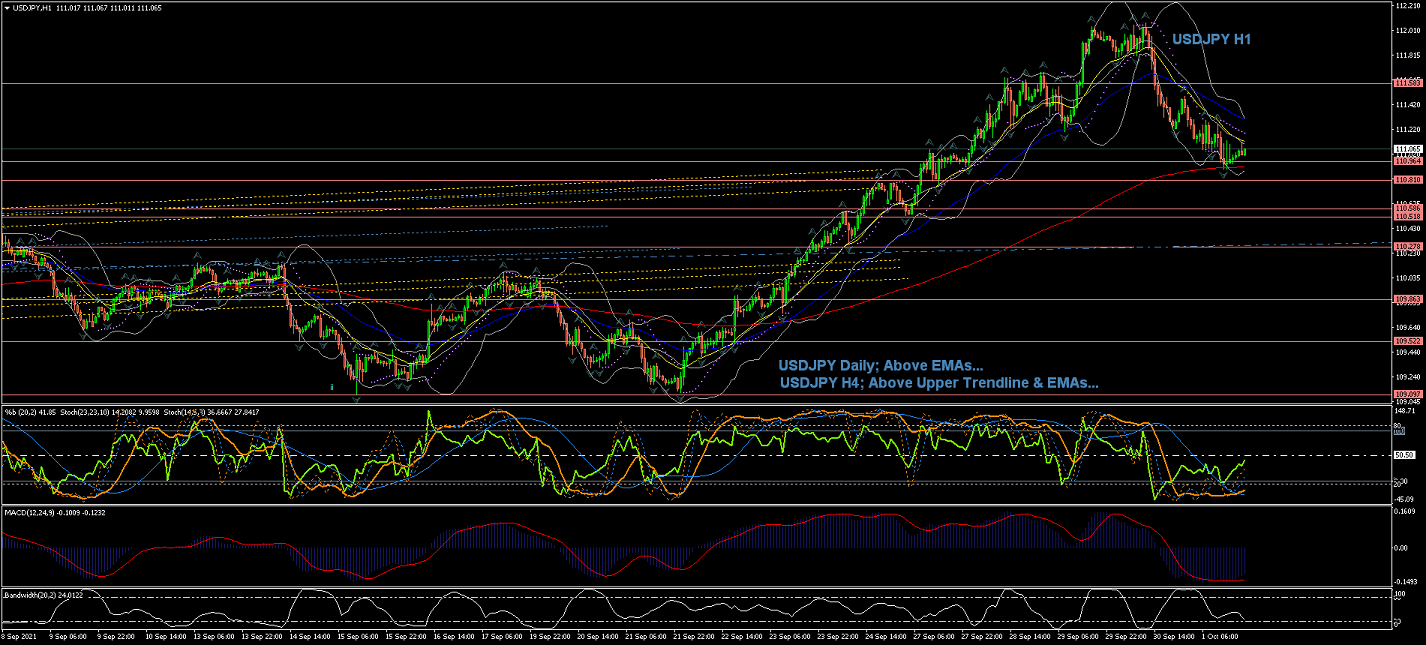
60Min Chart shows the price raising steady after completing Wave ii...
Whether this raise is a completed Wave iii remains to be seen
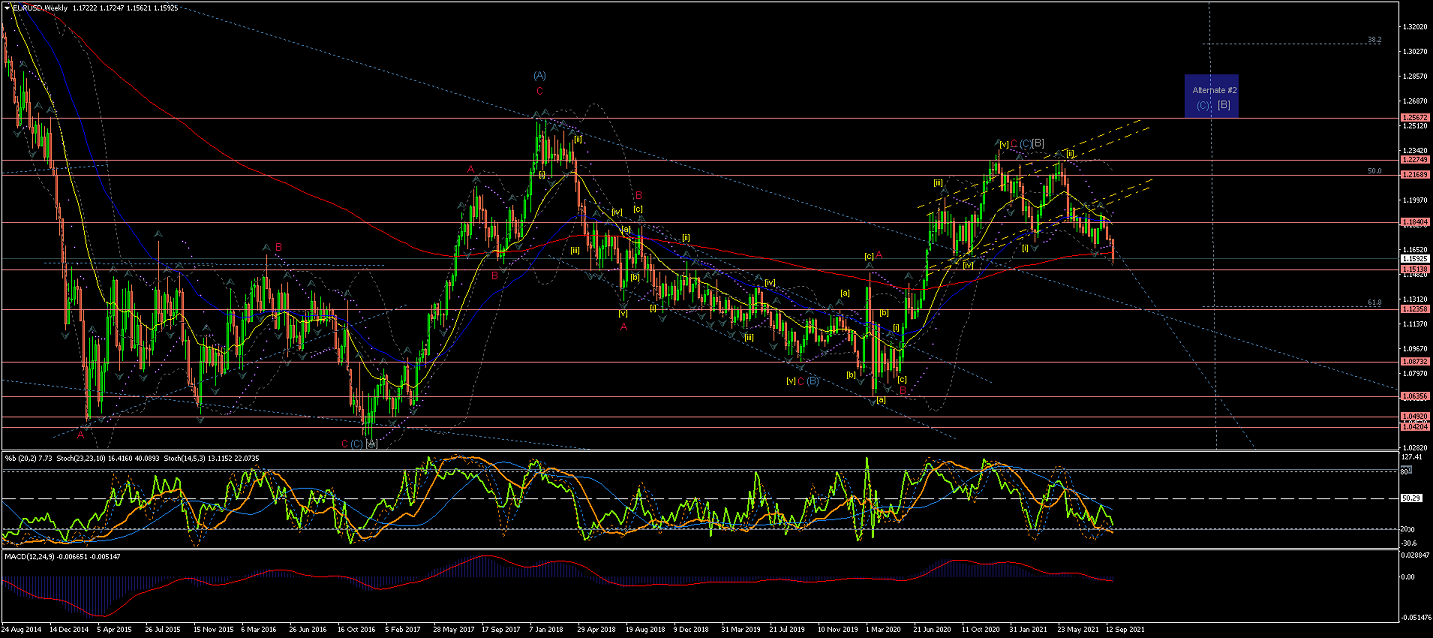
EURUSD
Weekly Chart is showing an extended Wave C(red) of Wave (C) of Wave [B] now most likely completed...
And showing signs of the price reverting into a down Trend as it headed down impulsively towards the EMAs,
and it has bounced at them causing a sharp corrective Wave [ii], as the current count suggests...
Notice the Alternate #2 for more extensive correction of long-term Wave [B] to have in mind...
However, price is at the verge of confirming Wave [iii] as it is crossing the lowest of Wave [i]...
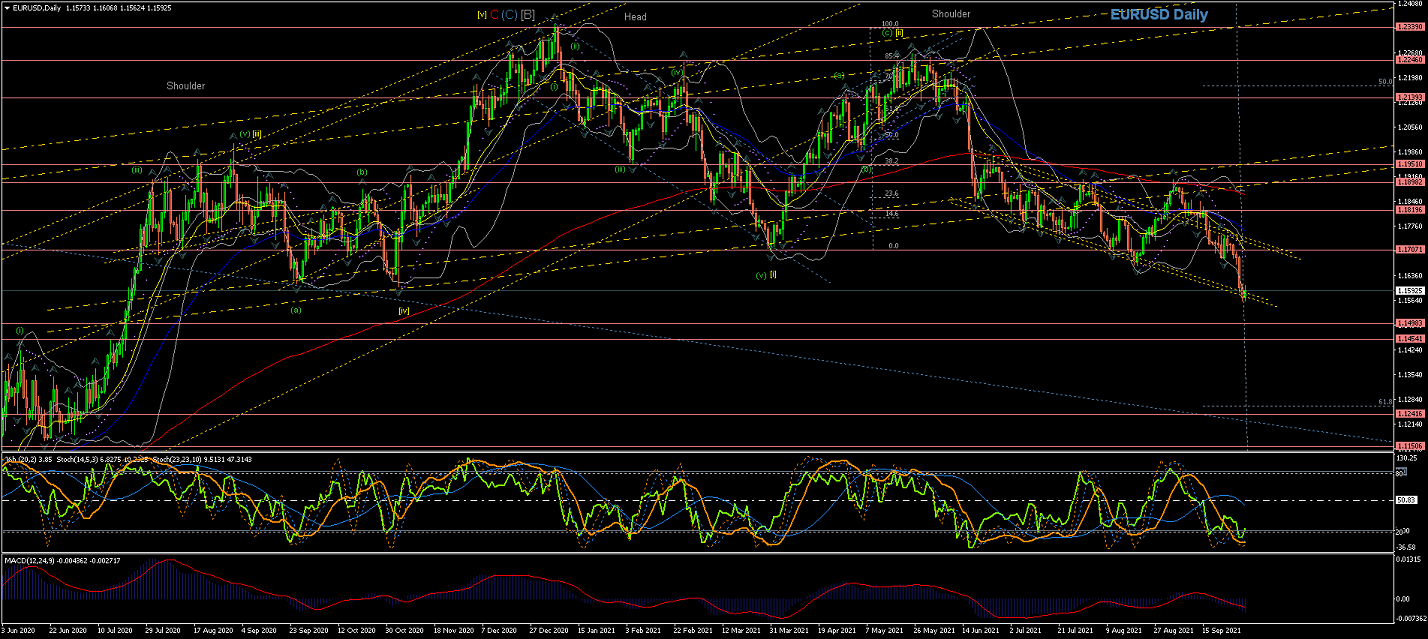
Daily Chart is showing Wave C(red) most likely completed at the top trendline of the Trend Channel(yellow).
Since then the price has temporally crossed the 200EMA and lower Trendline for the potential of a new long-term Trend to the downside...
as Wave [i] and Wave [ii] are looking completed...
(Wave [ii] at the %85 retracement of Wave [i] though...)
Wave [iii] seems to have made a strong initial impulsive move... and would be confirmed if the price remains below the lowest point of Wave [i] @1.17071...
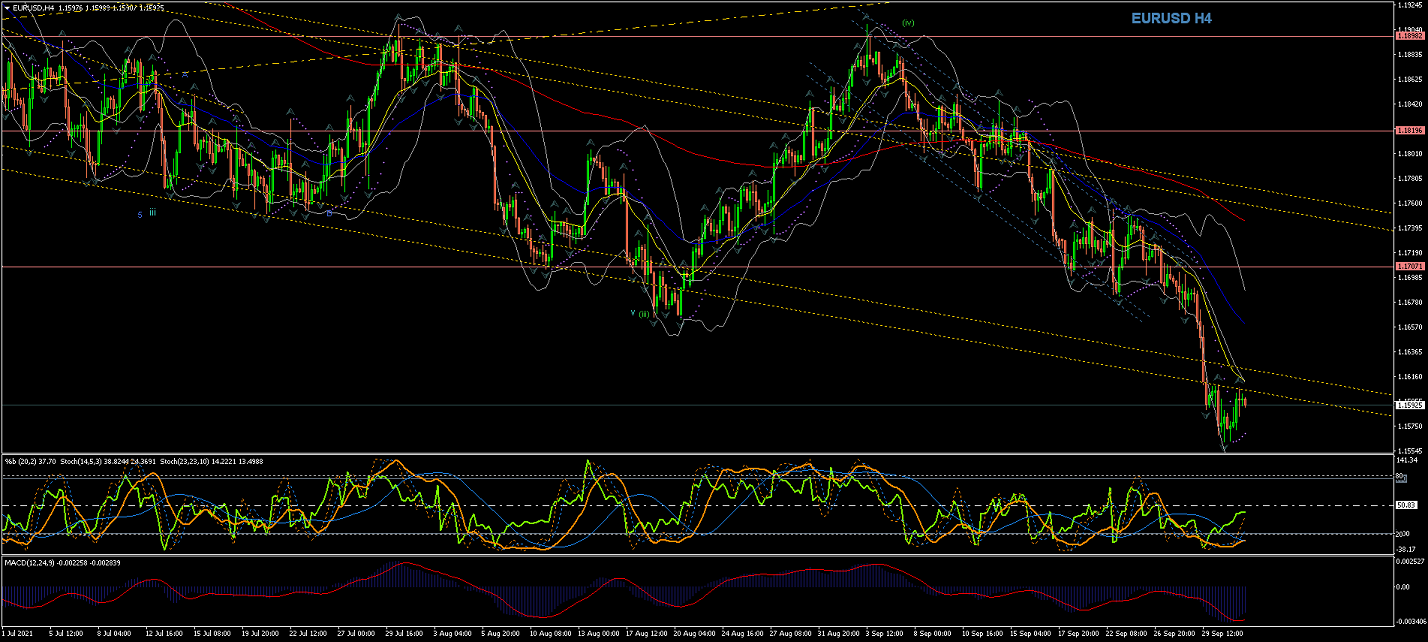
4Hour Chart is showing the internal waves of Wave(iii) of Wave [iii] likely completed...
as Wave (iii) of Wave [iii] already broke below the lowest of Wave [i] @ 1.17071...
Wave (iv) also seems to be completed, as the price went back into the Range after a False-Breakout...
So Wave (v) brought the price towards the lower Trendline, and now could cause a Breakout of this Range for more Downside...
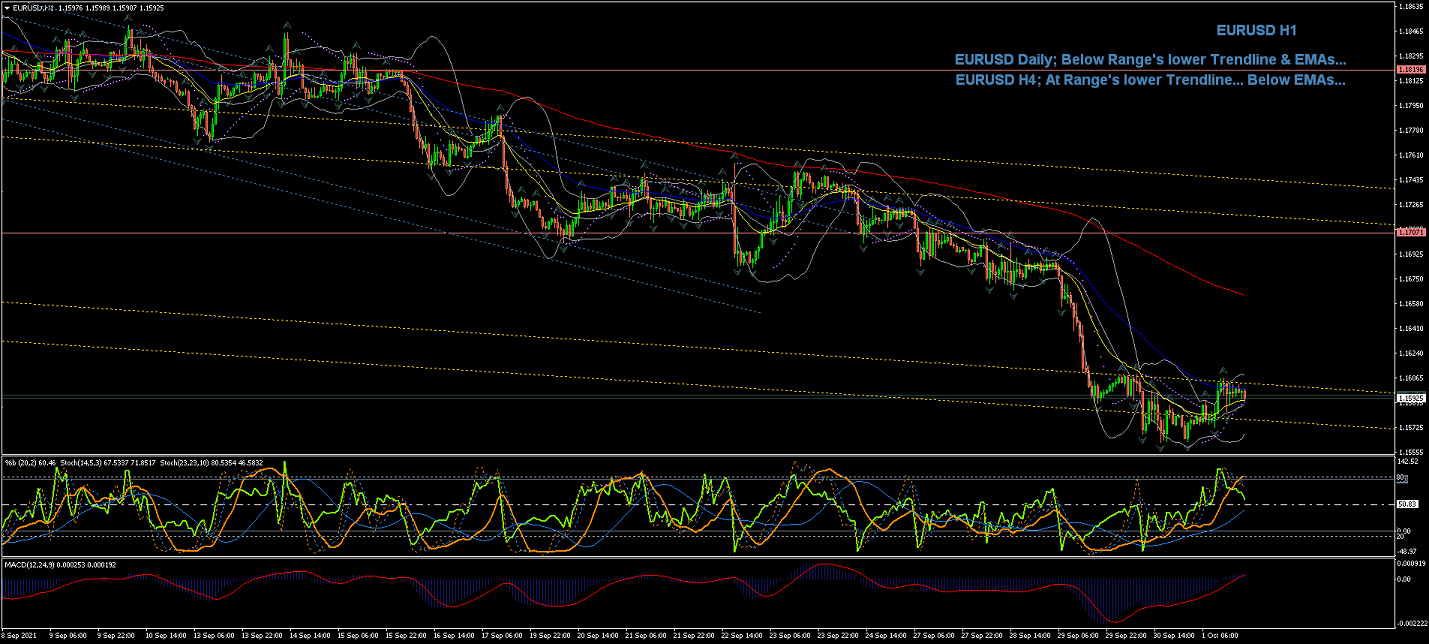
60Min Chart is showing how Wave (v) brought the price back into the Range until the lower Trendline...
where the price is creating a small consolidation area that is putting pressure the Trendline for more potential downside...
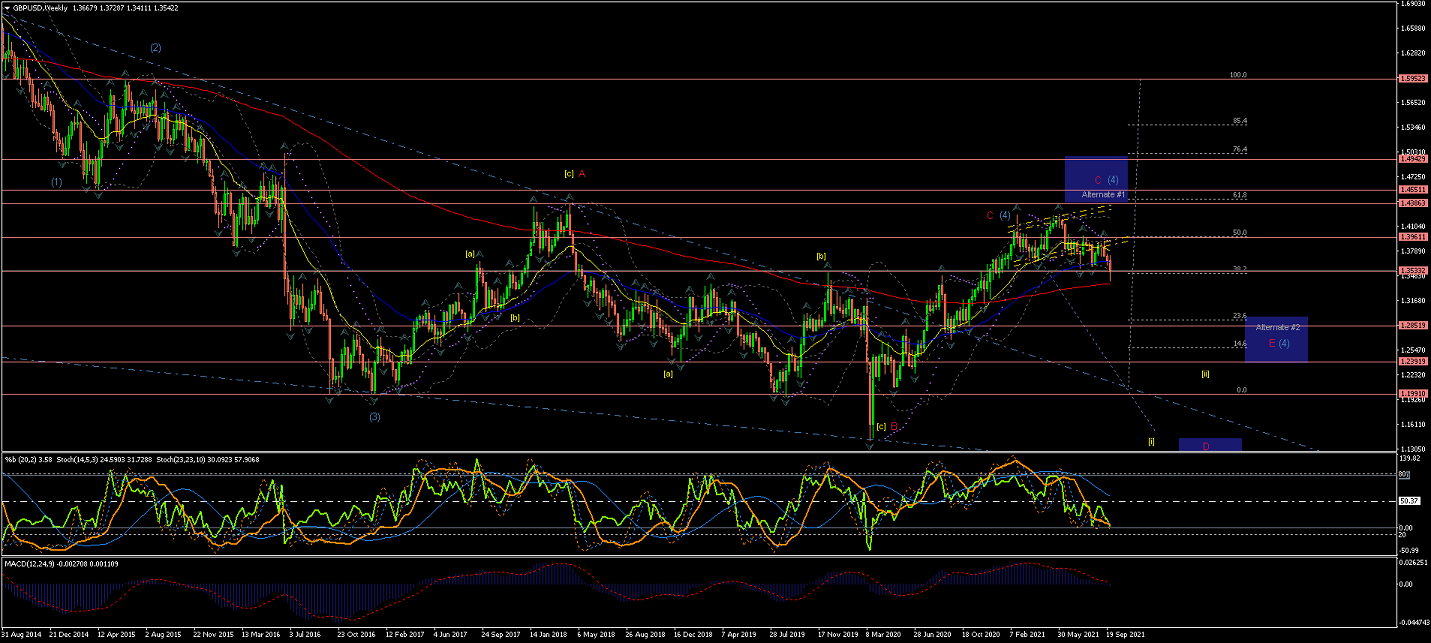
GBPUSD
Weekly chart shows an extended Wave (4) correction crossing the EMAs in a rather struggling way...
At the current resistance points the price could start coming down lower to start Wave (5), as per current count
or continue higher as Alternate #1 suggests...
Regardless of the direction, the moves still look very weak and corrective...
(Note Alternate #1 for a possible larger Wave (4) developing...).
Daily Chart is showing the Wave C(red) completing Wave (4) in what should then be a false breakout
of this long term triangle formation (blue long-term trendline... best seen in the Weekly Chart...).
If this is a false breakout the moves could start bringing the price down impulsively and re-entering the blue long-term trendline.
Next, if this count is correct, we should expect the price to continue the moves down impulsively for Wave (5)...
but, the price got as close as it gets to the 0 retracement and any further than the 0 would have invalidated the current count...
so for the current count to work the price still needs to complete the breakout of the new Ascending Range formation (yellow) and cross the EMAs to the downside...
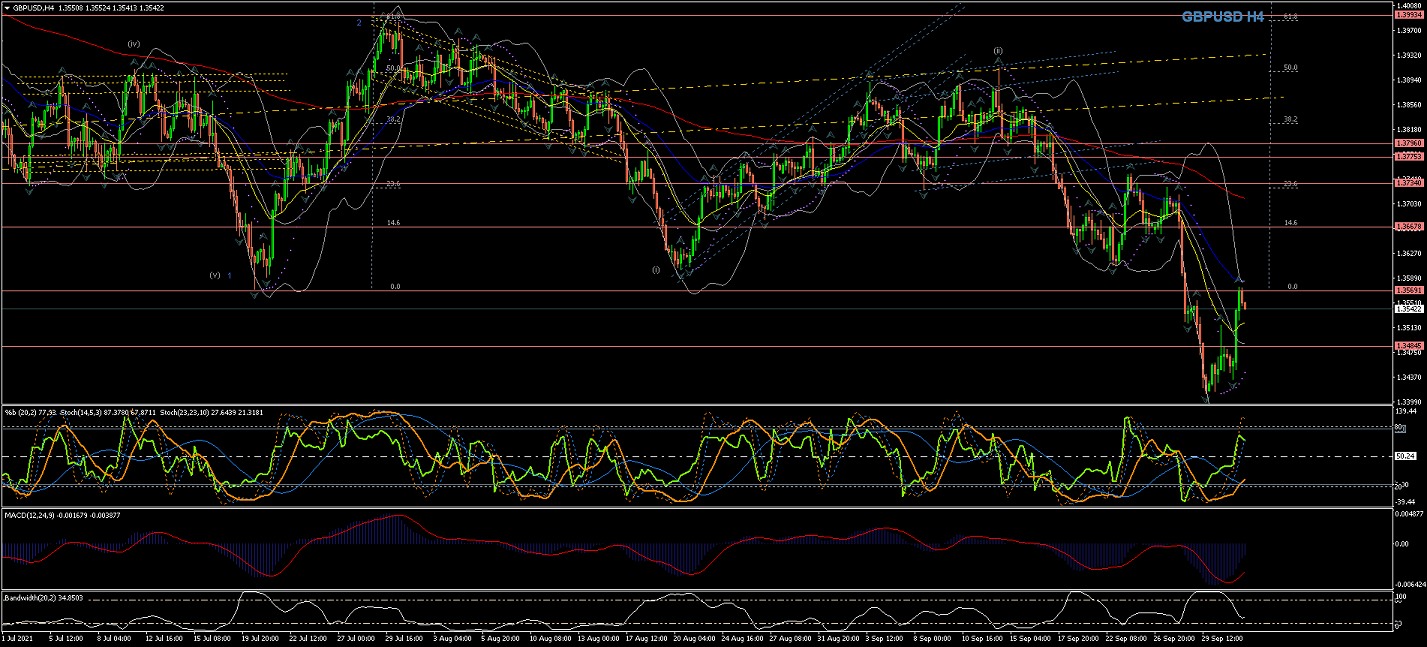
4Hour Chart shows the price falled below the EMAs for the potential start of Wave iii to the downside...
... that, so far, seem to have completed Waves 1 & 2(blue) of Wave iii...
But the price has not crossed the lowest point of Wave 1(blue), so Wave 3(blue) still to be confirmed...
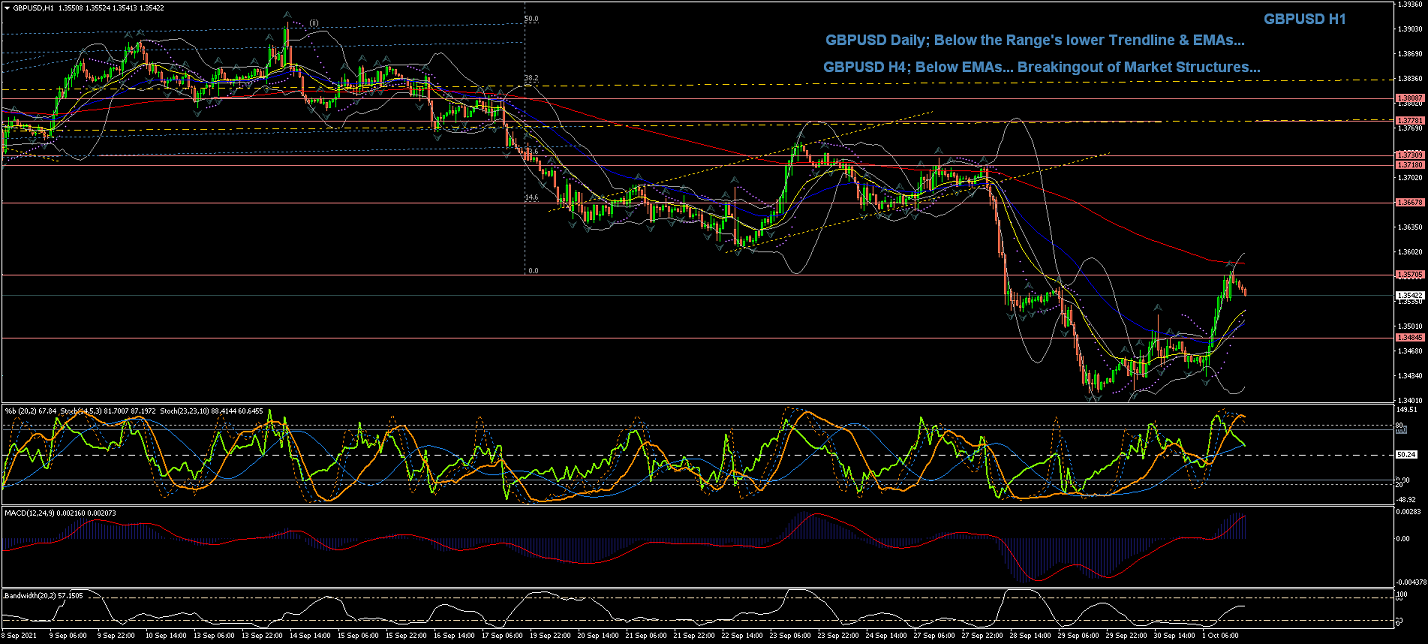
60Min Chart is showing the price moving lower for Wave (iii) (grey)..
All the best for everyone and please do not hesitate to contact me if you have any questions or comments.
Andres
info@tradingwaves.org
Please be aware: that these Analysis are own opinions, not Trading advice; Trading carries a high level of risk, and may not be suitable for all investors. Before deciding to trade you should carefully consider your investment objectives, level of experience, and risk appetite.

 Trading Waves .org