Wed 02-01-2019
USDJPY
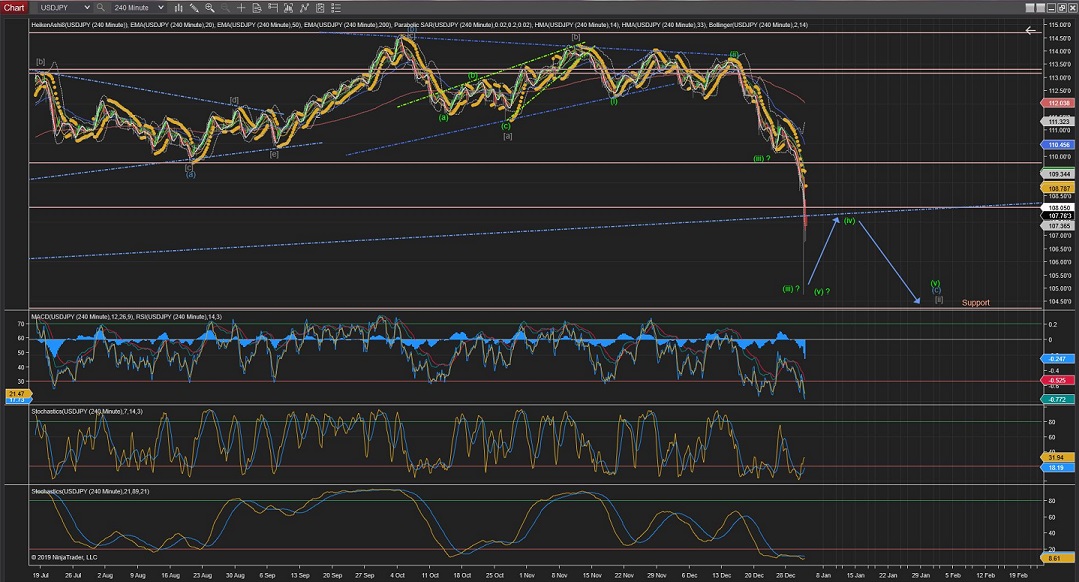
It looks like still needs to complete Wave4, which seems to be a Flat (3,3,5) correction, so it should complete this Wave4 in a series of 5 waves.
After the Wave4 is completed it should do an impulsive drop towards resistance to complete Wave5.
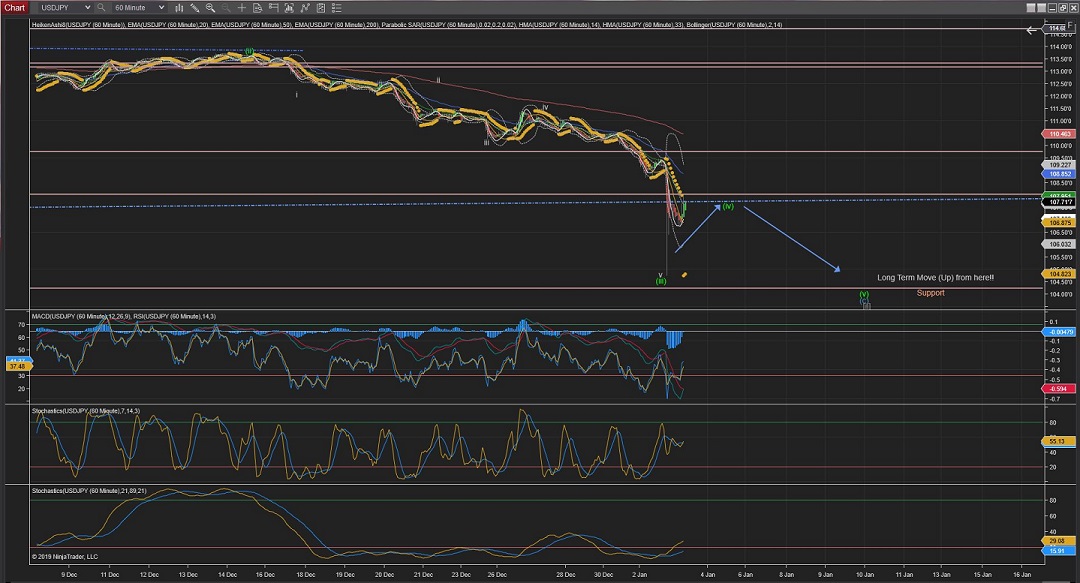
There has been a hughe drop at night pointing towards the end of Wave5 (of Wave (iii)) and should now go on a correction to form Wave(iv). To then do a final drop for Wave(v) towards Support to finish.
(The fact that it was such a big drop makes me doubt on wether that was the final Wave(v) and it is starting the Wave(i) already on the long way up)
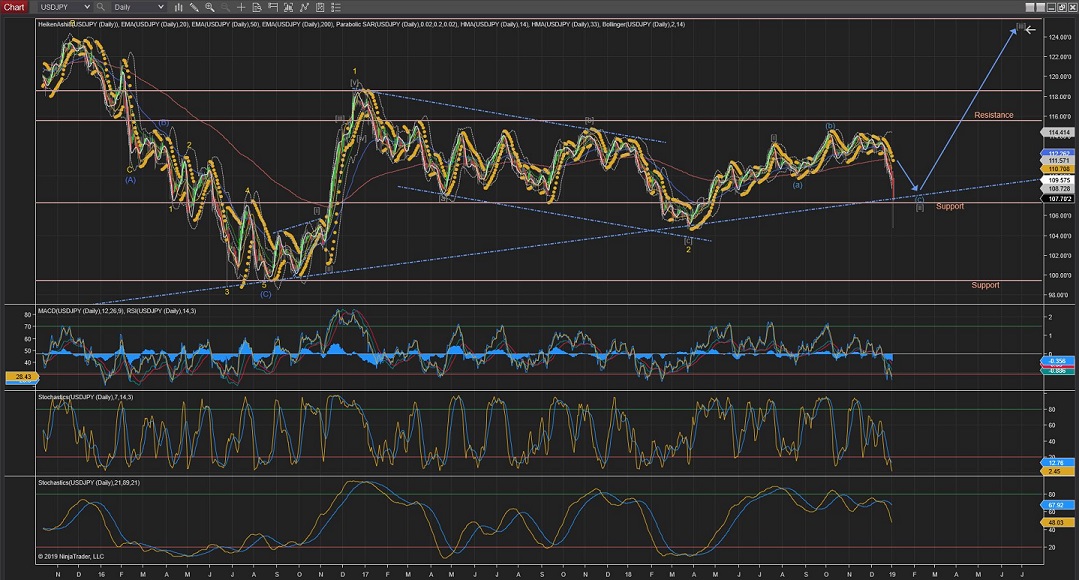
In the case that the Wave(iv) is still developing... After the Wave(v) does the final drop; it should start raising making Wave(i) of [i], making the end of a long-term bottom.
60Mins
4Hours
Daily
GBPUSD
GBPUSD also took a big drop making that the end of Wave(i) and it is now on the corrective Wave(ii).
The Fibonacci shows the retracement potential targets of %61 matching roughly with the 200EMA in the Hourly Chart, although it could well hit the %76, which matches with the 200EMA on the 4Hour Chart and some levels of Resistance.
Once the series of Wave(ii) retracement coreections are complete, it should start a series of impulsive waves to mark the start of Wave(iii)
60Mins
4Hours
Daily
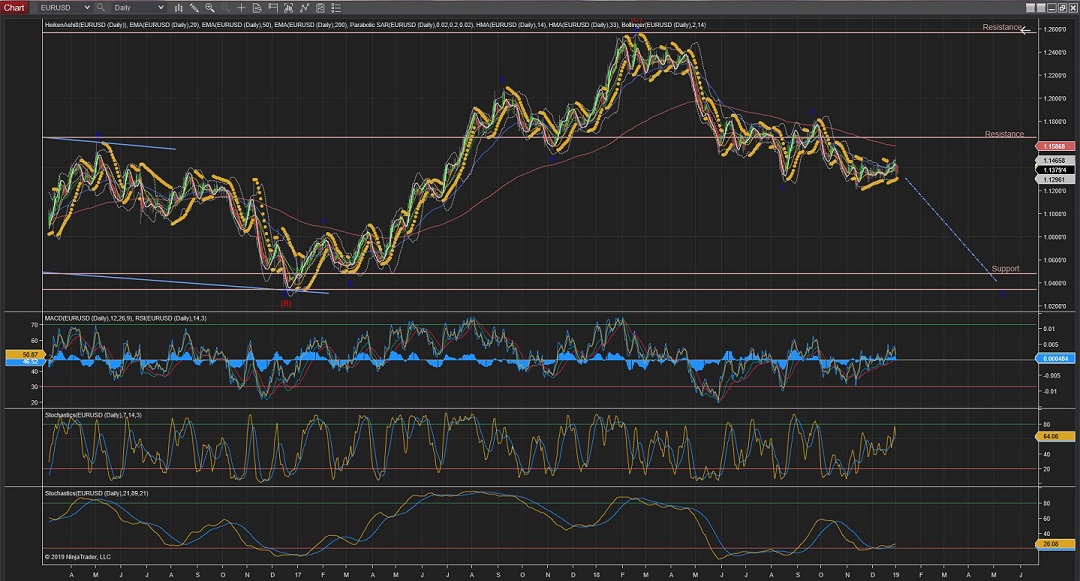
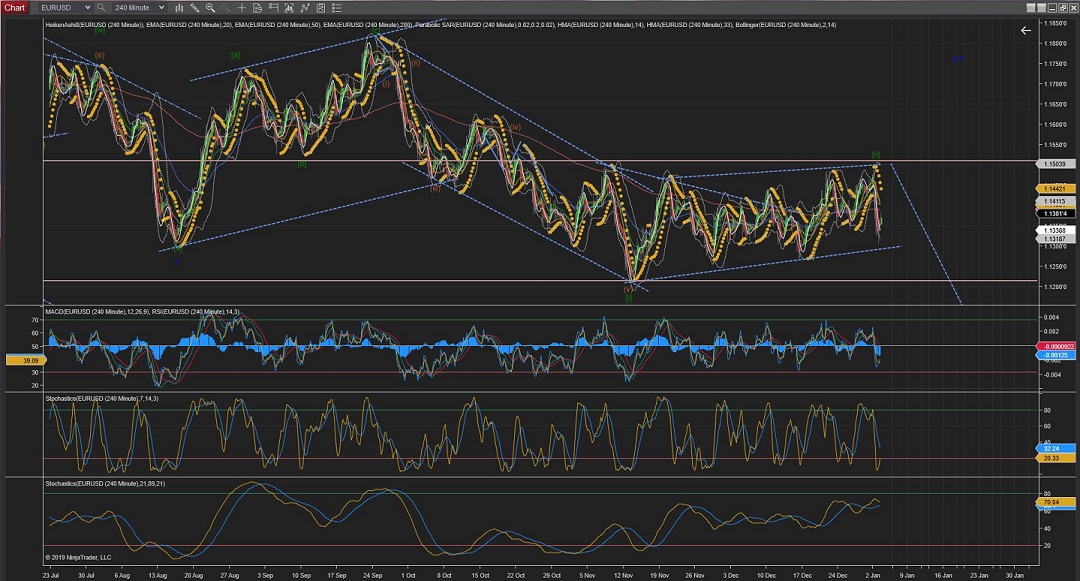
EURUSD
On EURUSD it has made an impulse down too which suggests that Wave i of Wave (i) of Wave [iii] might have started, although this would not be confirmed until levels of Support (@ 1.1305) are passed on the way down.
And, if the levels of Resistance (@1.1500) are passed on the way up it would trigger the alternate count of a bigger Wave [ii].
60Mins
4Hours
Daily


 Trading Waves .org