Fri 08-01-2021
Hi everyone, hope you are all great.
So... Let's get into it...
USDJPY
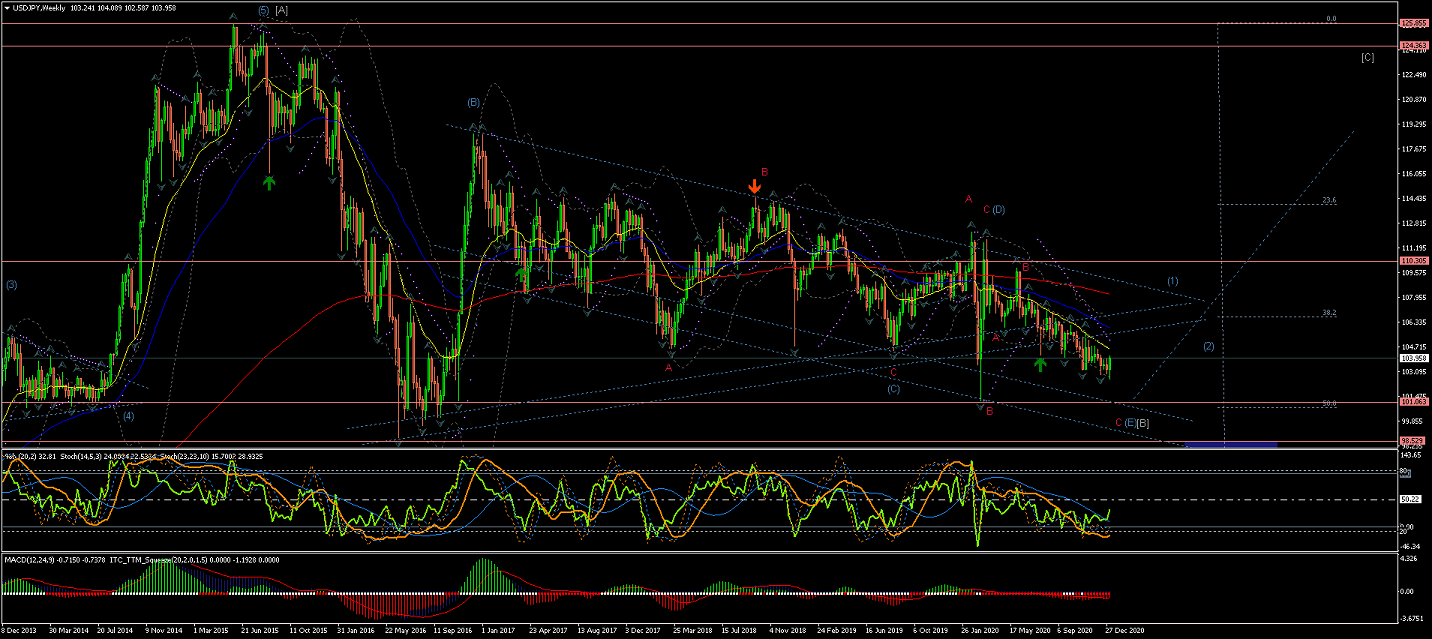
Weekly Chart is showing a quick raise in Wave C(red) to complete Wave (D), seems like another drop for Wave (E) is still targeting
the lower triangle trendline, to complete this long term correction...
A rise from the lower trend line, after the this long-term correction, under the current count,
would suggest the beginning of the start of Wave (1) of a long-term raise.
(a drop across the %50 retracement would favor Alternate #1 count for an extended Wave (C) correction towards the %62)
Daily Chart is been showing the current Wave (E) could still be continuing towards the lower trend line and possibly to match
previous lows (of Wave B(Red))... let's see if the latest impulsive raise gets halted or continues...
Overall the moves continue to be corrective in nature overall, and still below the EMAs, so I wouldn't start long positions until
the price raises higher impulsively for the start of the new trend up described in the Weekly Chart.
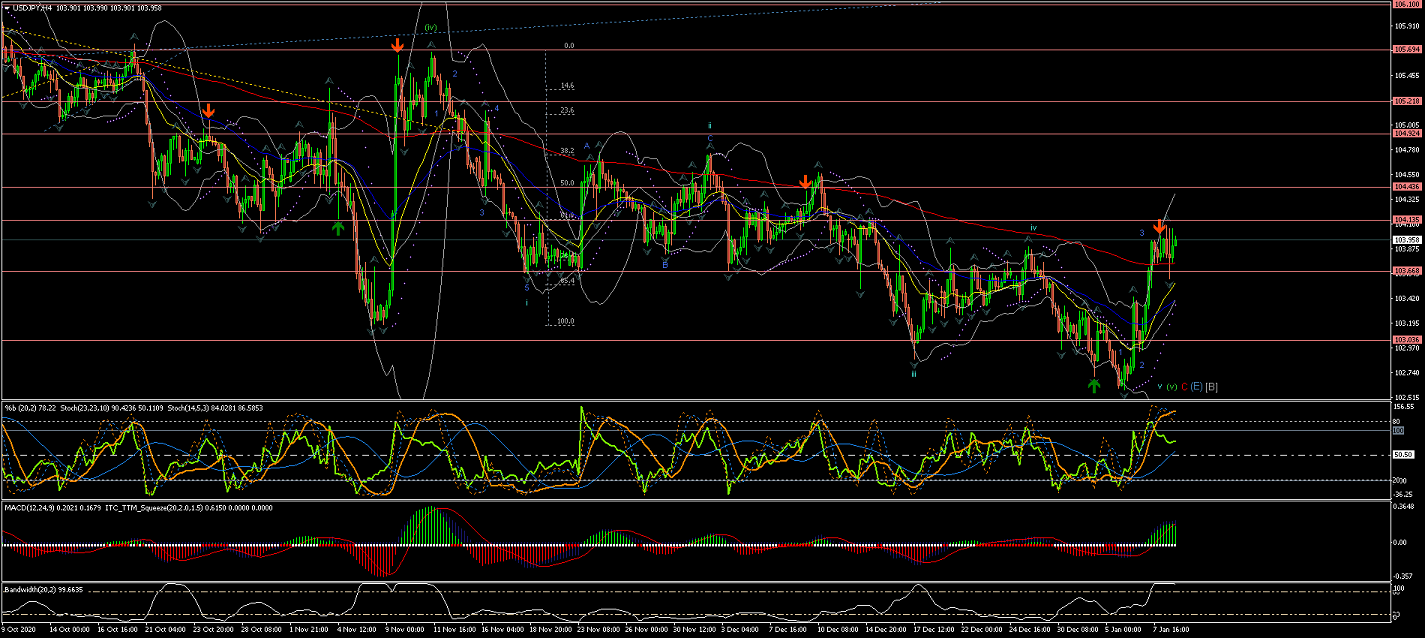
4Hour Chart is showing that there has been an extended Wave (iv) that has cancelled previous count.
Which means Wave (v) could still be making its way lower... but the latest raise questions whether the trend
has finally changed to the upside.
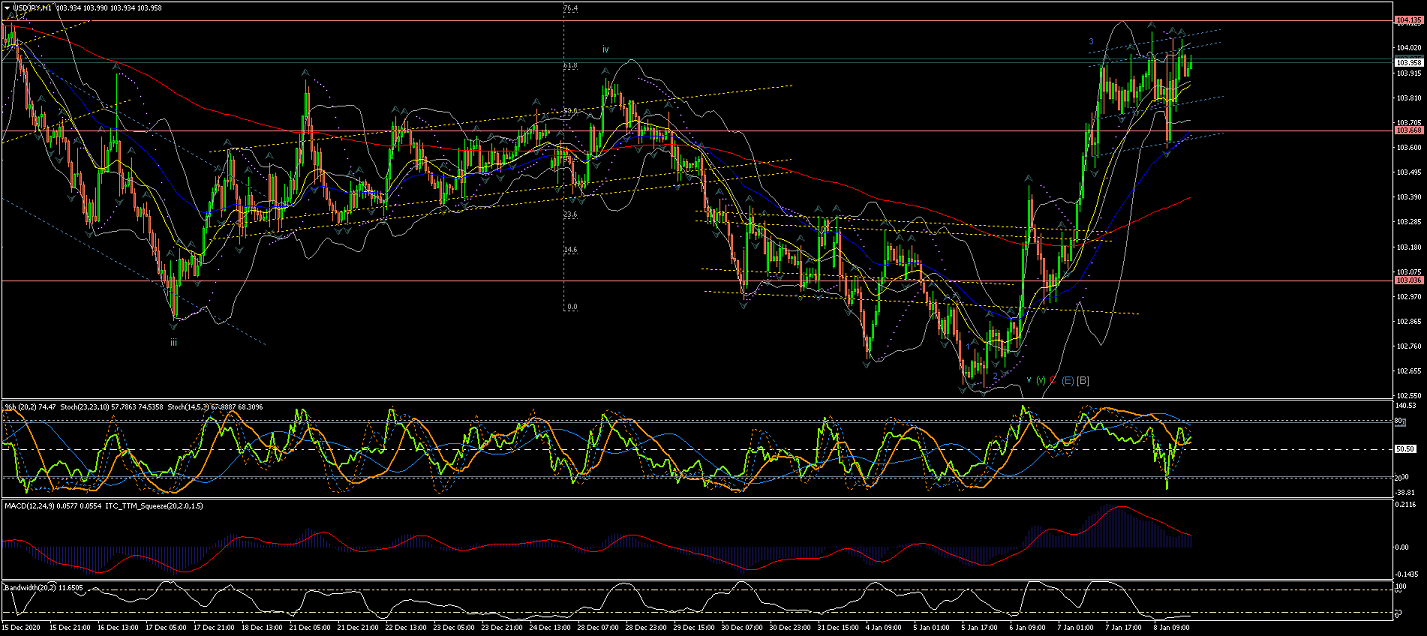
60Min Chart shows the potential for this new Trend up... with the first 3 potential Waves (blue) to the upside...
If the moves up continue in the form of 5 waves, it would favor this wave count...
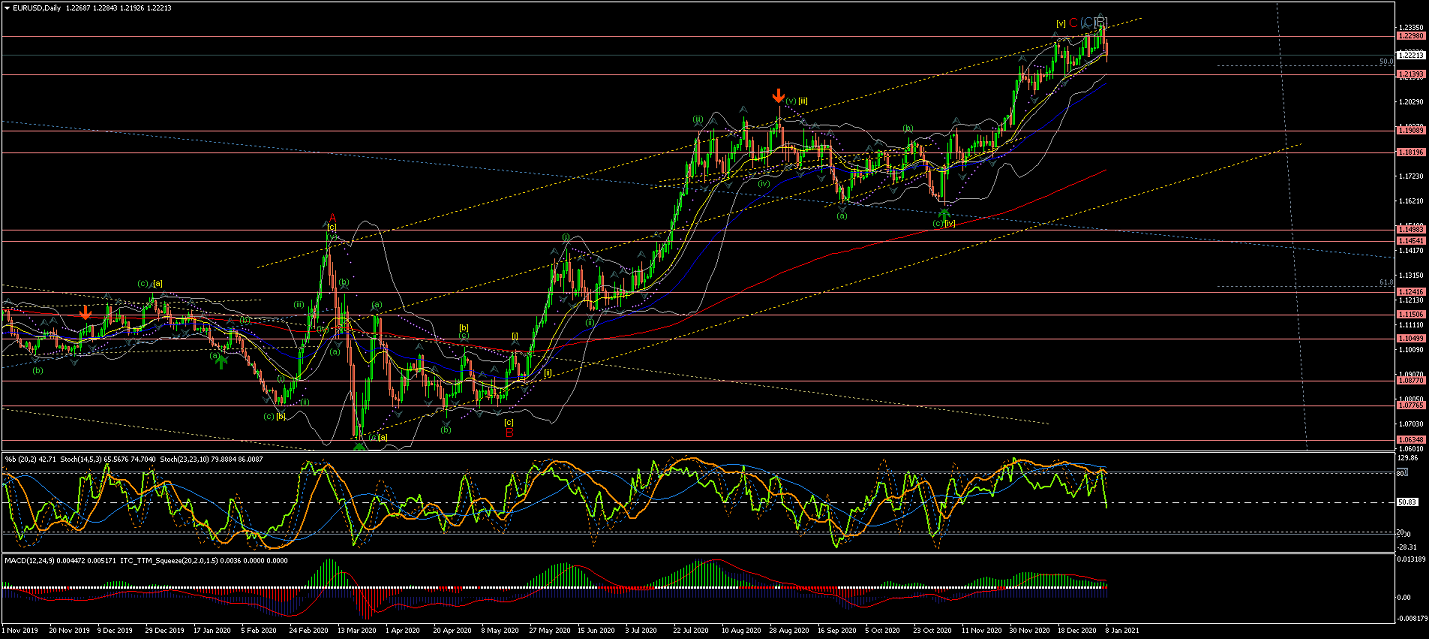
EURUSD
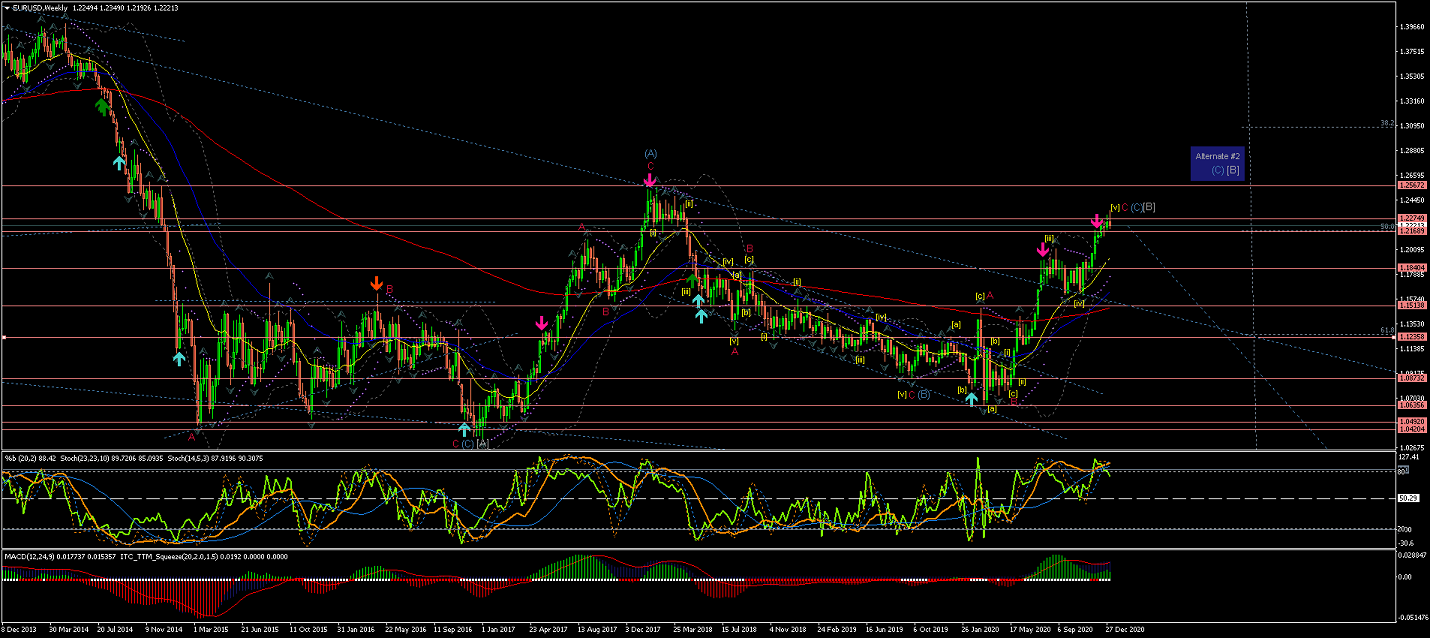
Weekly Chart is showing an extended Wave C(red) now at nearly completion of just its internal Wave [v]
to potentially make a last high.
Notice the Alternate #2 for more extensive correction of long-term Wave [B] to have in mind.
Daily Chart is showing Wave C(red) almost completed with only Wave [v] to confirm completion
to make for an extended Flat correction, as it is now at the upper trendline of the long-term triangle formation (blue trend line)...
within a Trend Channel(yellow).
So Wave [iv] confirmed completion above the blue Trend line and 200EMA
And now Wave [v] has Raised impulsively to eventually complete Wave C(Red)...
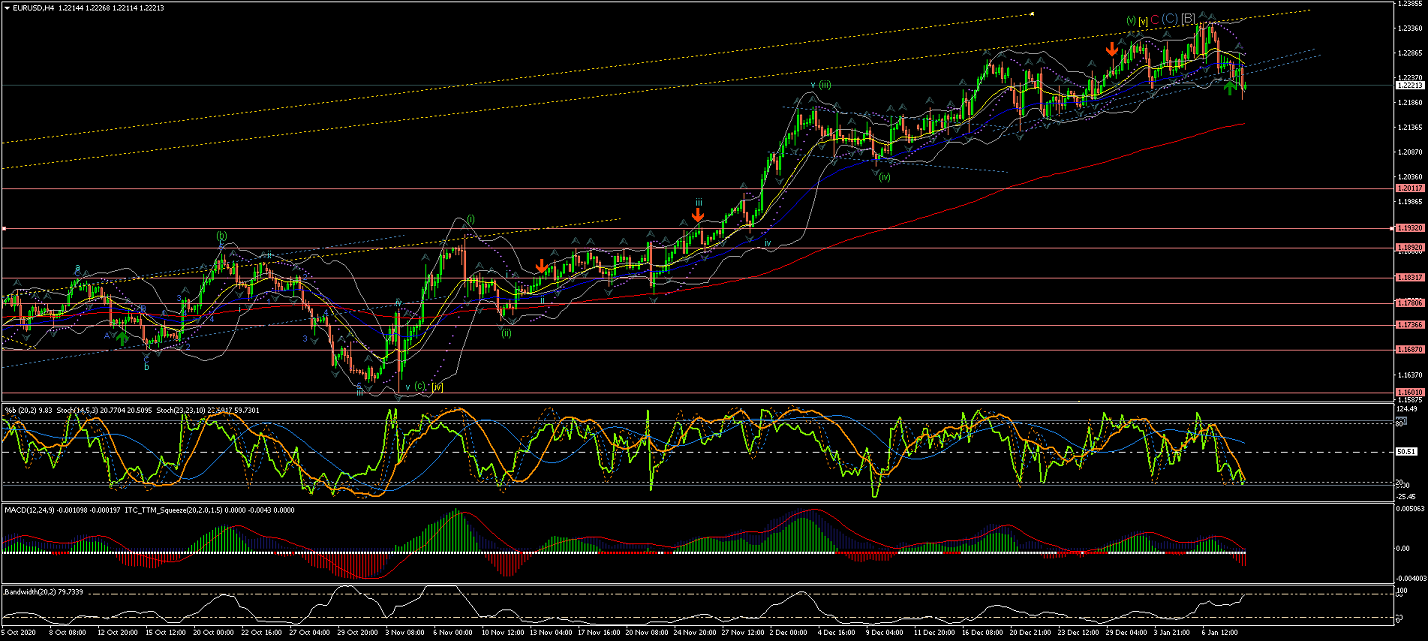
4Hour Chart is showing Wave (v) of Wave C(red) could have found a top...
If that is the end of Wave C(red) we should expect the price moving down in a impulsive way, across the 200EMA.
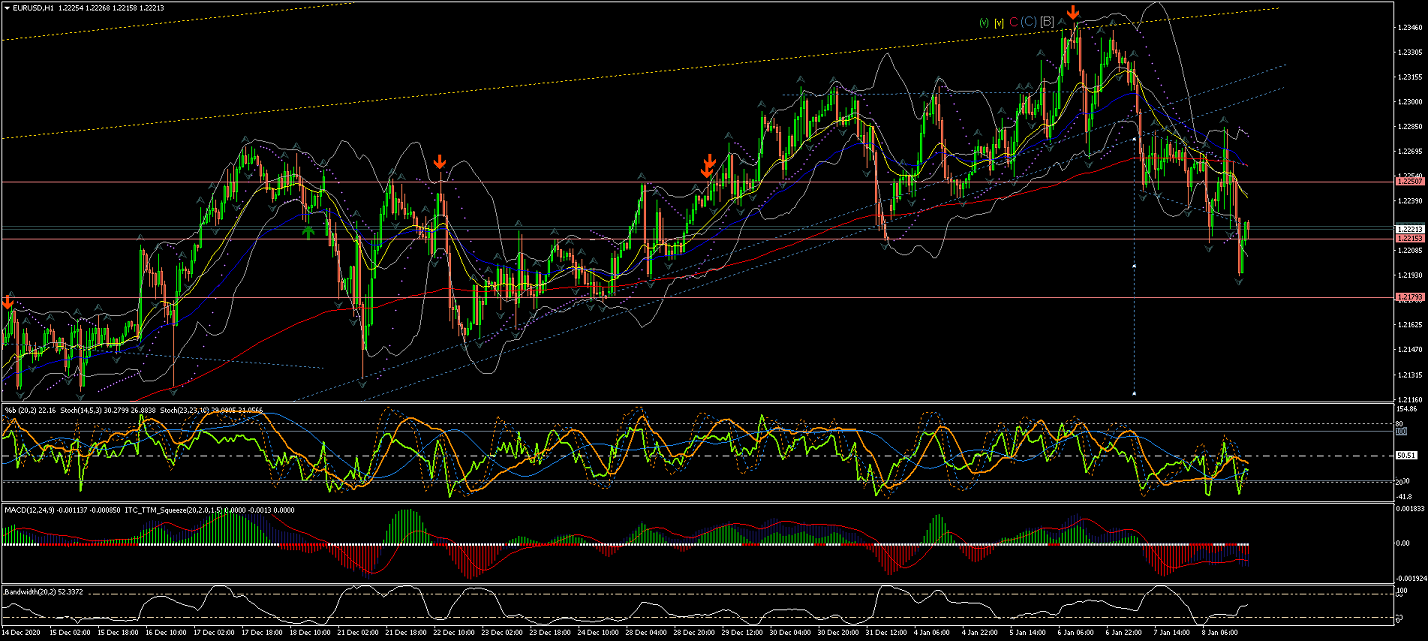
60Min Chart is showing how Wave [v] could have be completed as the price rejected the top trandline fairly impulsively...
and it is breaking out the Triangle formation...
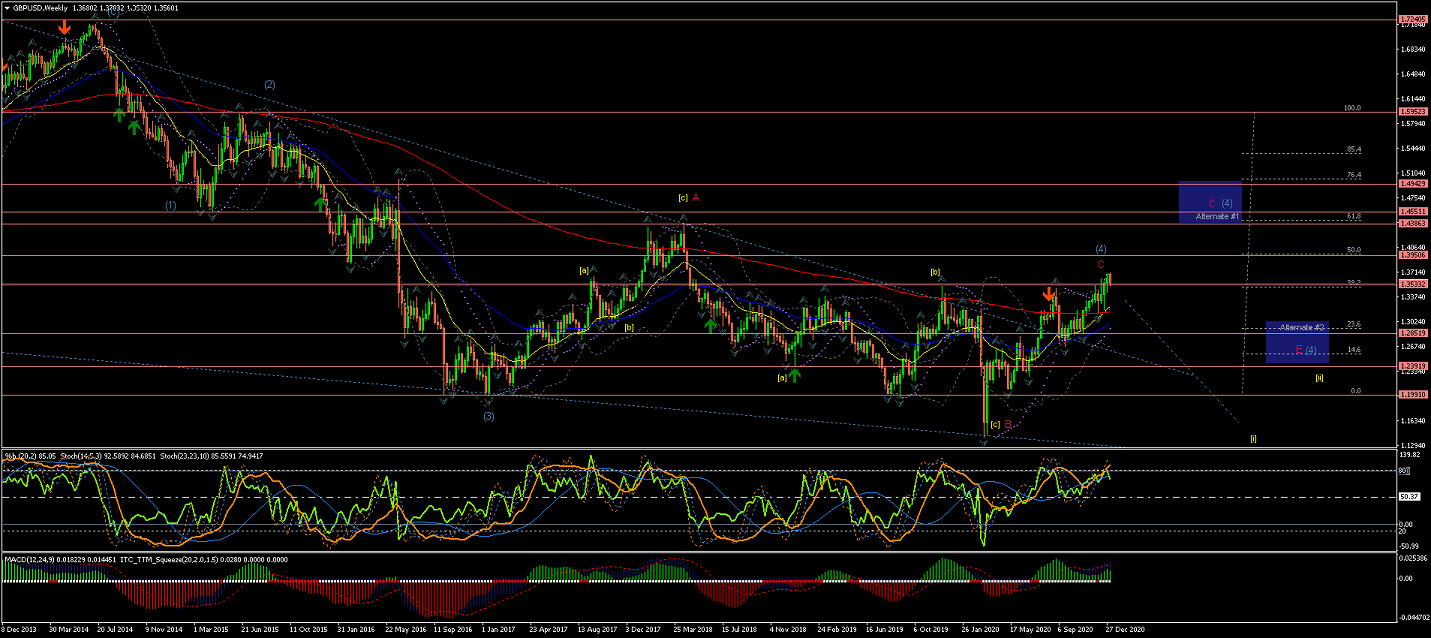
GBPUSD
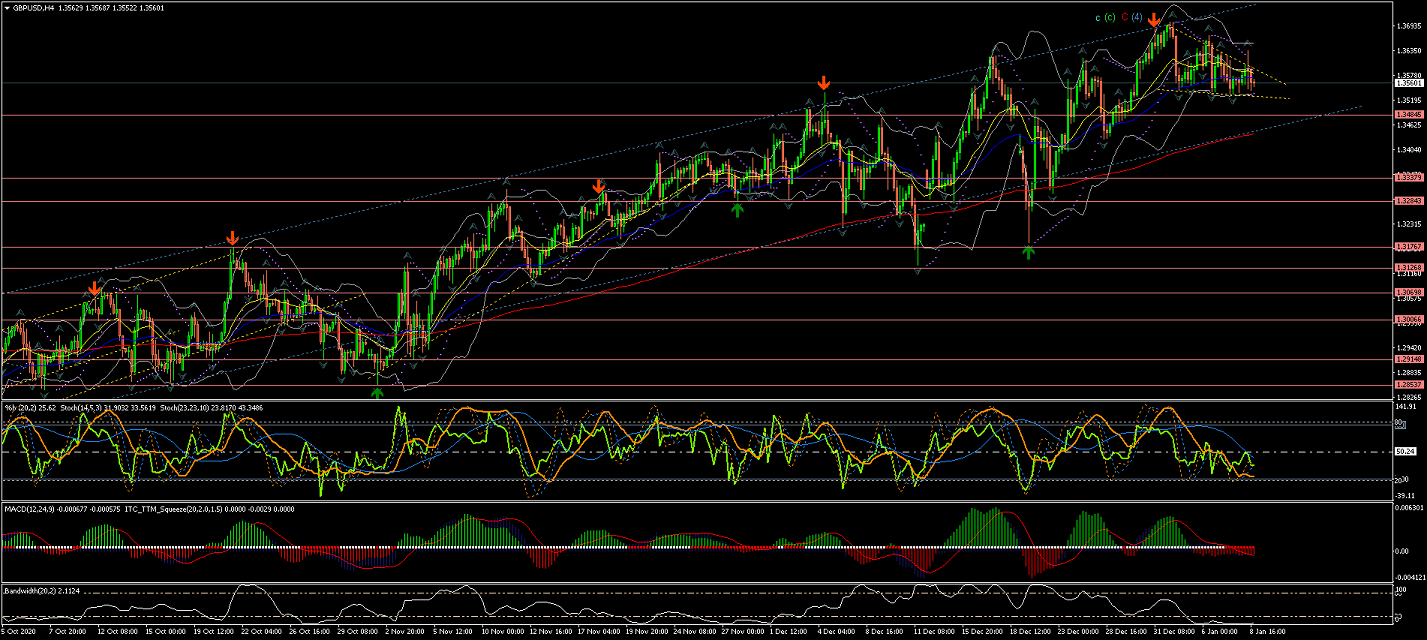
Weekly chart shows an extended Wave (4) correction hitting and rejecting the 200EMA,
although the price has crossed the 200EMA again...
At this point the price could start coming down lower to start Wave (5) or continue higher as Alternate #1 suggests.
(Note Alternate #1 for a possible larger Wave (4) developing across the 200EMA).
Daily Chart is showing the Wave C(red) completing Wave (4) in what should then be a false breakout
of this long term triangle formation (blue long-term trendline).
If this is a false breakout the moves could start bringing the price down impulsively, if it re-enters the blue long-term trendline.
Next, if this count is correct, we should expect the price to continue the moves down impulsively for Wave (5)...
But the price still needs to breakout of the current tight Ascending Range formation that it is now and cross the EMAs...
4Hour Chart shows Wave (4) correction extended and sitting just below the 50EMA after lingering at the upper trendline of the current Range formation yet again...
Next, I would wait for the price to confirm the start of Wave (5), before committing to short positions.
(i.e. breaking current Market Structure (blue trendline) to the downside)
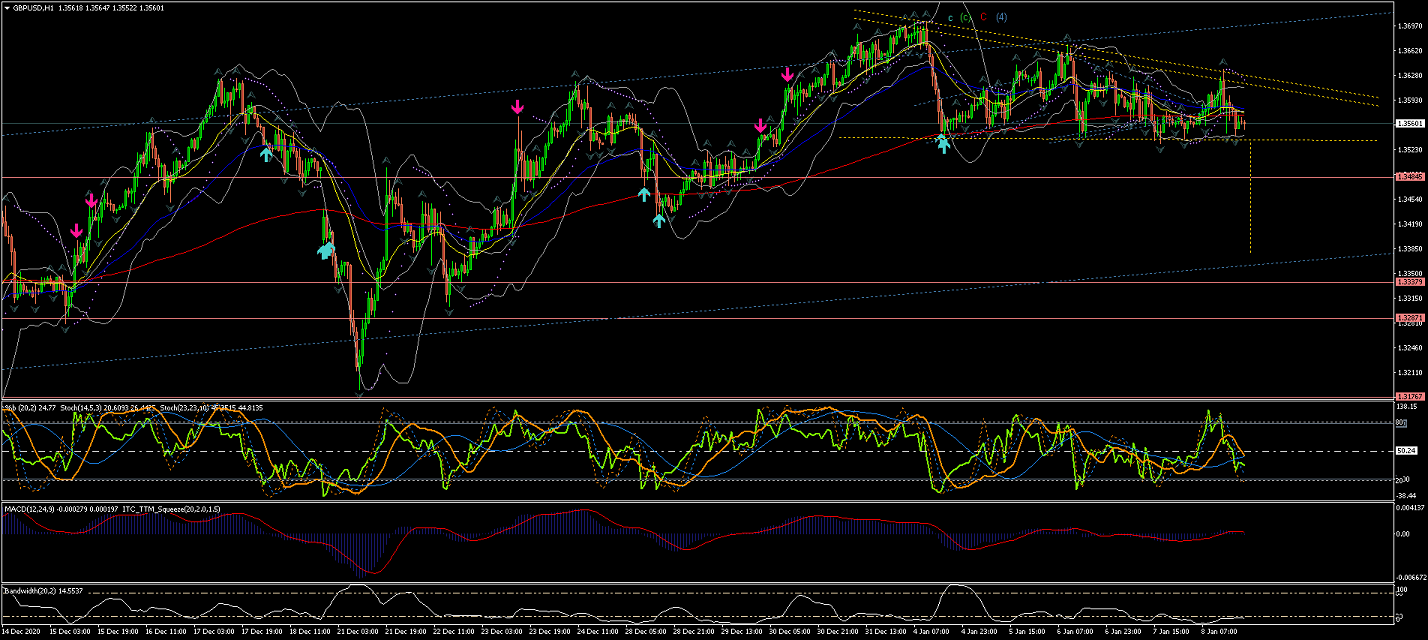
60Min Chart is showing the price lingering below the EMAs within this Descending Triangle formation...
which could lead to a breakout towards the lower long-term Trendline (blue).
All the best for everyone and please do not hesitate to contact me if you have any questions or comments.
Andres
info@tradingwaves.org
Please be aware: that these Analysis are own opinions, not Trading advice; Trading carries a high level of risk, and may not be suitable for all investors. Before deciding to trade you should carefully consider your investment objectives, level of experience, and risk appetite.


 Trading Waves .org