Fri 30-10-2020
Hi everyone, hope you are all great.
Without any further ado... Let's get into it...
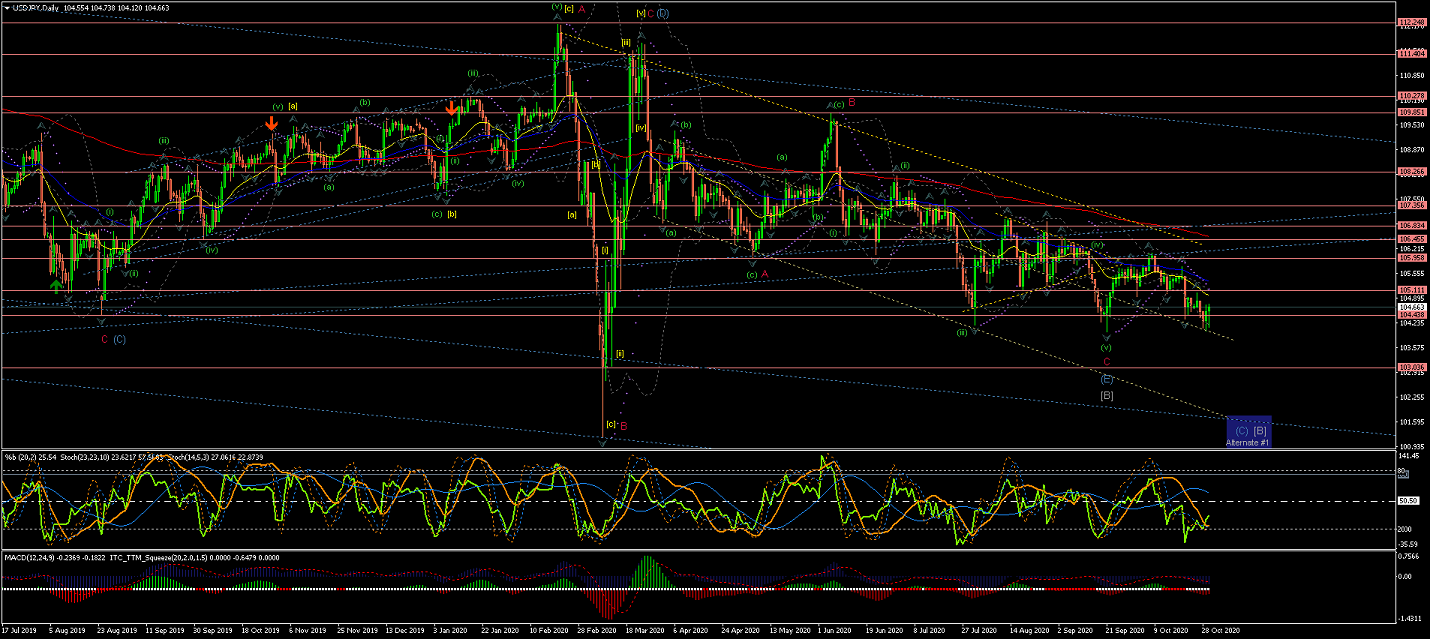
USDJPY
Weekly Chart is showing a quick raise in Wave C(red) to complete Wave (D), seems like another drop for Wave (E) has targeted
the lower triangle trend line, to complete this long term correction... Although we need to be aware of possible further extension to the downside.
A breakout of this long-term triangle to the upside, after the this long-term correction, under the current count,
would suggest the beginning of the start of Wave (1) of a long-term raise.
(a drop across the %50 retracement would favor Alternate #1 count for an extended Wave (C) correction towards the %62)
Daily Chart is showing the current Wave (E) might have been completed within a descending channel.
(where Waves A(red) and B(red) showed 3 internal waves and Wave C(red) shown 5 internal waves move
for an expanded flat correction)
However, the moves continue to be corrective in nature overall, and still below the EMAs, so I wouldn't start long positions yet,
but if the price continues higher and breaks through the upper trend line of the current range
it would increase substantially the probabilities of the start of the new trend up described in the Weekly Chart.
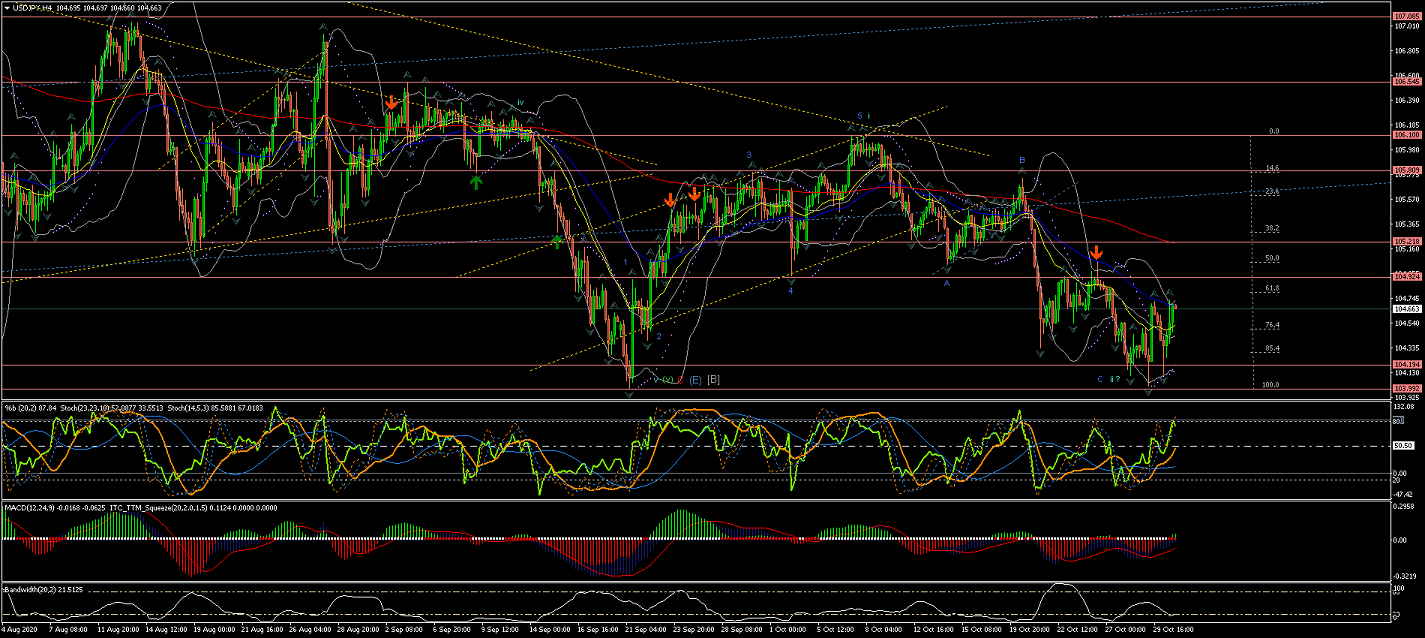
4Hour Chart is pointing at the price already completed the initial Wave i up and its extended corrective Wave ii now underway.
(However, this correction has been lingering just before the 0 retracement level
and any moves below the 0 would invalidate this count for an Extended Wave (E))
Next; if this count is to remain valid, watch for Wave iii to start taking the price up again impulsively.
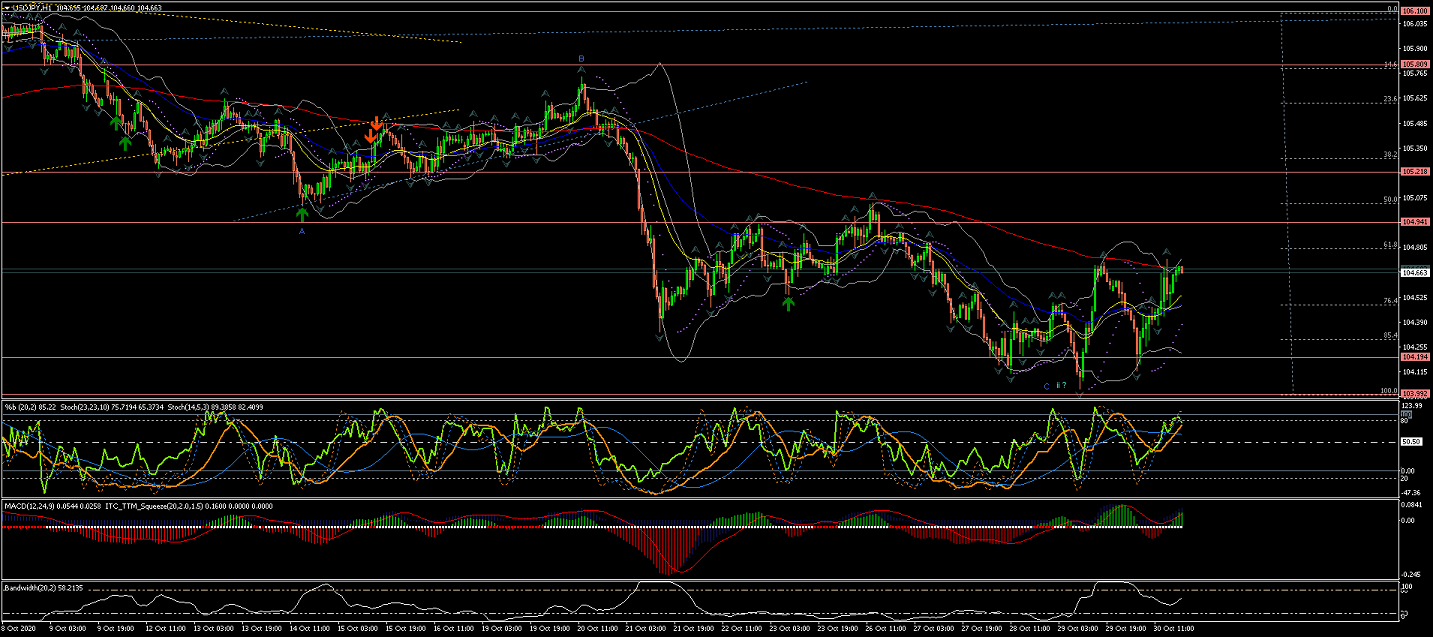
60Min Chart shows Wave ii just crossed above the 200EMA and 50EMA with few impulsive moves after nearly hitting the 0 retracement area.
Watch for potential moves up continuation, in the form of 5 waves up in the lower time frames to confirm the start of Wave iii.
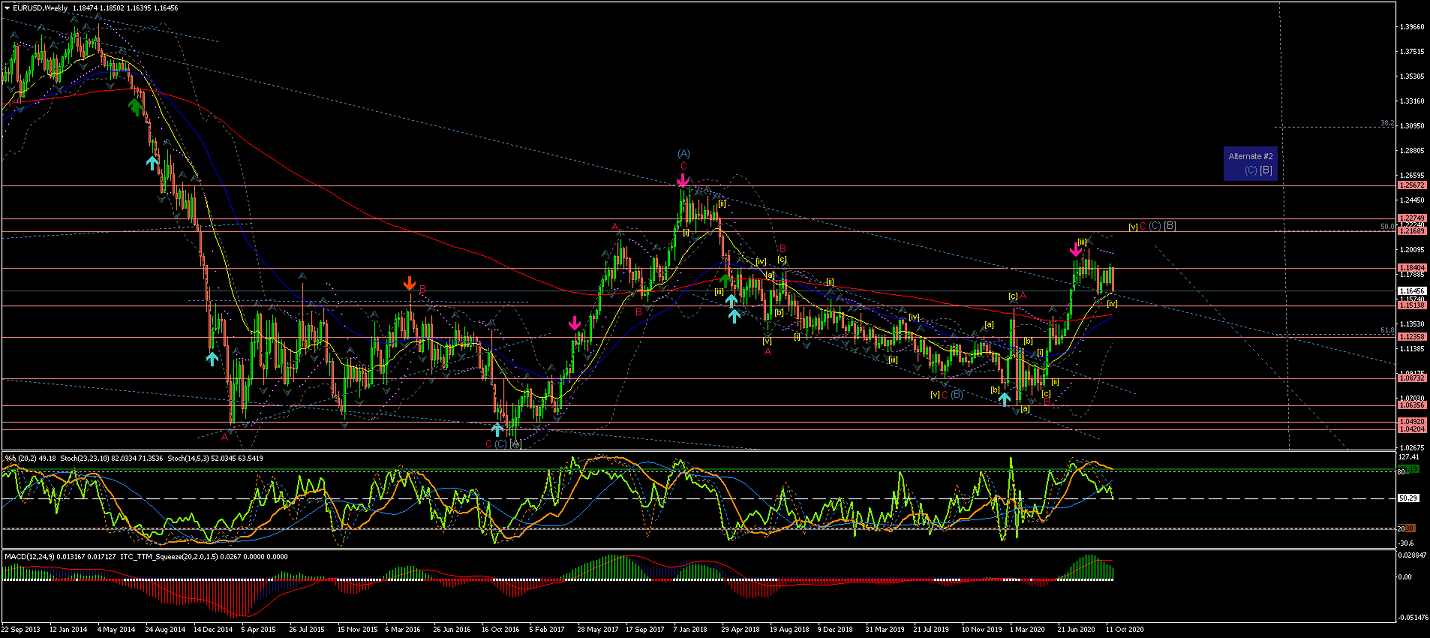
EURUSD
[Please note how last week I have updated all of the EURUSD Charts due to invalidated counts and to reflect a more
simplistic count that could fit better the recent price action.]
Weekly Chart is showing an extended Wave C(red) now at nearly completion of just its internal Wave [v]
to potentially make a last high (unless is a failed Wave [v]).
Notice the Alternate #2 for more extensive correction of long-term Wave [B] to have in mind.
Daily Chart is showing Wave C(red) almost completed in the form of 5 waves
to make for an extended Flat correction, as it broke out of the internal Range and
now is above the upper side of the long-term triangle formation (blue trend line).
Next, I would expect Wave [iv] to confirm completion, possibly at the lower Trend line and 200EMA
And then Wave [v] to make a Raise impulsively to complete Wave C(Red)...
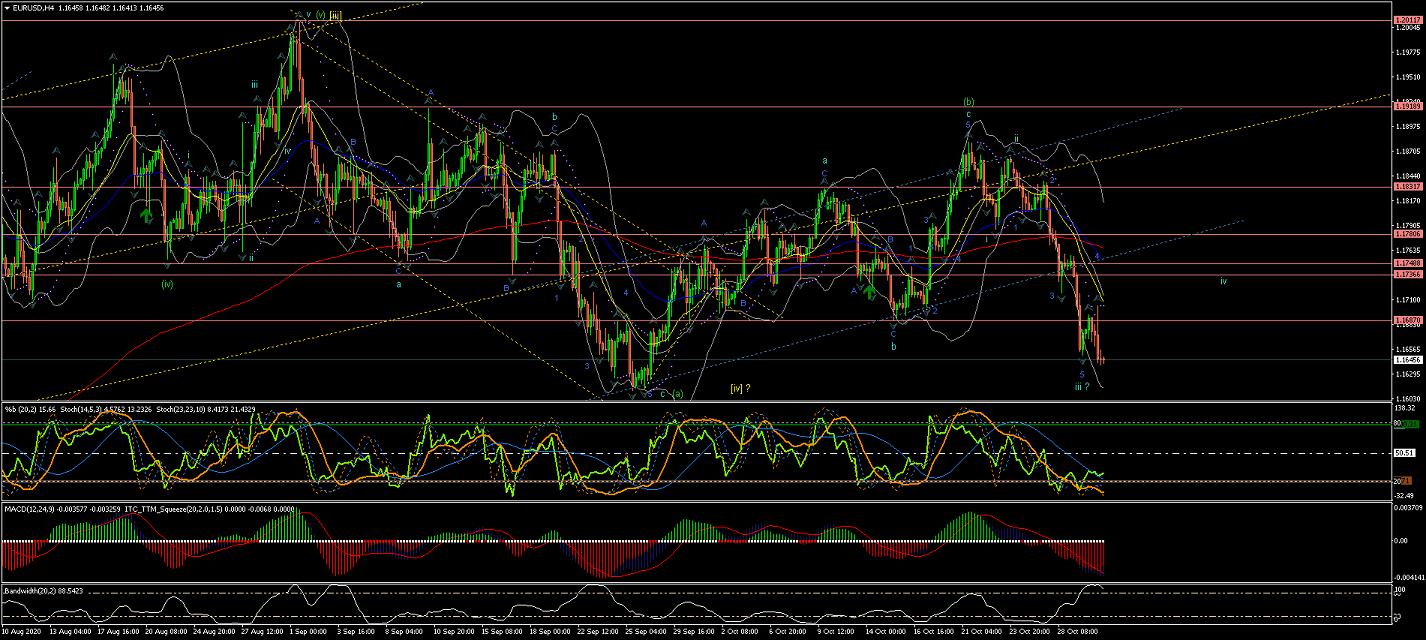
4Hour Chart is showing the price trending within a Range that has been broken to the downside,
and Wave (c) of Wave iv is to complete lower in the form of 5 waves.
And the latest price drop could have completed Wave iii on the way down.
(Alternative count would be for an already completed Wave [iv] (marked as [iv] ?)
in which case the price could have already started Wave [v]... although less likely due to the current price's corrective nature)
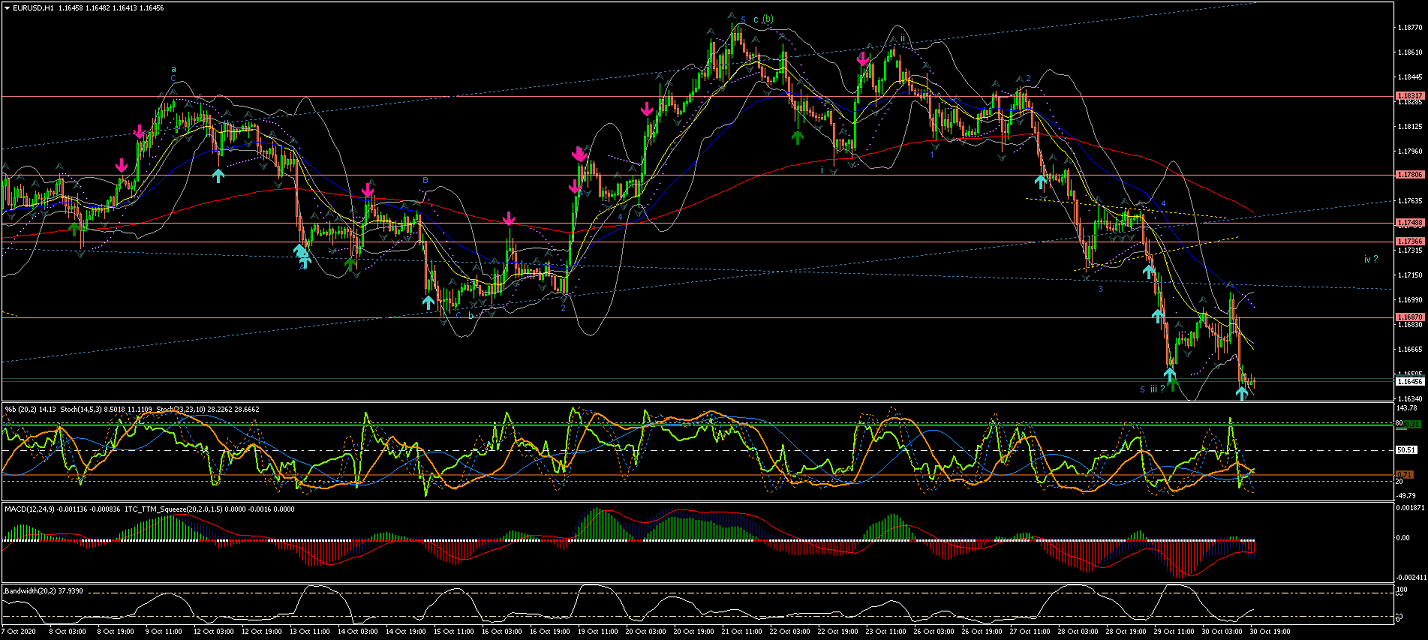
60Min Chart is showing Wave iii possibly completed at the lower trend line of the blue range formation.
So I am expecting the price to develop a Market Structure (i.e. triangle, wedge...) upward and sideways to form Wave iv and possibly offer a nice short opportunity before it breaks again to the downside to complete Wave v.
GBPUSD
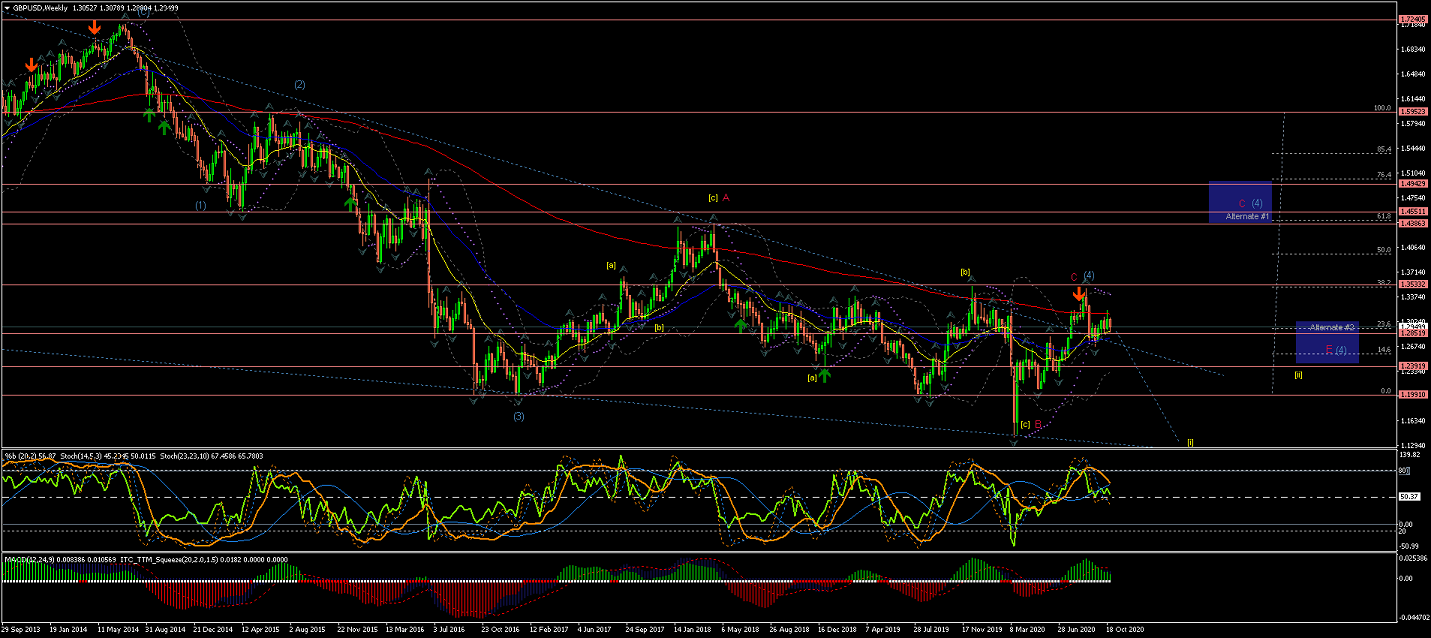
Weekly chart shows an extended Wave (4) correction hitting and rejecting the 200EMA to
potentially put an end to this correction rally.
At this point the price could start coming down lower to start Wave (5) or continue higher as Alternate #1 suggests.
(Note Alternate #1 for a possible larger Wave (4) developing across the 200EMA).
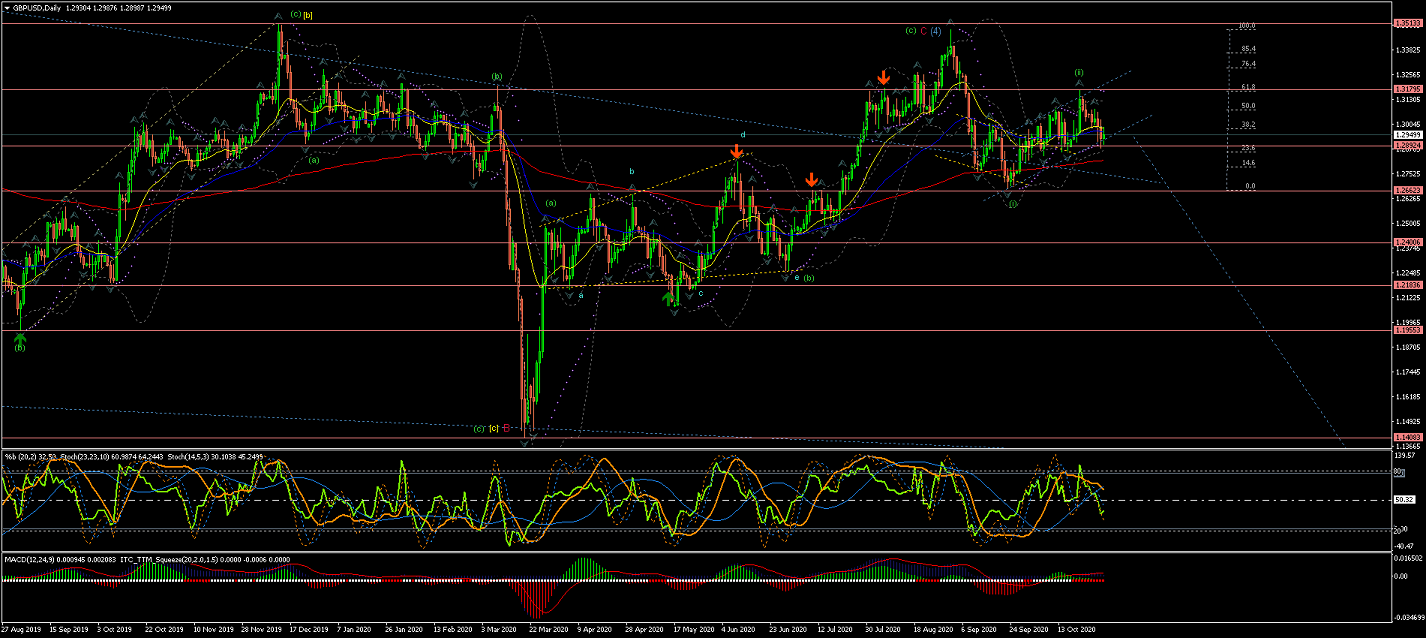
Daily Chart is showing the Wave C(red) completing Wave (4) in what should then be a false breakout
of this long term triangle formation (blue long-term trend line).
Next, if this count is correct, we should expect the price to continue the moves down impulsively for Wave (5) towards
the lower trend line (blue).
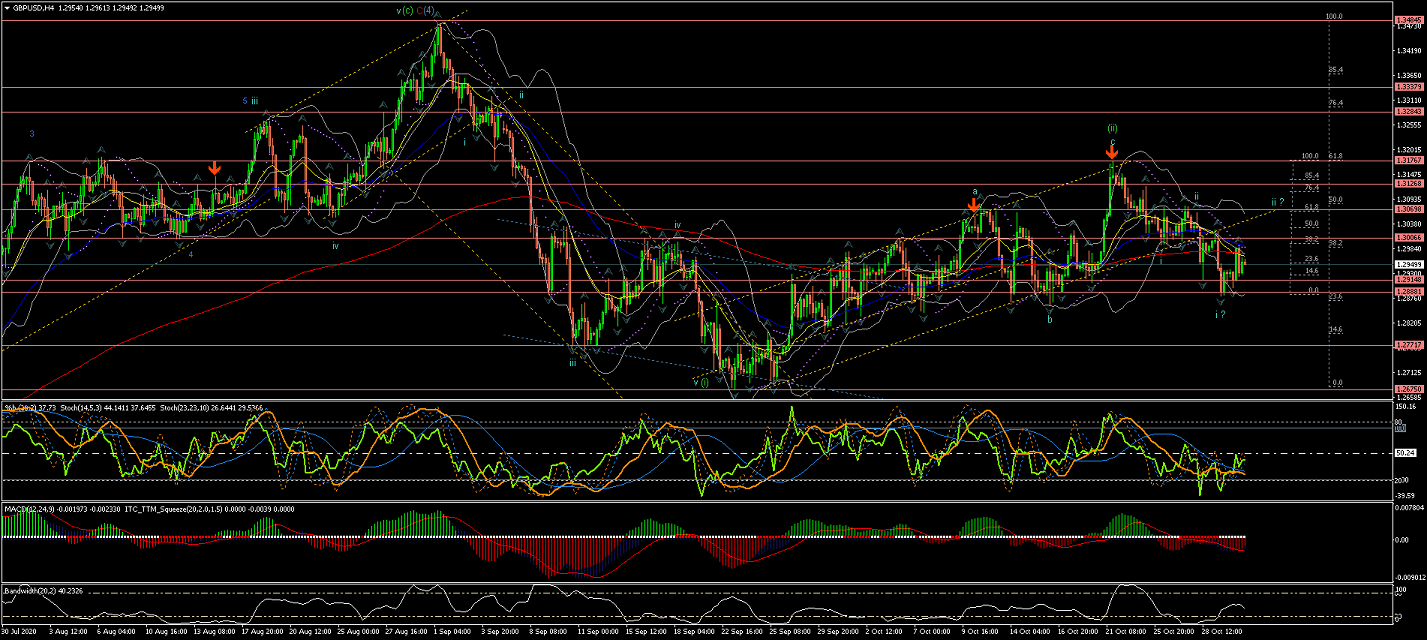
4Hour Chart shows Wave (ii) correction completed at exactly %62 retracement of Wave (i).
The latest move down could now be the initial Waves i and ii of Wave (iii) possibly completed and
a possible start of Wave iii as it breaks out of the recent range.
Next, I would wait for the price to confirm Wave iii and break trough the current levels of support... falling below the EMAs,
before committing to short positions.
60Min Chart is showing Waves i and ii of Wave (iii) possibly completed and
a posible start of Wave iii forming its internal Waves 1 and 2 (blue).
All the best for everyone and please do not hesitate to contact me if you have any questions or comments.
Andres
info@tradingwaves.org
Please be aware: that these Analysis are own opinions, not Trading advice; Trading carries a high level of risk, and may not be suitable for all investors. Before deciding to trade you should carefully consider your investment objectives, level of experience, and risk appetite.


 Trading Waves .org