Fri 24-07-2020
Hi everyone, hope you are all great.
Let's get into it...
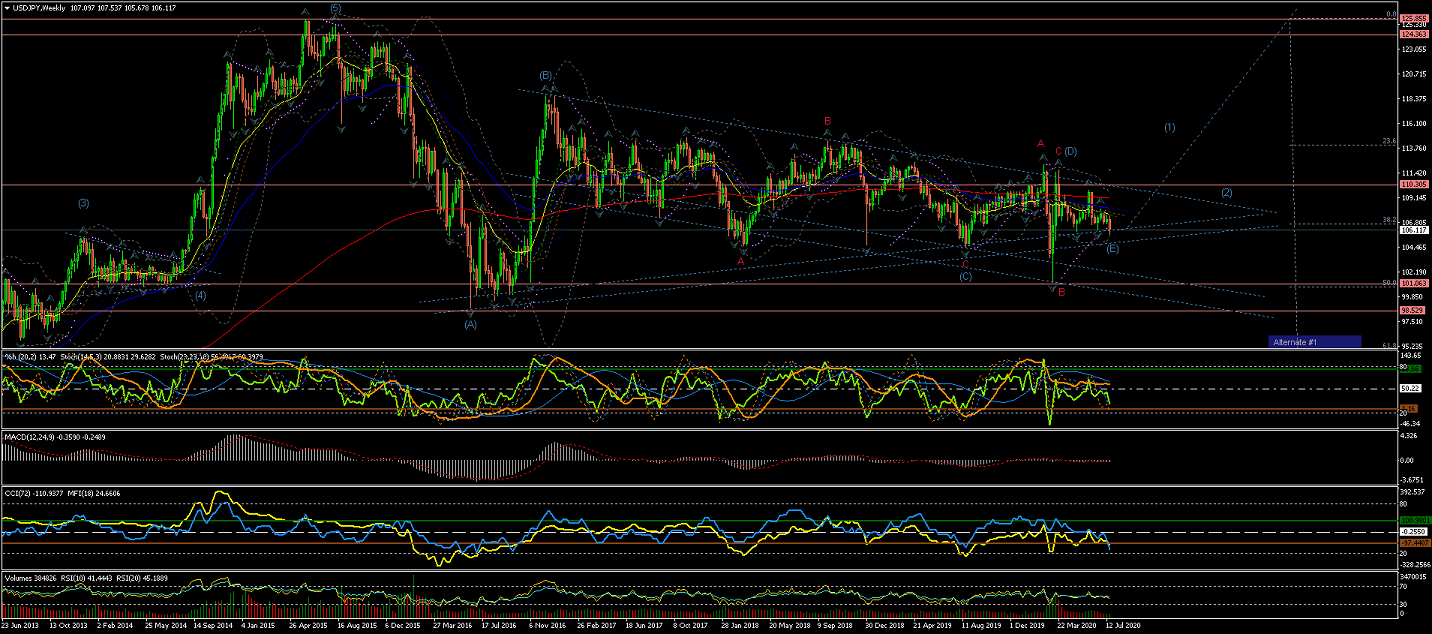
USDJPY
Weekly Chart is showing how a completed Wave B(red) of Wave (D) has, again, reached the %50 retracement of
the 5 waves raised up to year 2015;
And, after a quick raise in Wave C(red) to complete Wave (D), seems like another drop for Wave (E) should target
the lower triangle trendline or possibly cross it, to complete this long term correction.
A breakout of this long-term triangle, after the correction under the current count,
would suggest the beginning of the start of Wave (1) of a long-term raise.
(a drop across the %50 retracement would favor Alternate #1 count for an extended Wave (C) correction towards the %62)
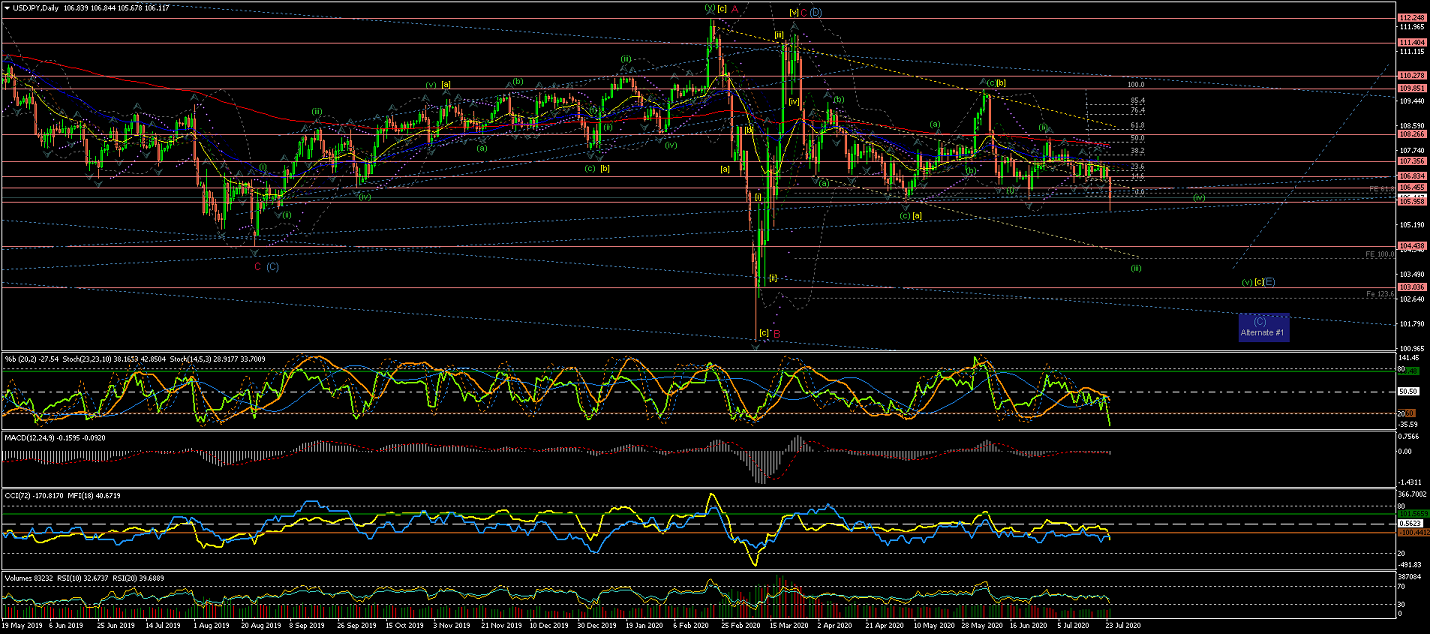
Daily Chart is showing the current Wave (E) now on the way towards the lower trendline (blue)
and possibly to cross it to lower support levels.
As per current count, expect the price to continue to drop in 5 waves to complete
Wave (E) as an extended Flat correction (3,3,5).
(where Waves [a] and [b] are showing 3 internal waves and Wave [c] should be a 5 internal waves move
for an expanded flat correction)
4Hour Chart showing Wave (i) down as the start of 5 waves also completed.
And Wave (ii) showing that has been completed at the %50 retracement level of Wave (i).
Now Wave (iii) has already developed most of its internal Waves; With its internal Waves(blue) 1, 2 & 3 possibly completed, and Wave 4(blue) now heading up to test resistance levels.
60Min Chart shows Waves (blue) 1, 2 and 3 potentially completed and the possible start of Wave 4 correction to the upside to test the long-term trendline(blue) as the main resistance area at this point.
Once Wave 4(blue) correction concludes, expect more moves to the downside to complete Wave 5(blue) of Wave iii.
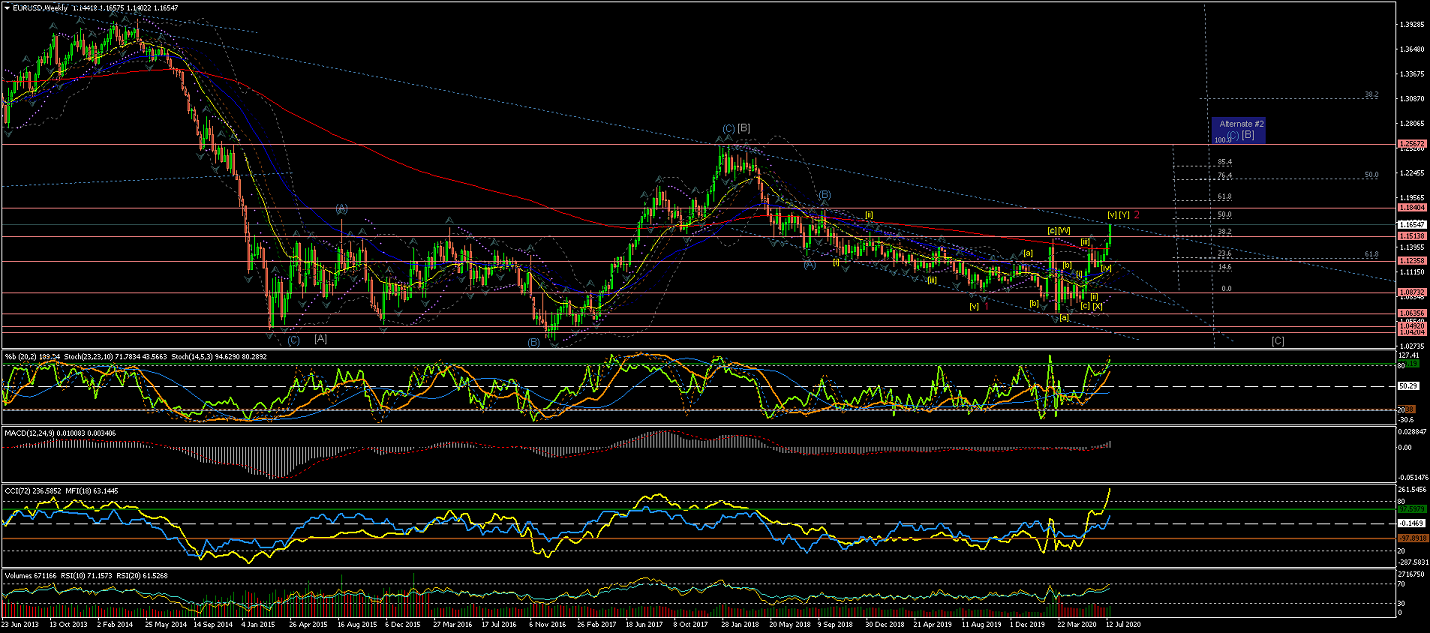
EURUSD
Weekly Chart is showing how previously marked Alternate #1 has been triggered for an extended Wave 2(red)
now reaching almost %50 retracement of Wave 1(red).
Notice the Alternate #2 for more extensive correction of long-term Wave [b] to have in mind, although unlikely.
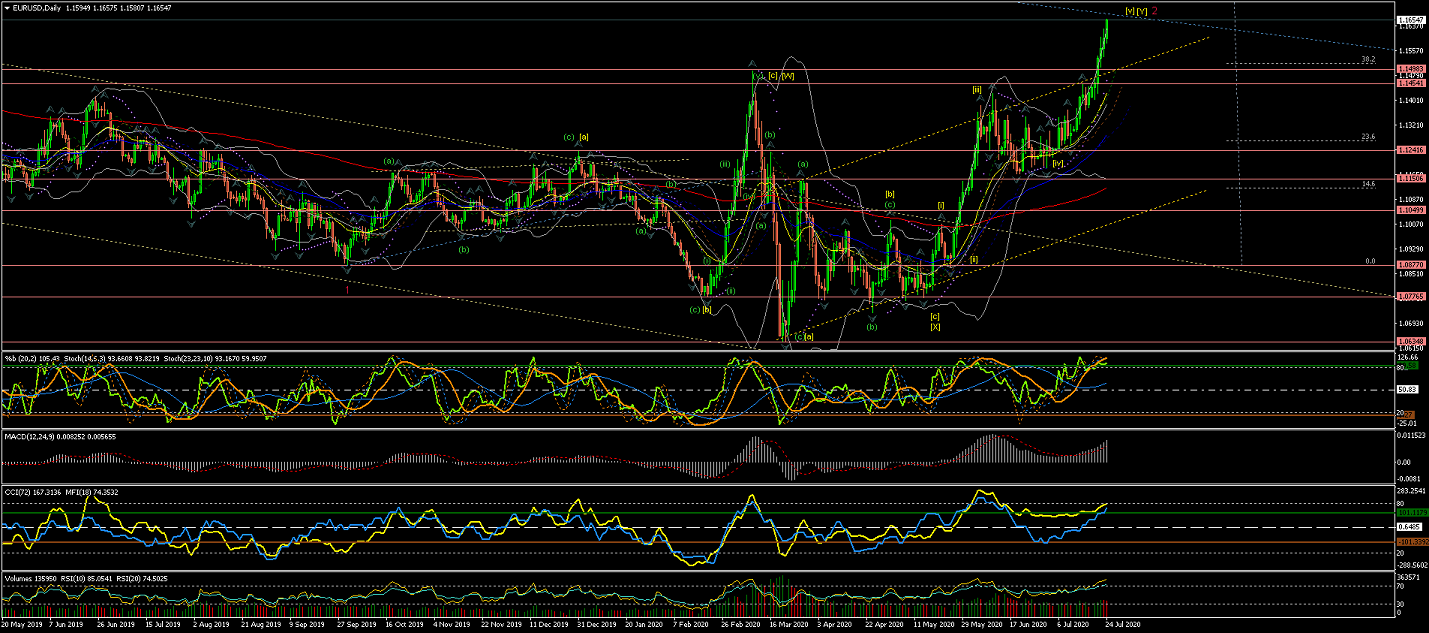
Daily Chart is showing Wave 2(red) almost reaching the %50 retracement in the form of 5 waves
to make for an extended Flat correction, as it broke out of the internal Range and now is very close to the upper side of the long-term triangle formation.
Next, I would expect the start of Wave 3(red) with impulsive waves down.
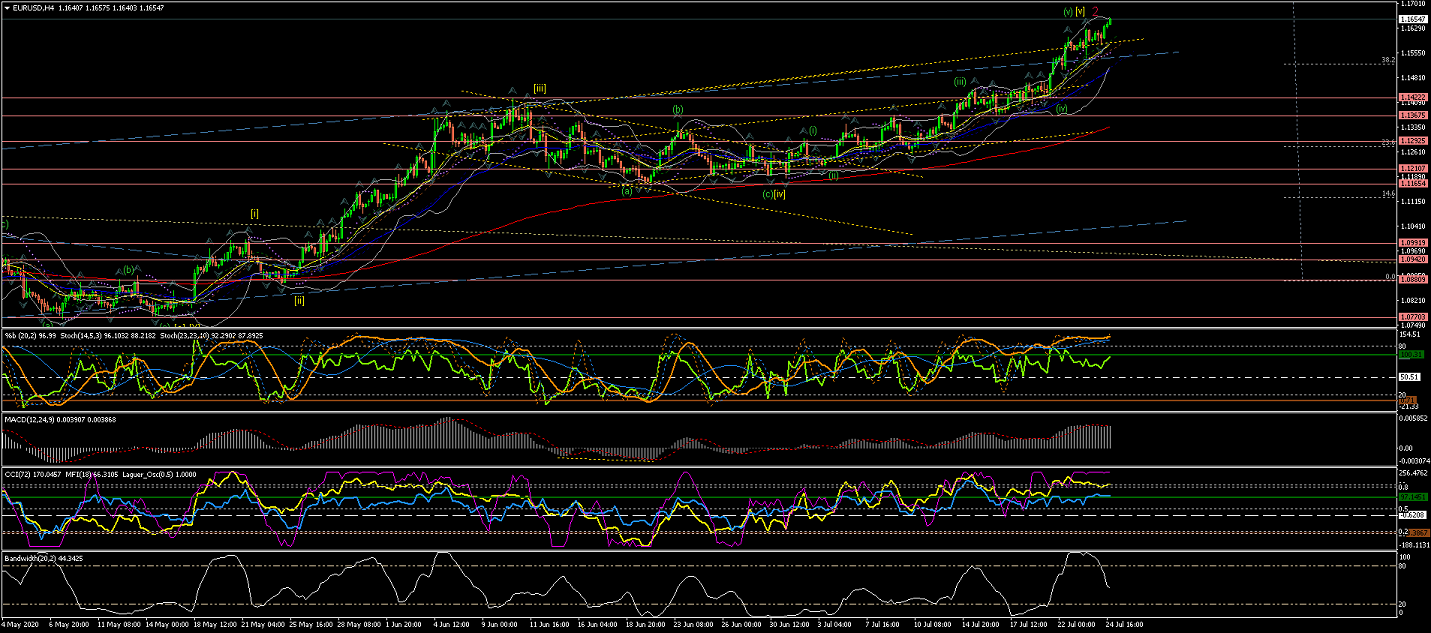
4Hour Chart is showing Wave [v] of Wave 2(red) being extended with 5 internal Waves that
have not shown completion yet.
(Where Wave 2(red) correction retraced nearly %50 of the length of Wave 1(red))
Next, once Wave 2(red) correction is confirmed completed, we should expect Wave 3(red) to start
bringing the price lower across the 200EMA and previous support levels.
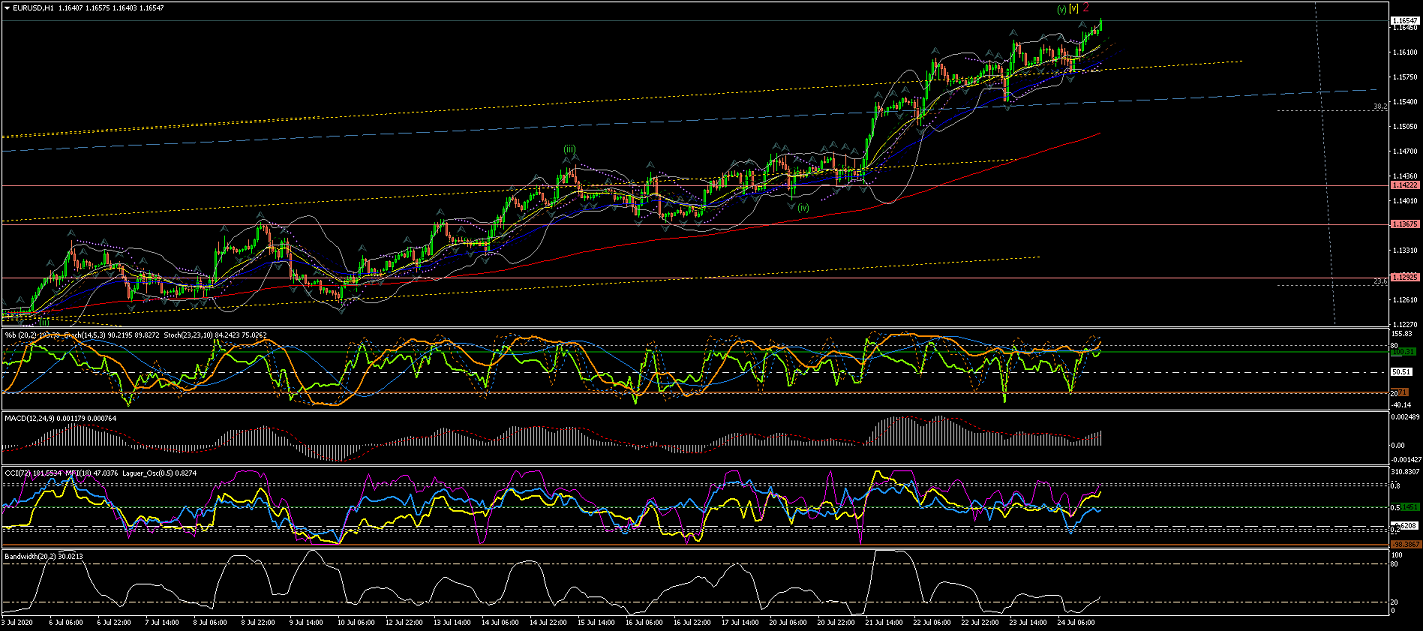
60Min Chart is showing Wave 2(red) still rallying in its internal Wave [v].
Next, once Wave 2(red) confirms completed.....
further moves should show the start of Wave 3(red) moving down impulsively.
GBPUSD
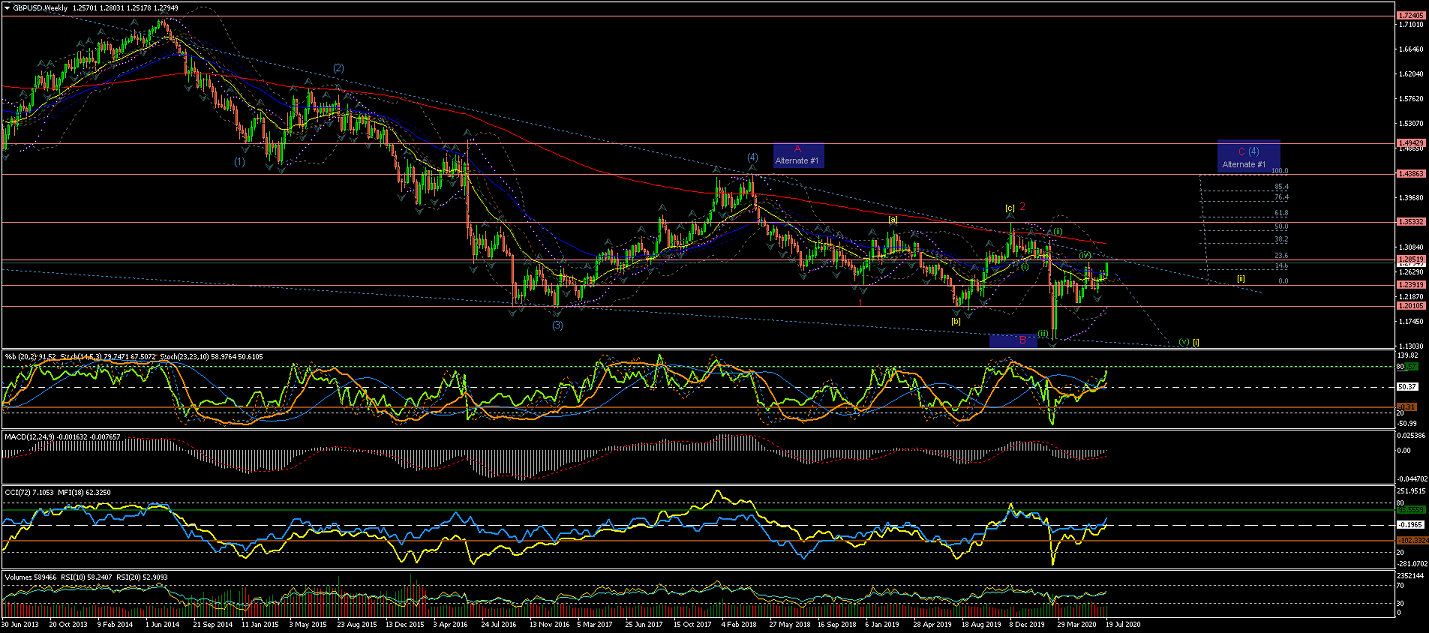
Weekly chart shows Wave 1(red) and a Wave 2(red) correction completed at the 200EMA level with a retracement
between %50 and %62 level.
From there the price showed an impulsive move down that was rejected by the lower trendline;
A move that suggest the initial waves of Wave [i] of Wave 3(red) starting to develop.
Note Alternate #1 for a possible larger Wave (4) developing.
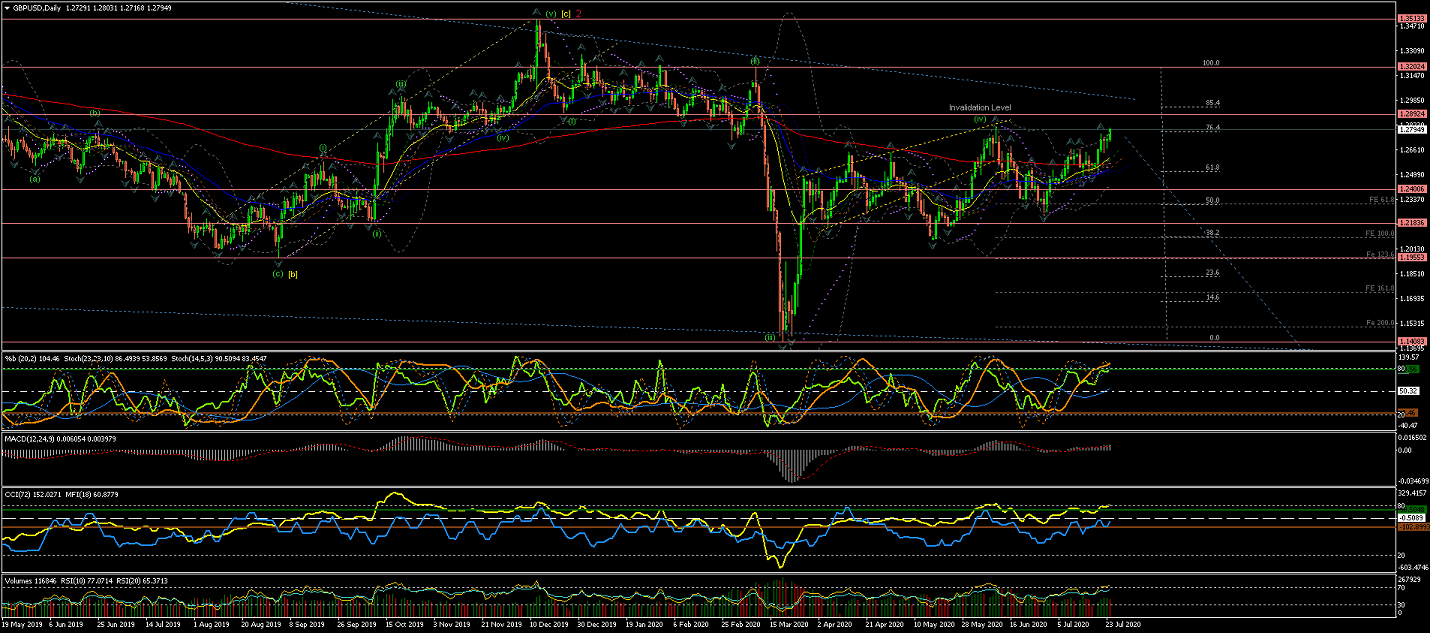
Daily Chart is showing the current corrective move like an odd lengthy Wave (iv) correction
that has now reached, and passed slightly the %76 retracement of Wave (iii);
(1.28900 area remains this count's Invalidation level - As the lowest of Wave (i)).
Next, we should expect, the price to continue the moves down impulsively on Wave (v) towards the lower trendline.
(otherwise the Alternate count #1 would be triggered)
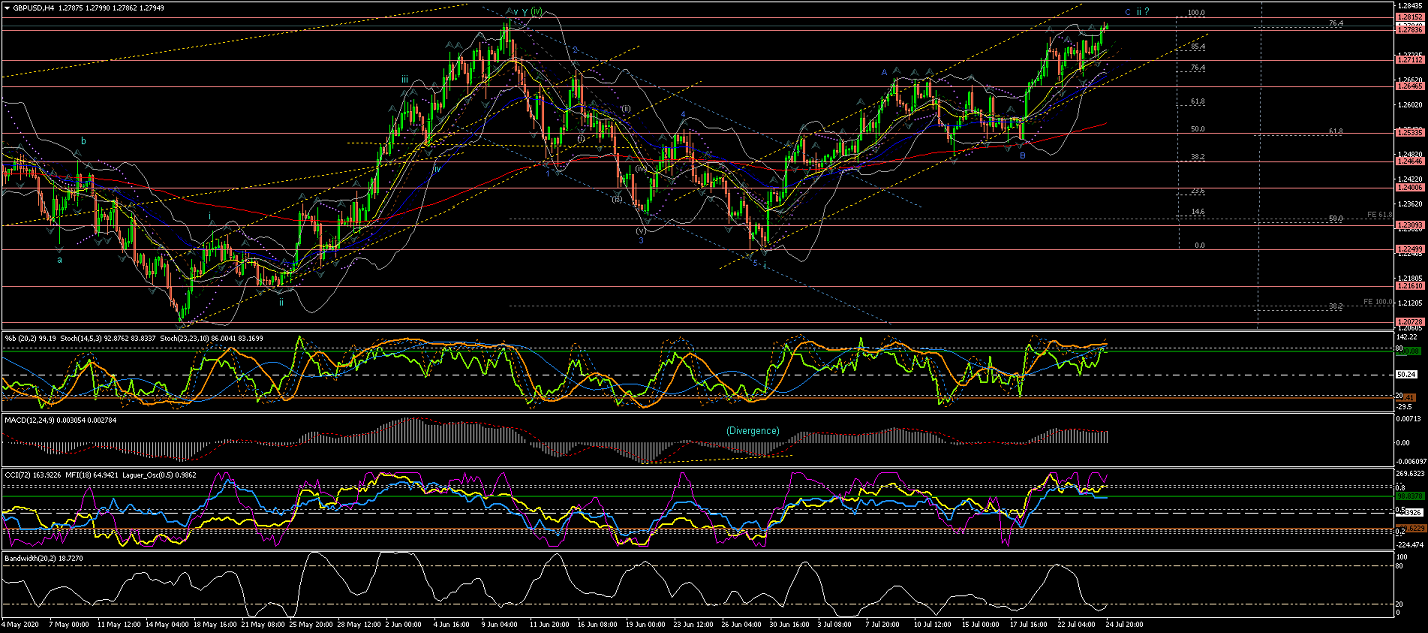
4Hour Chart shows Wave (iv) possibly completed and developed a channel to the downside that
formed 5 waves to complete Wave i.
Corrective Wave ii could have been completed now at nearly 0 retracement of Wave i
(any moves further than this 0 would invalidate this count)
So next, as per current count, expect the price to continue the drop and fall below the 200EMA.
60Min Chart just shows more in detailed the potential end of Wave ii... or current count invalidation area....
All the best for everyone and please do not hesitate to contact me if you have any questions or comments.
Andres
info@tradingwaves.org
Please be aware: that these Analysis are own opinions, not Trading advice; Trading carries a high level of risk, and may not be suitable for all investors. Before deciding to trade you should carefully consider your investment objectives, level of experience, and risk appetite.


 Trading Waves .org