Fri 10-07-2020
Hi everyone, hope you are all great.
Let's get into it...
USDJPY
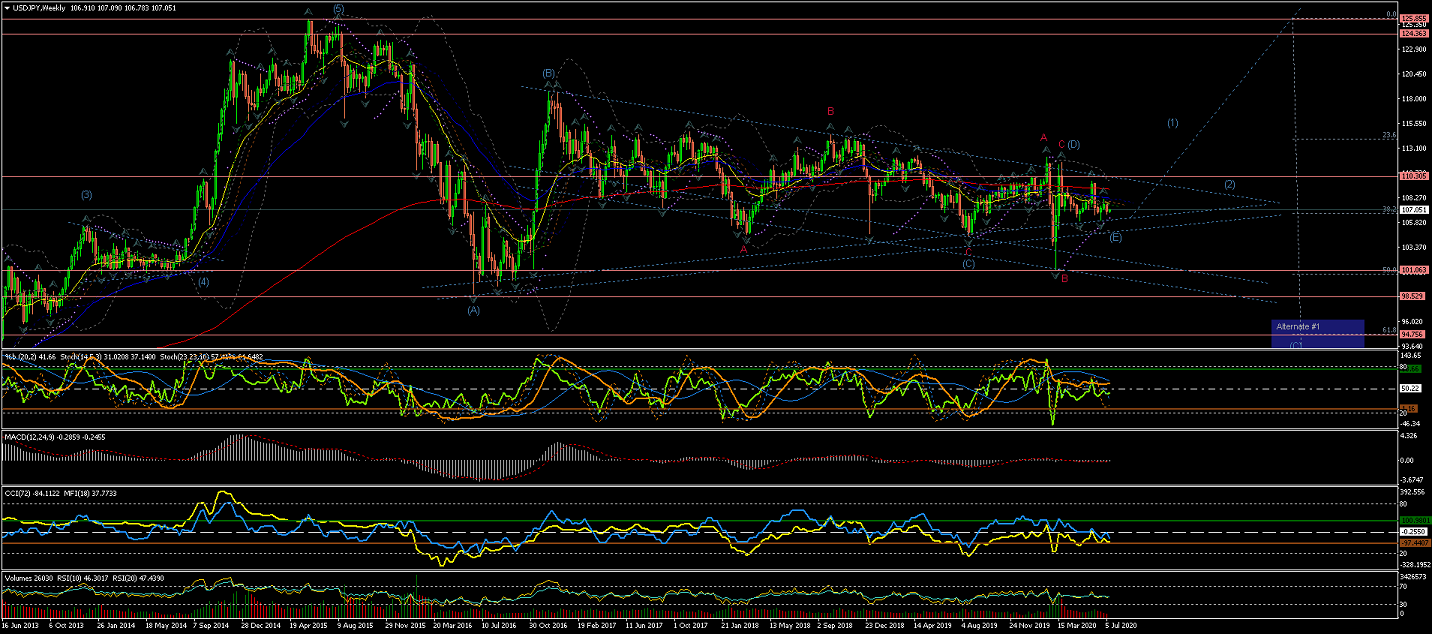
Weekly Chart is showing how a completed Wave B(red) of Wave (D) has, again, reached the %50 retracement of
the 5 waves raised up to year 2015;
And, after a quick raise in Wave C(red) to complete Wave (D), seems like another drop for Wave (E) should target
the lower triangle trendline or possibly cross it, to complete this long term correction.
A breakout of this long-term triangle, after the correction under the current count,
would suggest the beginning of the start of Wave (1) of a long-term raise.
(a drop across the %50 retracement would favor Alternate #1 count for an extended Wave (C) correction towards the %62)
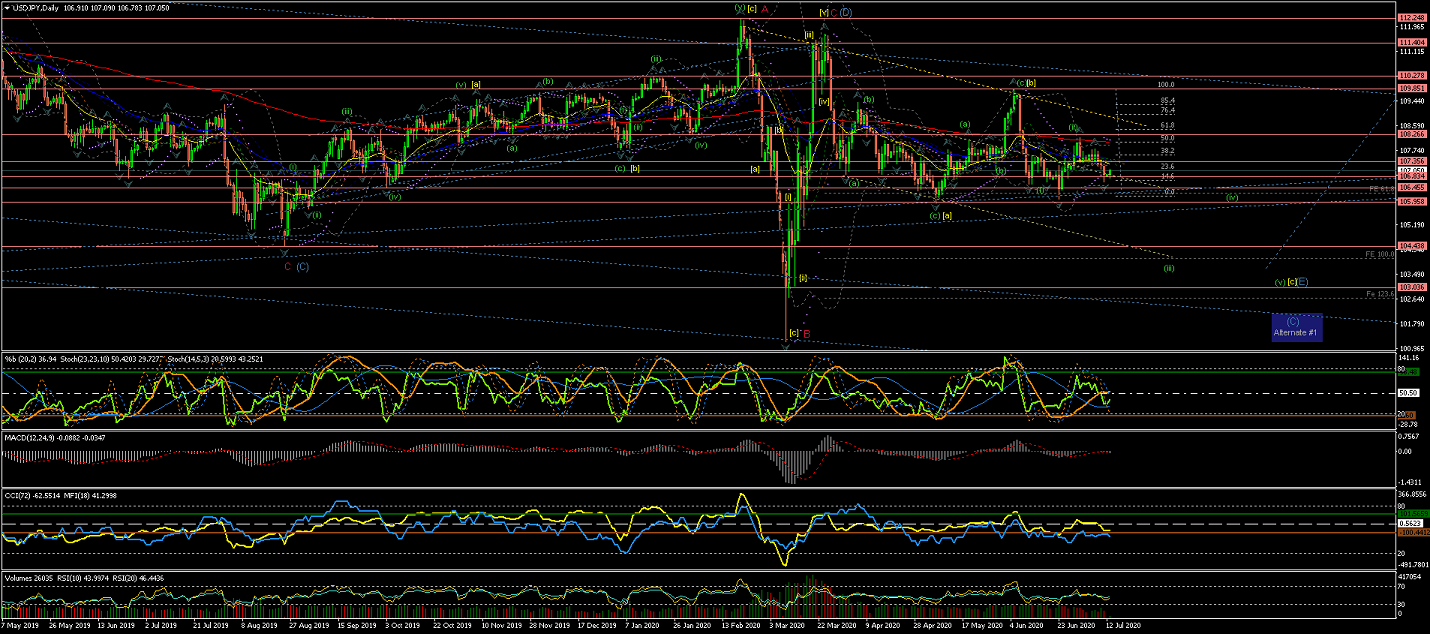
Daily Chart is showing the current Wave (E) now on the way towards the lower trendline (blue)
and possibly to cross it to lower support levels.
As per current count, expect the price to continue to drop in 5 waves to complete
Wave (E) as an extended Flat correction (3,3,5).
(where Waves [a] and [b] are showing 3 internal waves and Wave [c] should be a 5 internal waves move
for an expanded flat correction)
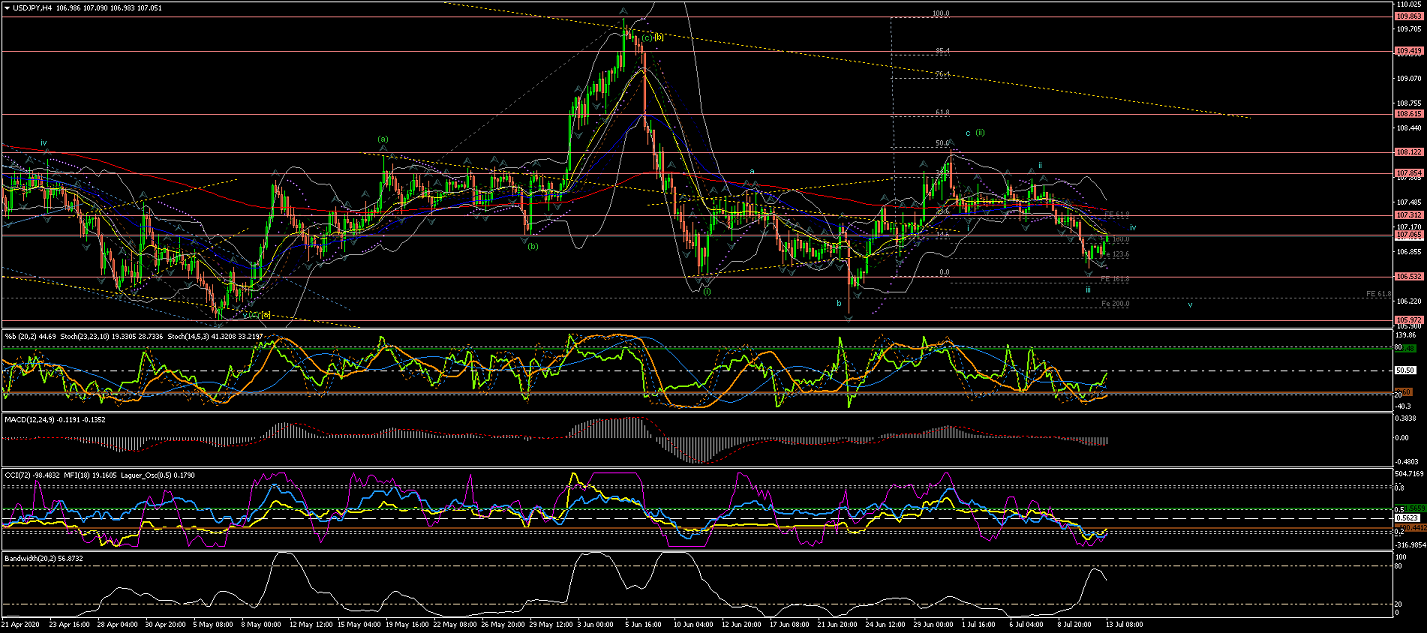
4Hour Chart showing more in detail the internal waves of Wave [b] of (E) completed (in 5 and 3 waves respectively)
The Wave (i) down as the start of 5 waves also completed, as mentioned in the Daily Chart comments.
And Wave (ii) showing that could have been completed at the %50 retracement level.
Next expect the price to drop impulsively to confirm Wave (iii) has started; With its internal Waves i, ii and ii possibly completed, and iv correction on the way.
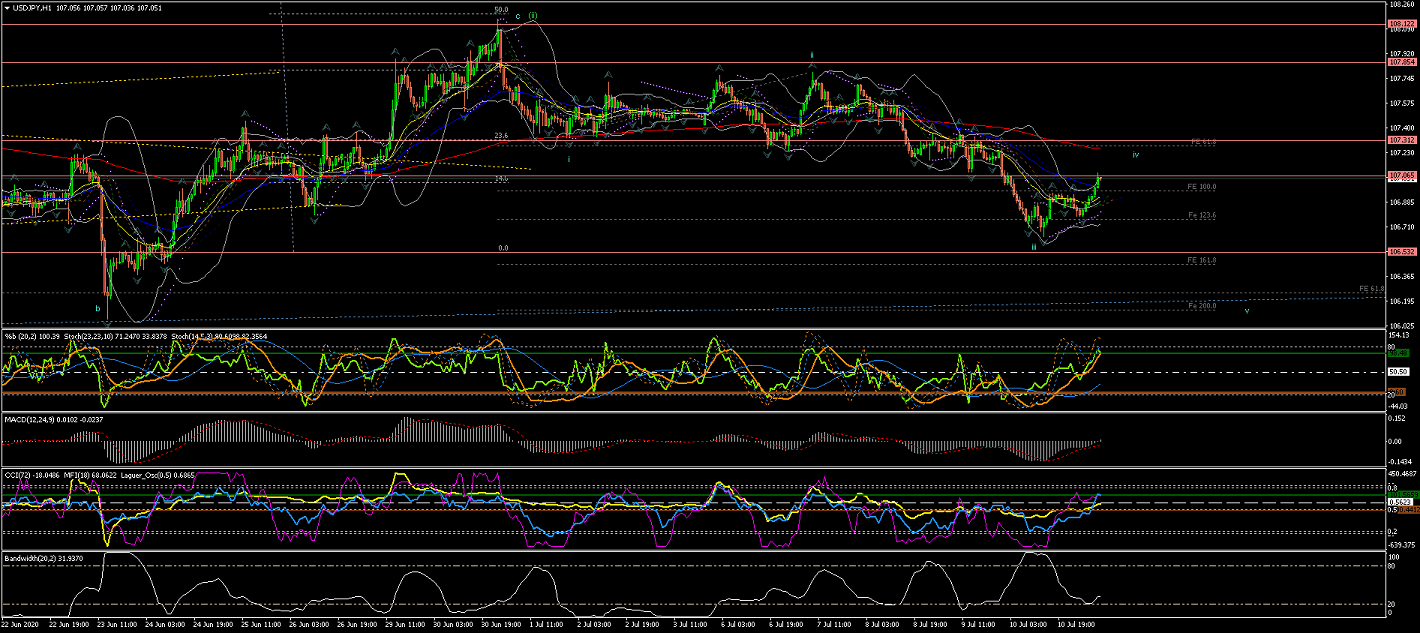
60Min Chart shows Wave (ii) reaching the %50 retracement level at 108.122 and the price reacting impulsively to the downside at that point:
An initial indication that Wave (iii) could have started its initial first internal wave.
Next, Wave (iii) should continue bringing the price impulsively to the downside
breaking through support levels and EMAs for the start of the new trend.
At the moment Wave (iii) could have formed its internal Wave i, ii and iii and iv correction under development.
So, after the current correction completes, watch for impulsive waves down to break through previous lows to confirm Wave v.
EURUSD
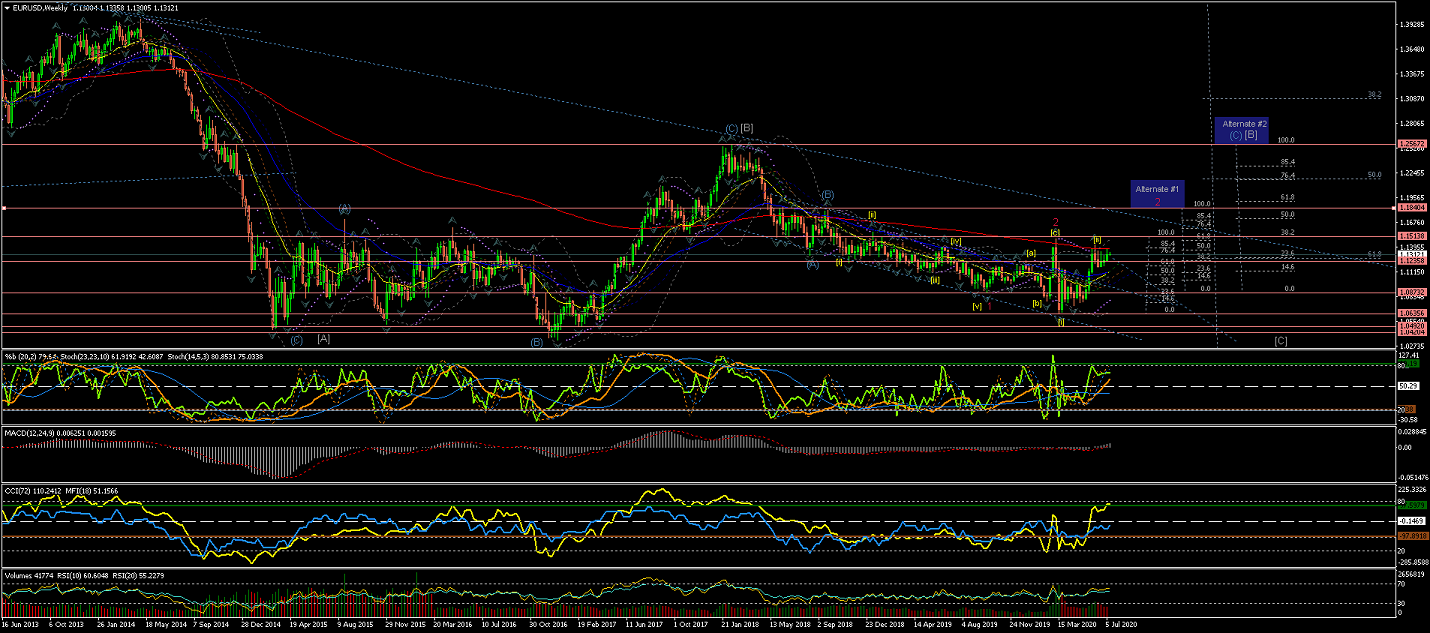
Weekly Chart, under the current interpretation,
shows a Wave 2(red) crossing nearly the %38 retracement of Wave 1(red)
and now an extended Wave [ii] appearing to be completed (judging by the recent candles)
at the 200EMA and %85 retracement of Wave [i] of Wave 3(red).
Notice the Alternate counts #1 & #2 for alternatives more extensive corrections of Wave 1 (red) and
long-term Wave [b] respectively to have in mind.
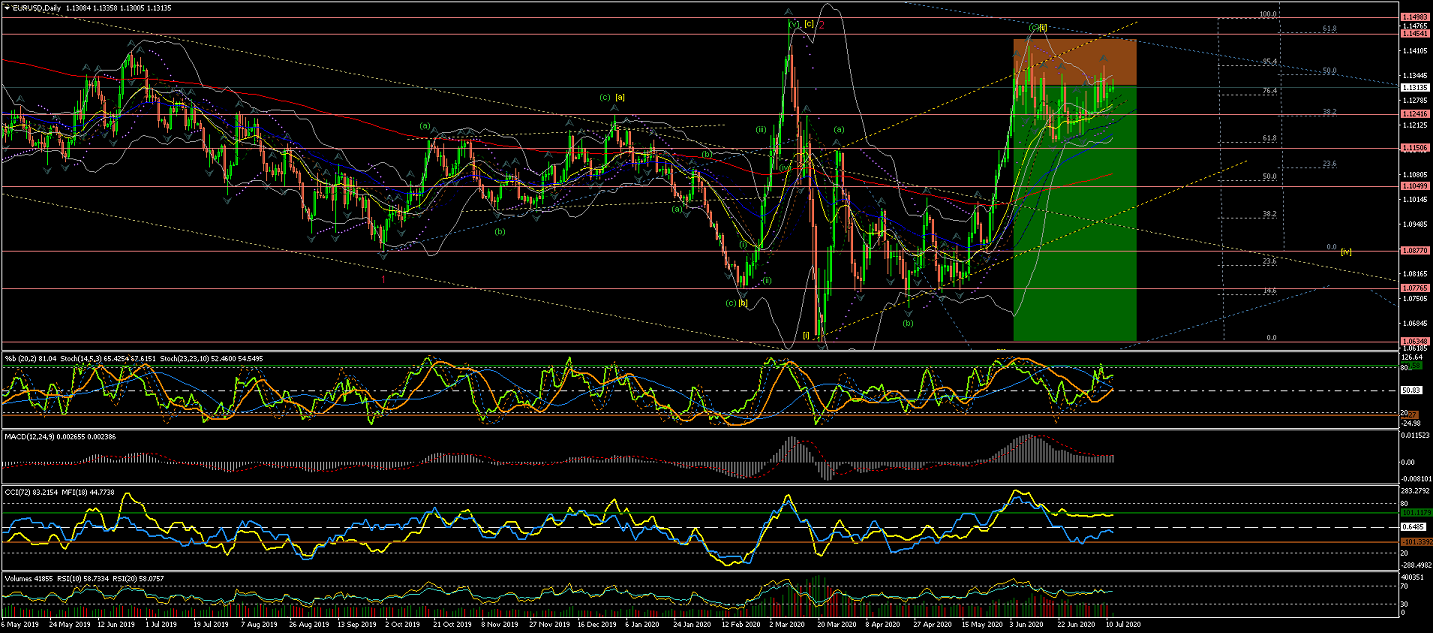
Daily Chart is showing Wave [ii] made an extended correction
and retracing over the %85 retracement level, as the top of the current range formation.
The moves seem still to be corrective; so there is not impulsive moves down that can
clearly identify the start of Wave [iii] yet.
Further impulsive waves down will give more weight to the current count for Wave [iii] start,
and, hence, a start for a long move to the downside.
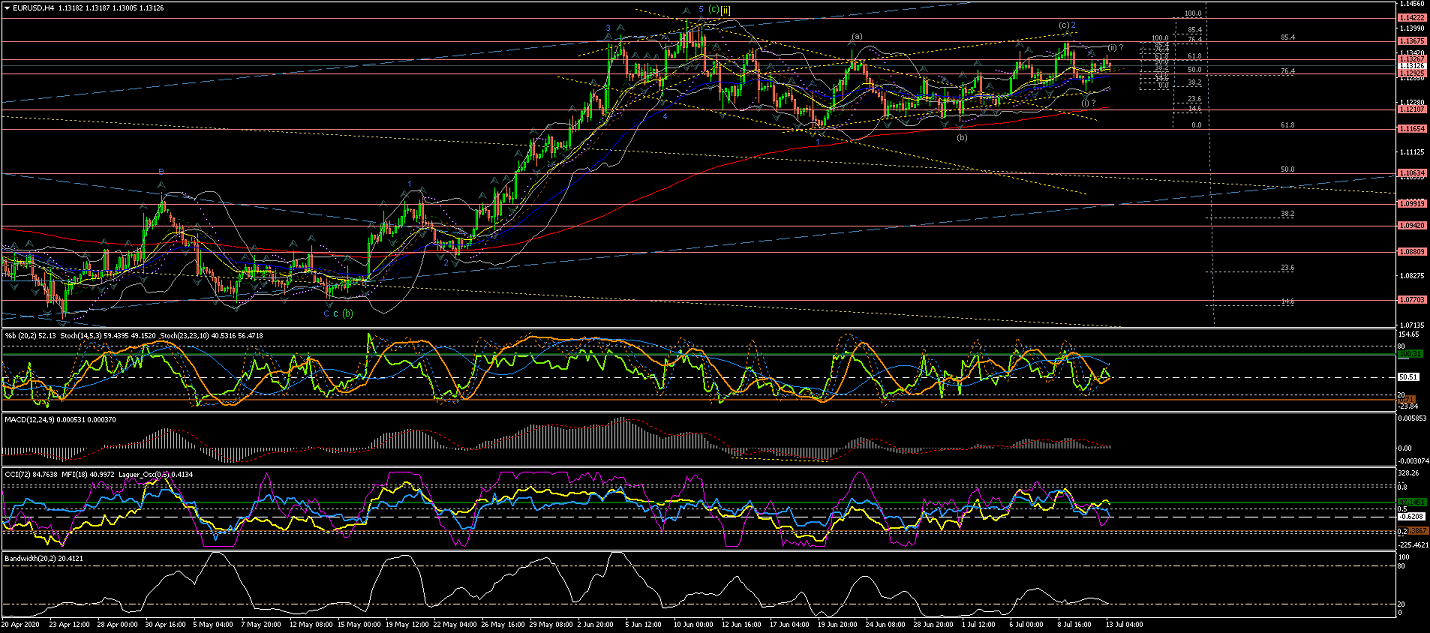
4Hour Chart is showing a Wave 1(blue) and Wave 2(blue) of Wave (i) of Wave [iii] possibly completed.
(Where Wave 2(blue) correction retraced %76 of the length of Wave 1(blue))
And now Wave 3(blue) could be developing its initial first internal waves (i) and (ii).
Next, once Wave (ii) correction is confirmed completed, we should expect Wave (iii) of Wave 3(blue) to continue
bringing the price lower across the 200EMA and previous support levels, towards the lower trend channel (blue).
60Min Chart is showing the internal Waves of Wave 1(blue) and 2(blue) possibly completed.
Then the hint of the start of Wave 3(blue) with an impulsive Wave (i) and a move in 3 waves that could be interpreted as Wave (ii) completed at just above %68 retracement.
Next, once Wave(ii) confirms completed..... further moves would show Wave (iii) of Wave 3(blue) moving down impulsively.
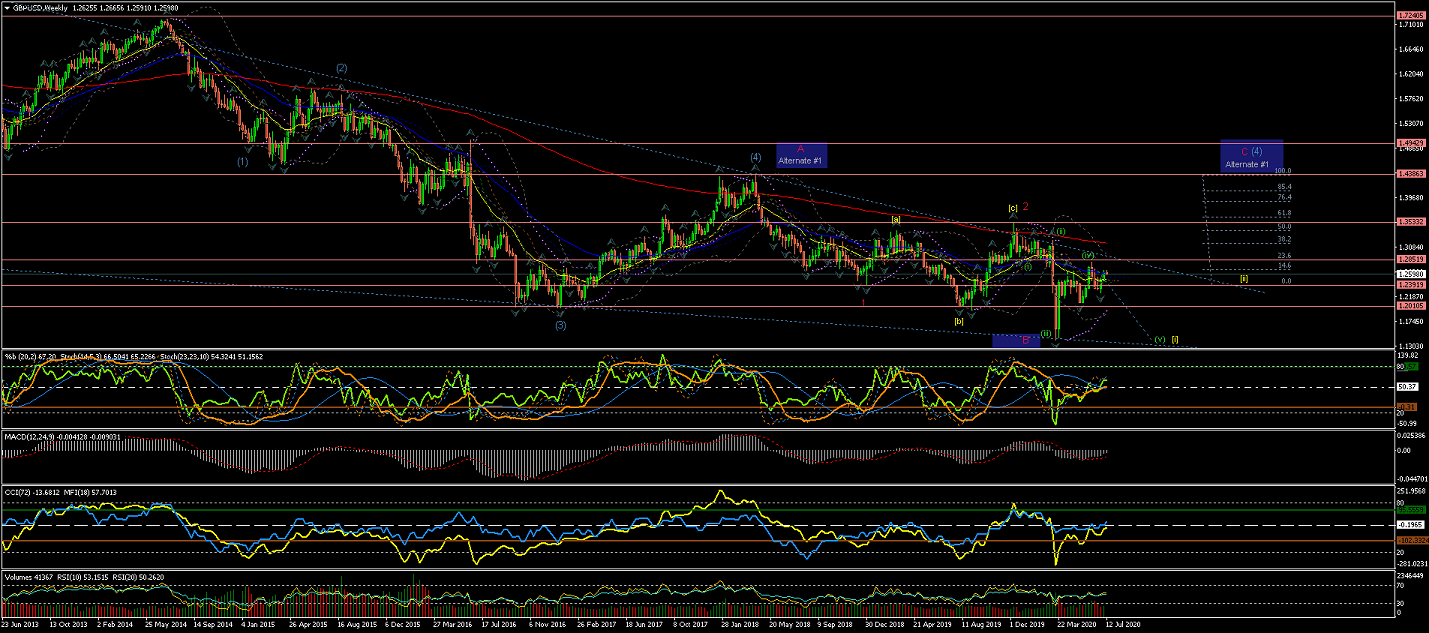
GBPUSD
Weekly chart shows Wave 1(red) and a Wave 2(red) correction completed at the 200EMA level with a retracement
between %50 and %62 level.
From there the price showed an impulsive move down that was rejected by the lower trendline;
A move that suggest the initial waves of Wave [i] of Wave 3(red) starting to develop.
Note Alternate #1 for a possible larger Wave (4) developing.
Daily Chart is showing the current corrective move like an odd lengthy Wave (iv) correction
that has now reached, and passed slightly the %76 retracement of Wave (iii);
(1.28900 area remains this count's Invalidation level - As the lowest of Wave (i)).
Next, we should expect, the price to continue the moves down impulsively on Wave (v) towards the lower trendline.
(otherwise the Alternate count #1 would be triggered)
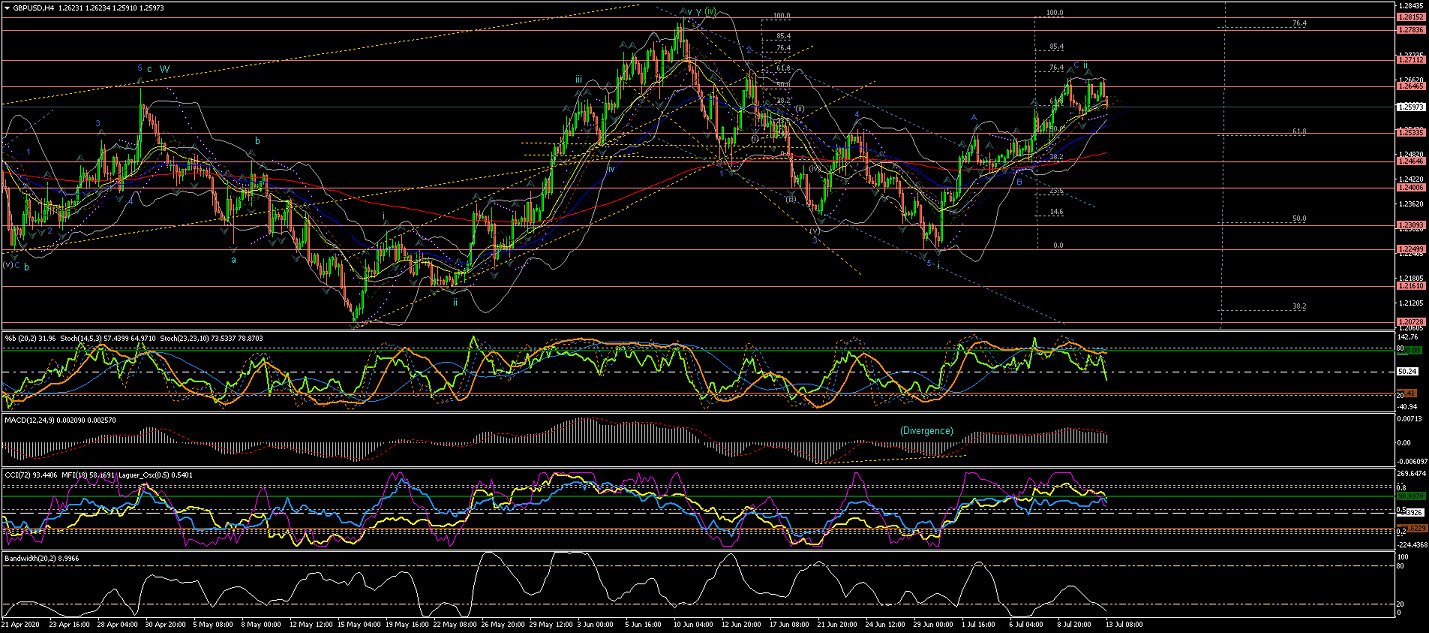
4Hour Chart shows Wave (iv) completed and developed a channel to the downside that
formed 5 waves to complete Wave i.
Corrective Wave ii could have been completed now at %76 retracement in a quick rally breaking out the range(blue), after developing a Divergence setup in MACD and Stochastics.
So next, expect the price to drop to form 5 waves for Wave iii
60Min Chart just shows more in detailed the trend channel (blue) breakout that lead to the %75 retracement
to complete Wave ii and now a double top that could lead to the start of Wave iii downwards.
All the best for everyone and please do not hesitate to contact me if you have any questions or comments.
Andres
info@tradingwaves.org


 Trading Waves .org