Fri 19-06-2020
Hi everyone, hope you are all ok.
Let's get into it...
USDJPY
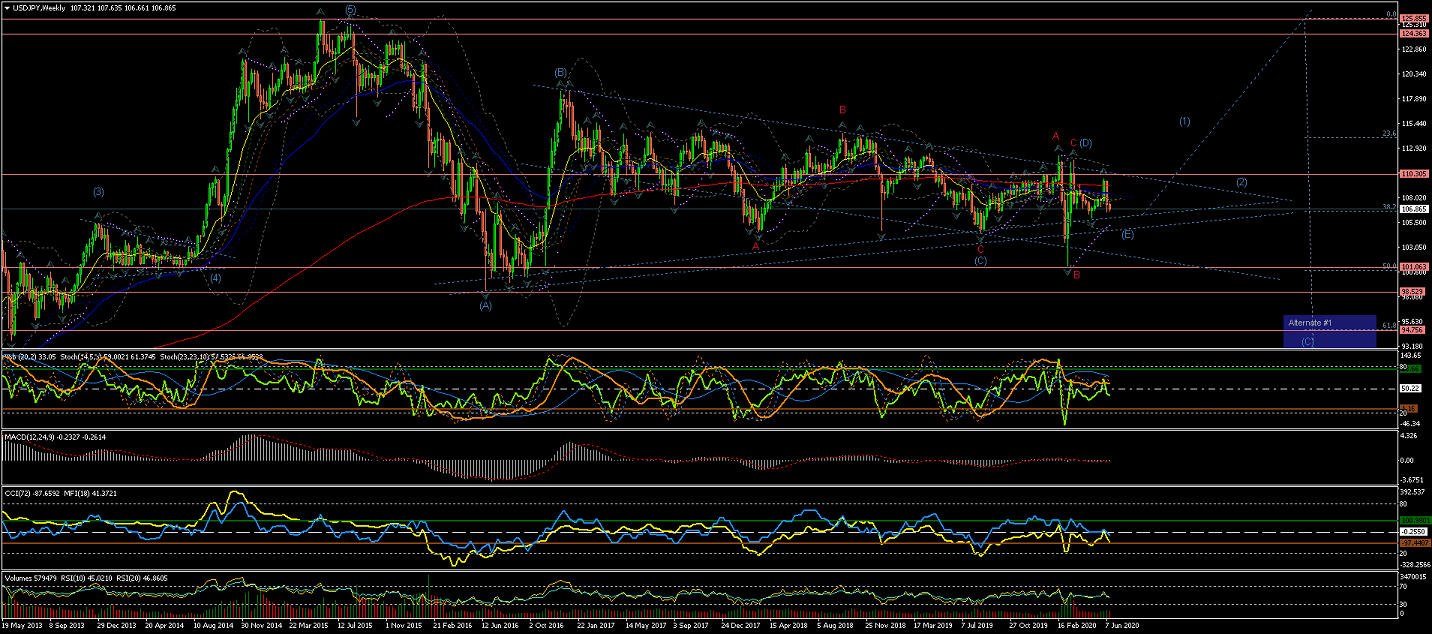
Weekly Chart is showing how a completed Wave B of (D) has, again, reached the %50 retracement of
the 5 waves raised up to year 2015;
And, after a quick raise in Wave C(red) to complete Wave (D), seems like another drop for Wave (E) should target
the lower triangle trend-line or possibly cross it, to complete this long term correction.
A breakout of this long-term triangle, after the correction under the current count,
would suggest the beginning of the start of Wave (1) of a long-term raise.
(a drop across the %50 retracement would favor Alternate #1 count for an extended Wave (C) correction towards the %62)
Daily Chart is showing the current Wave (E) now on the way towards the lower trend-line (blue)
and possibly to cross it to lower support levels.
As per new current count, expect the price to continue to drop in 5 waves to complete
Wave (E) as an extended Flat correction (3,3,5).
(where Waves [a] and [b] are showing 3 waves and Wave [c] should be a 5 waves move)
4Hour Chart showing more in detail the internal waves of Wave [b] of (E) completed (in 5 and 3 waves respectively)
The Wave (i) down as the start of 5 waves also completed, as mentioned in the Daily Chart comments.
And now, the current Wave (ii) showing that could have been completed below the %38 retracement level,
if the price breakout lower.
Although there could be developing a sideways channel that could bring the price back up again to complete
an extended Wave (ii) correction at higher retracement levels.
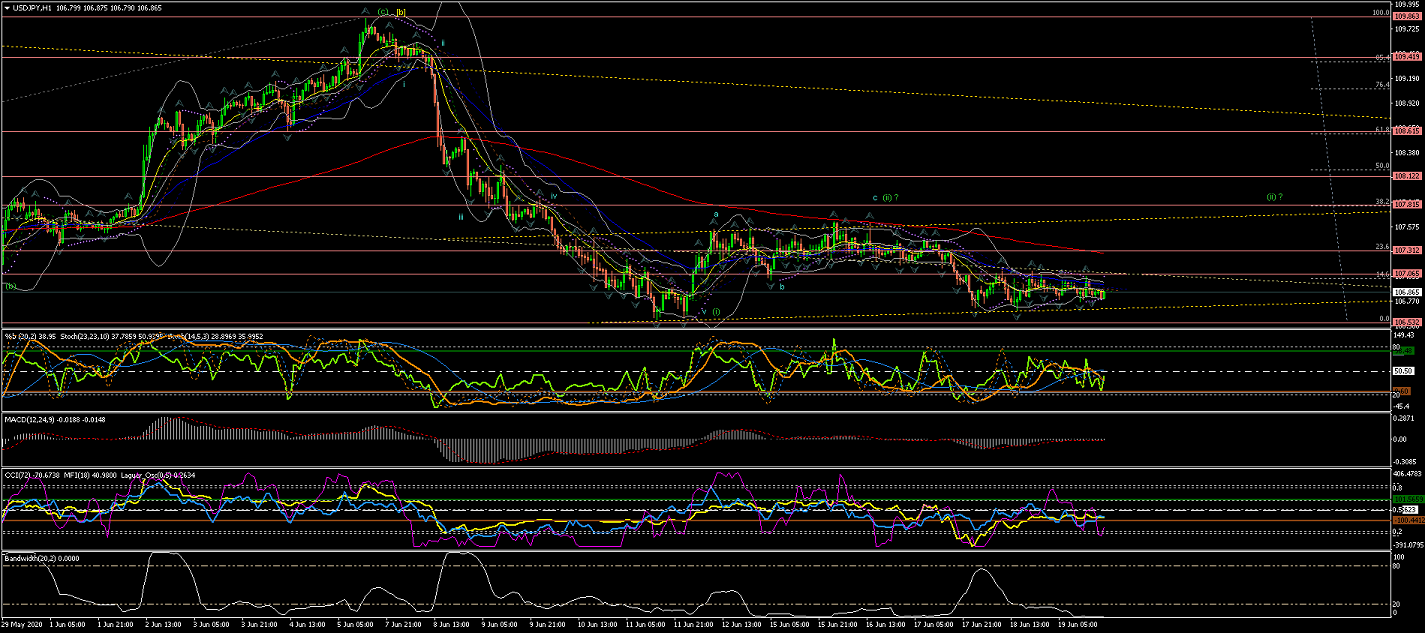
60Min Chart shows in more detail the internal waves of Wave (i) showing completion at 106.532;
And now Wave (ii) taking the price up in a corrective fashion but showing that could be developing
an extended move within a parallel range.
Once Wave (ii) confirms to be completed, Wave (iii) should continue bringin the price impulsively to the downside
breaking through support levels.
EURUSD
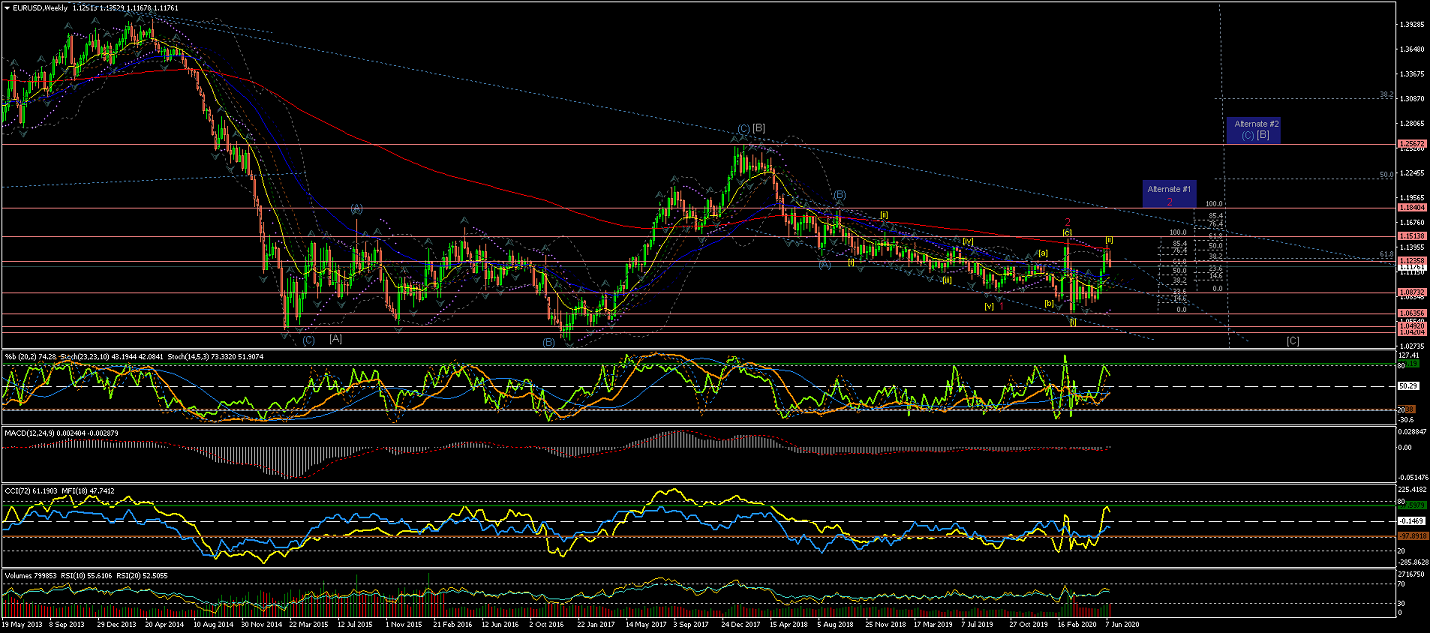
Weekly Chart, under the current interpretation,
shows a Wave 2(red) crossing slightly over the %62 retracement of Wave 1(red)
and now an extended Wave [ii] pretty much confirmed to be completed (judging by the recent candles)
at the 200EMA and %85 retracement of Wave [i] of Wave 3(red).
Notice the Alternate counts #1 & #2 for alternatives more extensive corrections of Wave 1 (red) and
long-term Wave [b] respectively to have in mind.
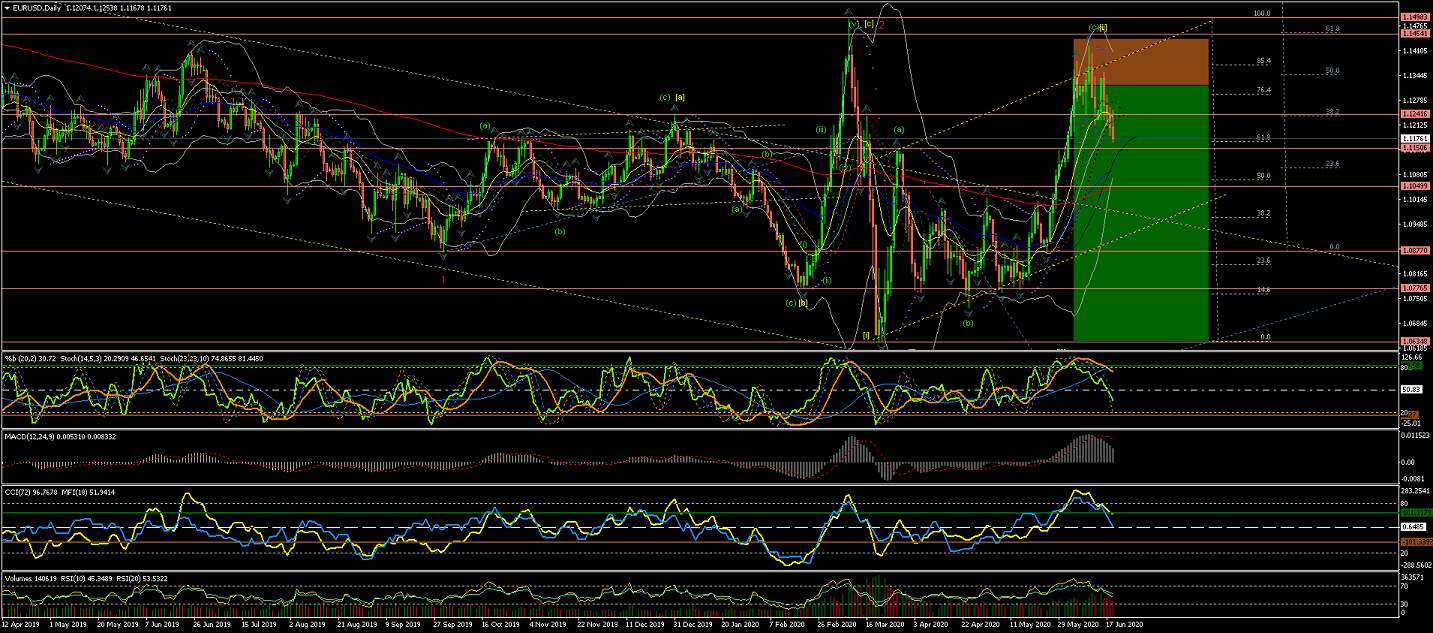
Daily Chart is showing Wave [ii] made an extended correction
and retracing over the %85 retracement level, as the top of the current range formation.
Further impulsive waves down will give more weight to the current count for Wave [iii] start,
and, hence, a start for a long move to the downside.
4Hour Chart is showing a Wave 1(blue) of Wave (i) of Wave [iii] completed,
which pierced through the 50EMA and finding support at 1.12107.
Then a Wave 2(blue) correction retraced %62 back towards the earlier wedge formation.
And now Wave 3(blue) seem to be developing its initial first internal wave as a leading diagonal formation.
Next, once Wave(ii) correction is confirmed completed, we should expect Wave 3(blue) to continue
bringing the price lower across the 200EMA towards the lower trend channel.
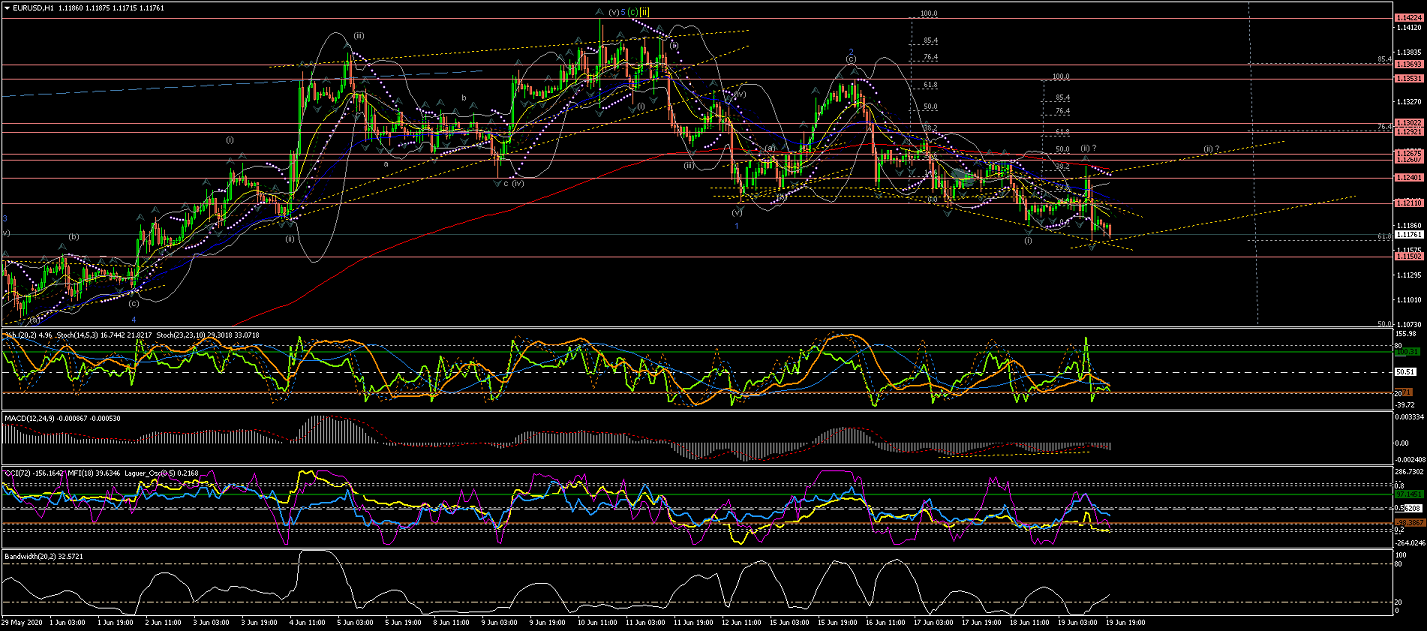
60Min Chart is showing the internal Waves of Wave 1(blue) and 2(blue) completed.
Then the start of Wave 3(blue) with a leading diagonal Wave (i) and a spike that could be interpreted as Wave (ii) completed,
although there is a possibility of this correction to extend further and form a new channel before Wave (iii) starts.
Next, once Wave(ii) completes..... further moves down would confirm Wave (iii) of Wave 3(blue), and a cross from the next level of support at 1.11502 area
should see impulsive moves down again, while the lowest of Wave 1(blue) at 1.12110 offers the Resistance/Invalidation level.
GBPUSD
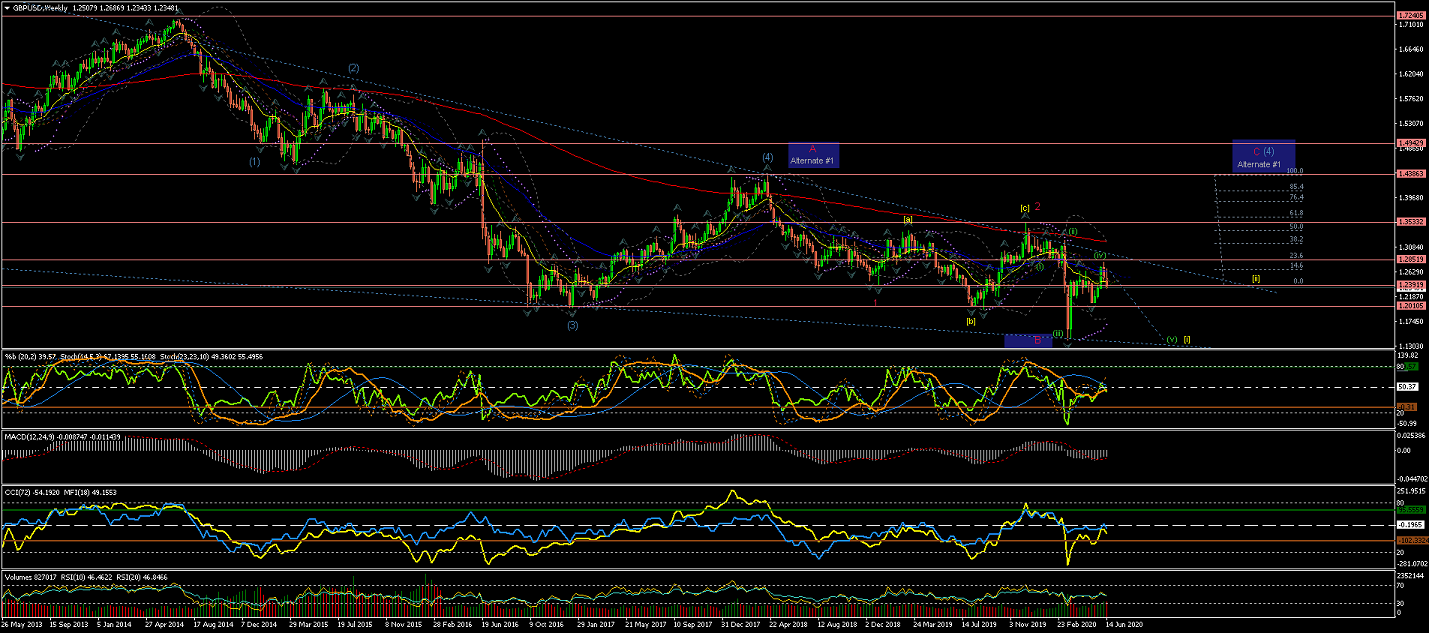
Weekly chart shows Wave 1(red) and a Wave 2(red) correction completed at the 200EMA level with a retracement
between %50 and %62 level.
From there the price showed an impulsive move down that was rejected by the lower trendline;
A move that suggest the initial waves of Wave [i] of Wave 3(red) starting to develop.
Note Alternate #1 for a possible larger Wave (4) developing.
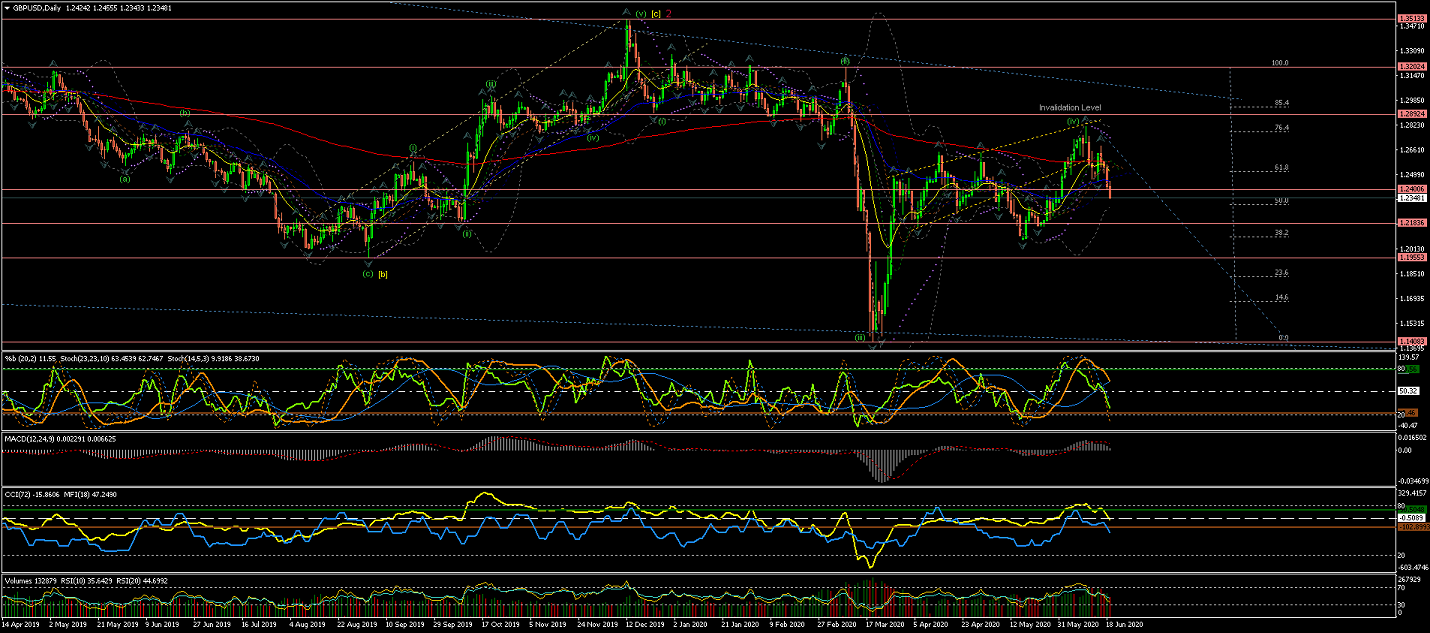
Daily Chart is showing the current corrective move like an odd lengthy Wave (iv) correction
that has now reached, and passed slightly the %76 retracement of Wave (iii);
(1.28900 area remains this count's Invalidation level - As the lowest of Wave (i)).
Next, we should expect, the price to continue the moves down impulsively on Wave (v) towards the lower trendline.
(otherwise the Alternate count #1 would be triggered)
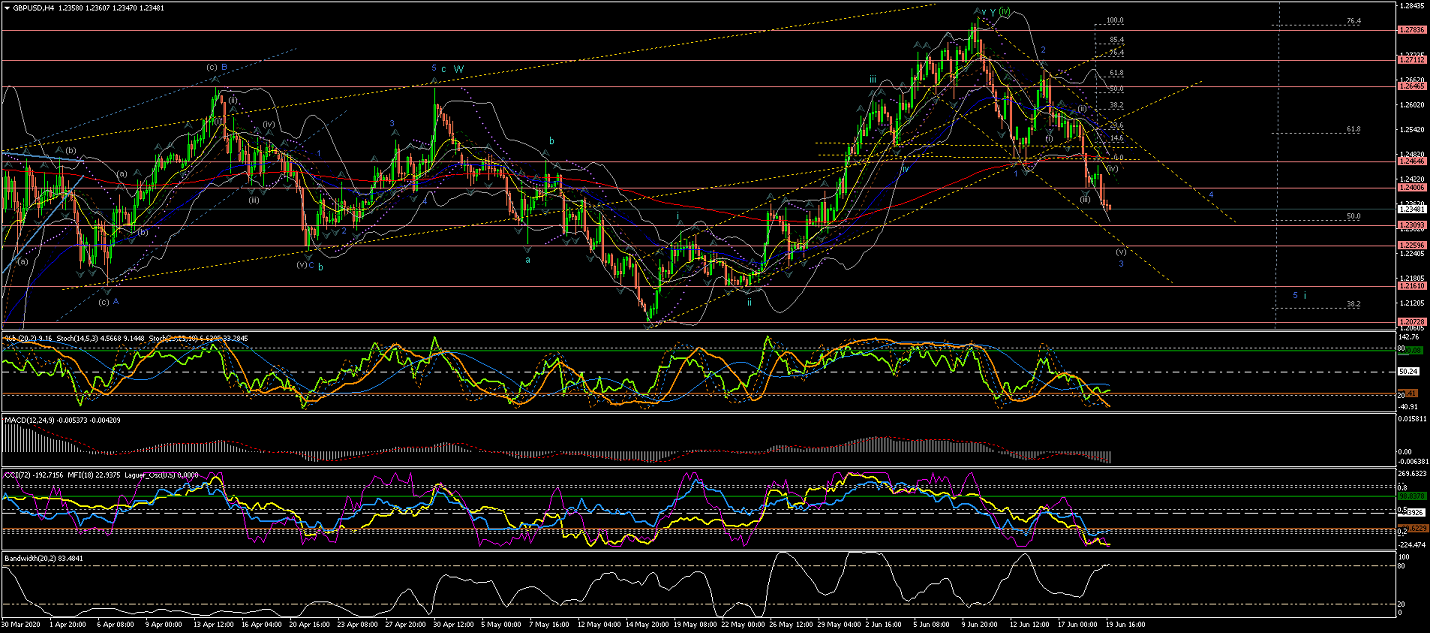
4Hour Chart shows Wave (iv) completed after an extension
that has come really close to the count's Invalidation Level.
While developing the first internal Waves 1(blue) and 2(blue), there has been a Head & Shoulder
formation that has brought the price lower into Wave 3(blue).
Next, upon Wave 3(blue) completion expect a raise for corrective Wave 4(blue) to
develop... most likely towards the trend channel that seems to be forming to the downside.
60Min Chart just shows more in detailed the trend channel that is now forming after
the Heads & Shoulders breakout shown in the 4Hour Chart
All the best for everyone and please do not hesitate to contact me if you have any questions or comments.
Andres
info@tradingwaves.org


 Trading Waves .org