Fri 22-05-2020
Hi everyone, hope you are all ok.
Let's get into it...
USDJPY
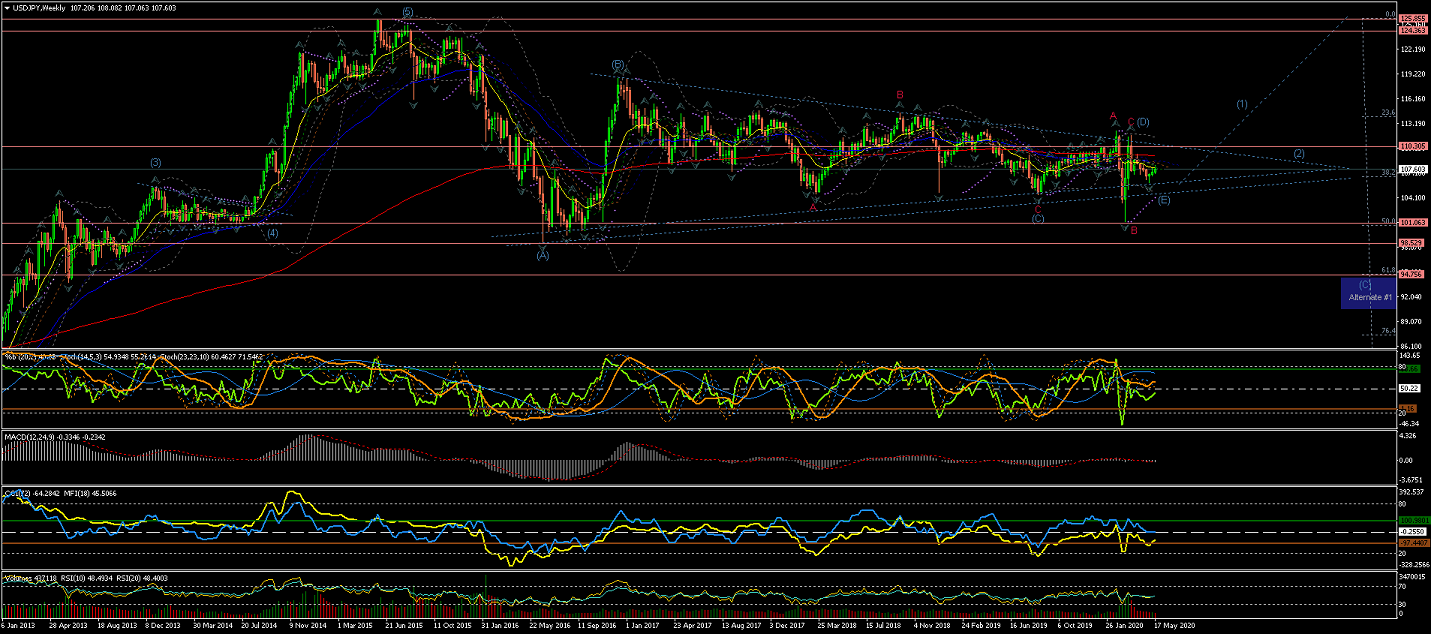
Weekly Chart is showing how a completed Wave B of (D) has, again, reached the %50 retracement of
the 5 waves raised upto year 2015;
And, after a quick raise in Wave C(red) to complete Wave (D), seems like another drop for Wave (E) should target
the lower trendline to complete this long term correction (or might have already done so).
A breakout of this long-term triangle, after the correction under the current count,
would suggest the beginning of the start of Wave (1) of a long-term raise.
(a drop across the %50 retracement would favor Alternate #1 count for an extended Wave (C) correction towards the %62)
Daily Chart is showing Wave (D) completed, with a extremely quick drop and an equally
quick rise.
The current Wave (E) has already completed its internal Waves [a] and [b] and could have also completed Wave [c],
although left Alternate #2 and #3 for a possibly extended Wave [b] and [c] (respectively).
As per current count, expect the price to raise to form Wave (1) up...
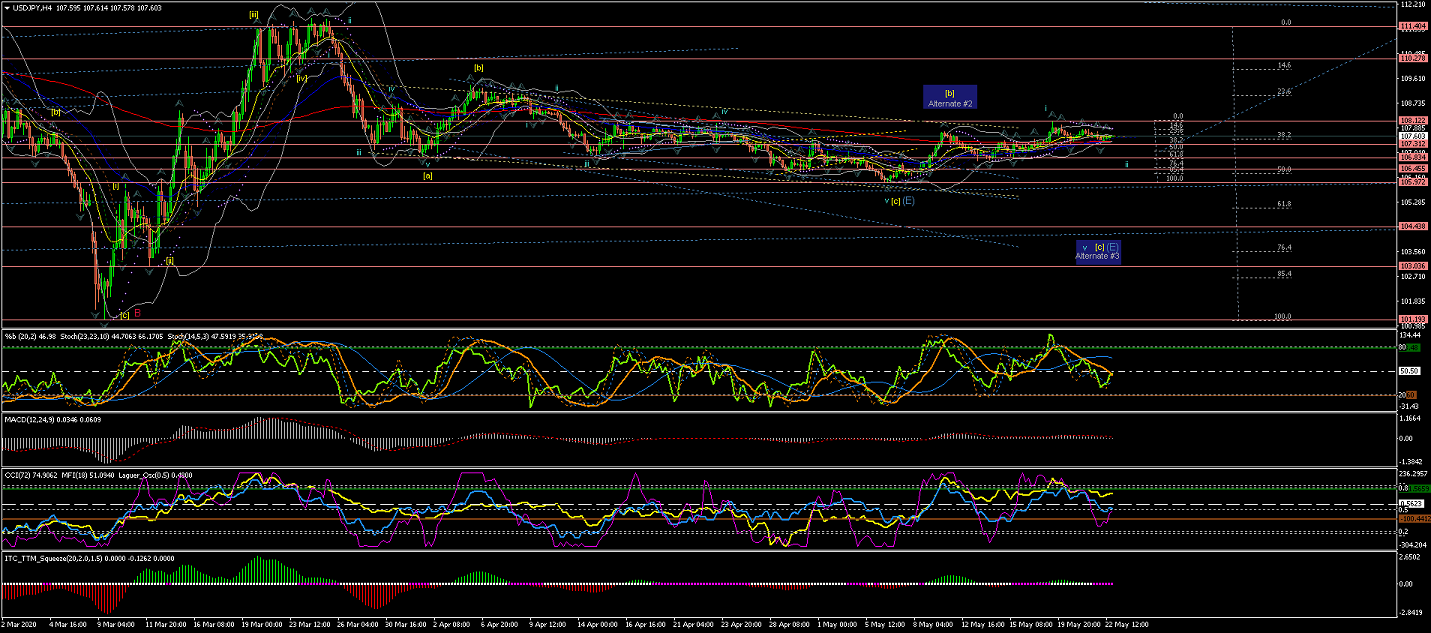
4Hour Chart showing more in detail the internal waves of Wave (E) possibly completed and its current Alternate counts.
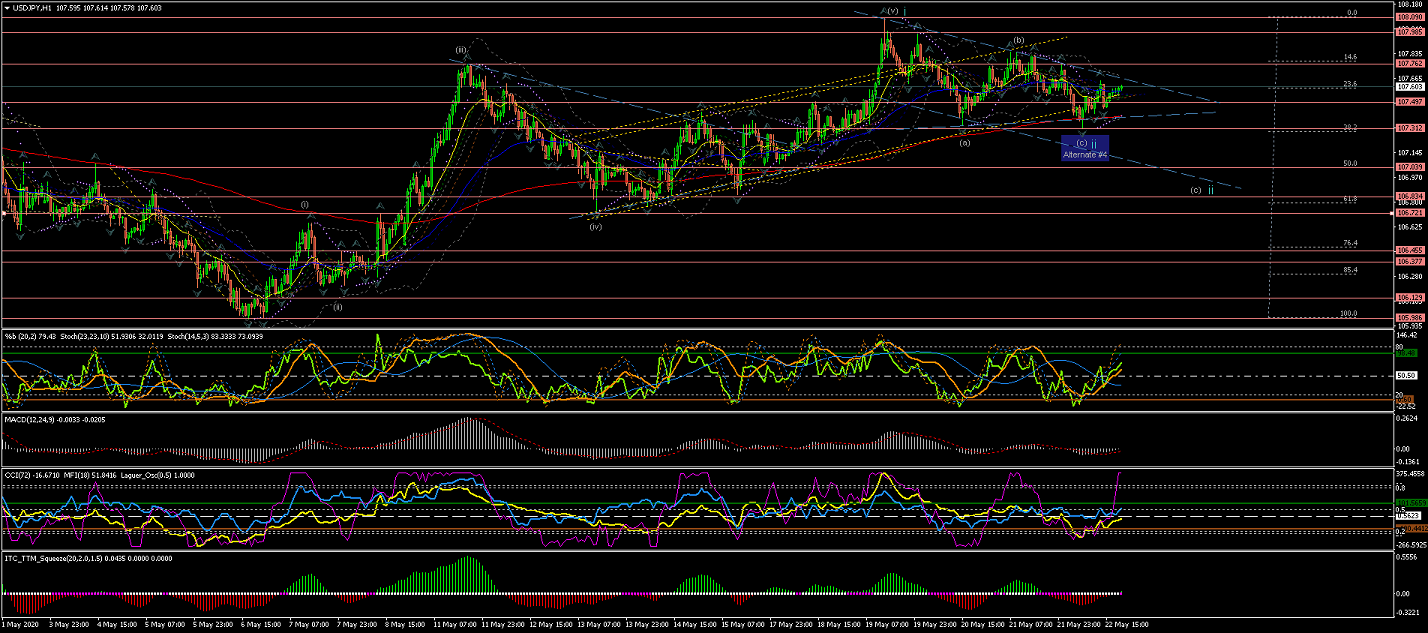
60Min Chart shows in even more detail the internal waves of the initial waves up;
With Wave i completed in 5 impulsive waves and now a Wave ii correction possibly completed at nearly %38 retracement, as the Alternate #4 count
Although I would expect and have as the main count for Wave ii to continue lower towards the %62 retracement level
within the forming channel and previous triangle (blue) apex at around the 1.07.03 or 106.83 levels.
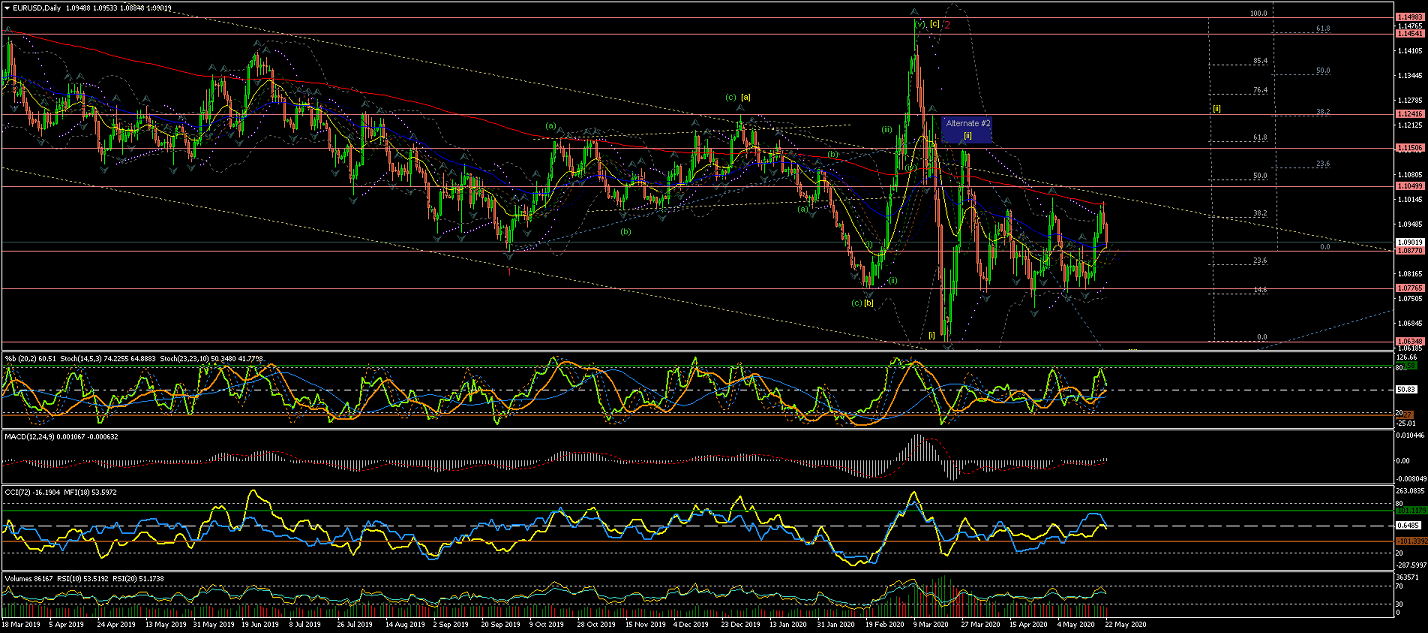
EURUSD
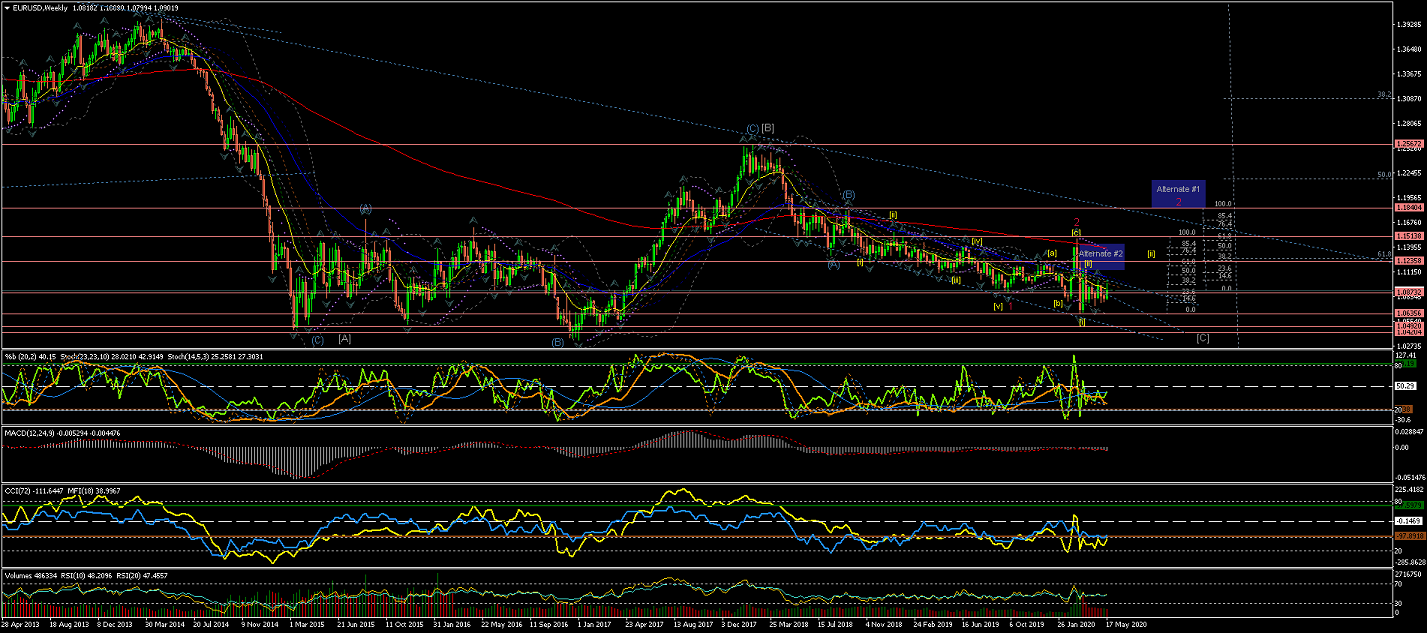
Weekly Chart, under the current interpretation,
shows a Wave 2(red) crossing slightly over the %62 retracement of Wave 1(red)
and now an extended Wave [ii] taking place as the initial correction of Wave 3(red).
Notice the Alternate counts #1 & #2 for alternative corrections to have in mind.
Daily Chart is showing now more probable for Wave [ii] to make an extended correction
and target the %62 retracement levels again.
Further impulsive waves down will give more weight to the probability of Wave [iii] start.
Although, as per Alternate #2, Wave [ii] could be already completed after a rejection at close to the %62 retracement of Wave [i].
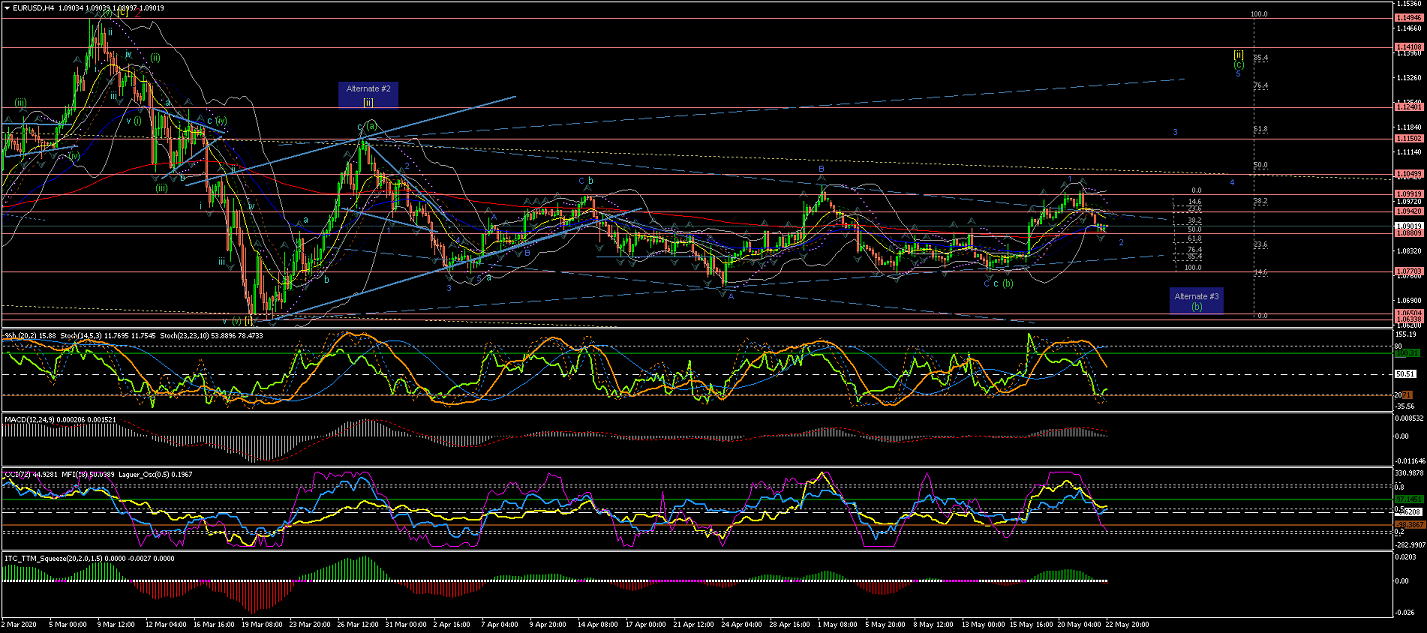
4Hour Chart is showing Wave [ii] correction is now getting extended.
And now its internal Wave (b) showing to be completed at the lower trend channel.
Now that Wave (b) is finally completed are seeing the price to raise in 5 impulsive waves towards the 1.12400 price level, or higher,
to complete Wave [ii].
However, bear in mind the possibility of Wave (b) still aiming to the lower trend channel (orange), as marked by Alternate #3 count.
60Min Chart is showing the internal Waves of Wave (c) starting to develop.
With a Wave 1(blue) already completed with 5 impulsive waves.
And Wave 2(blue) developing; now sitting between the %50 and the %62 retracement level
fighting with the 200EMA level.
Next, expect impulsive moves up to confirm current count for Wave 3(blue) to breakout the current triangle(blue) formation.
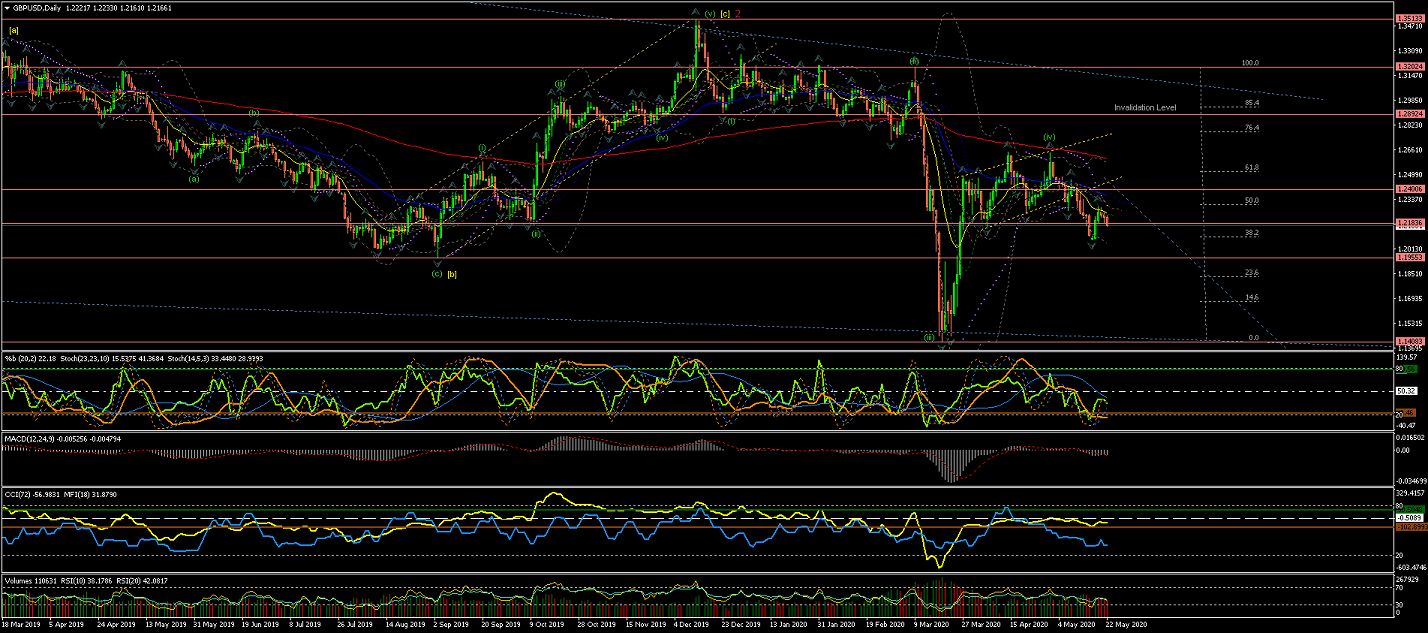
GBPUSD
Weekly chart shows Wave 1(red) and a Wave 2(red) correction completed at the 200EMA level with a retracement
between %50 and %62 level.
From there the price showed an impulsive move down that was rejected by the lower tendline;
A move that suggest the initial waves of Wave [i] of Wave 3(red) starting to develop.
Note Alternate #1 for a possible larger Wave (4) developing.
Daily Chart is showing the Wave (iii) (of Wave [i] of Wave 3(red)) completed in a sharp move down.
The rally afterwards looks like an odd Wave (iv) correction that stalled between %62 and %76 retracement of Wave (iii);
And now the price has moved impulsively down as would be expected from Wave (v) on this count;
... after breaking out of what seems to be a raising wedge or range formation.
(1.28900 area remains this count's Invalidation level - As the lowest of Wave (i)).
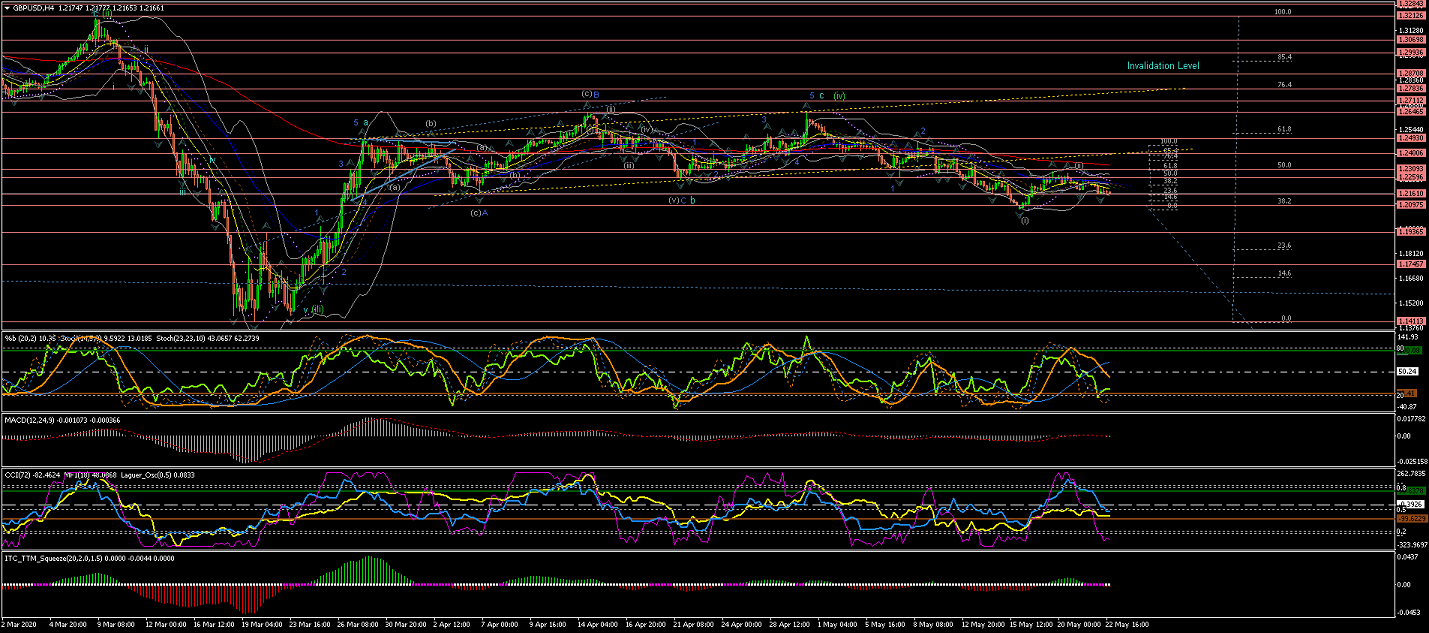
4Hour Chart shows Wave (iv) completed
between the %62 and %76 fibo retracement of Wave (iii).
Wave (v) has been confirmed as the price broke out of the range to the downside.
And the current count is showing the possibility of its initial Waves 1(blue) and 2(blue) completed.
With now the internal Waves (i) & (ii) of Wave 3(blue) taking place.
Although Wave 3(blue) developing, under current count, but not as impulsive yet as one would have expect for a third wave.
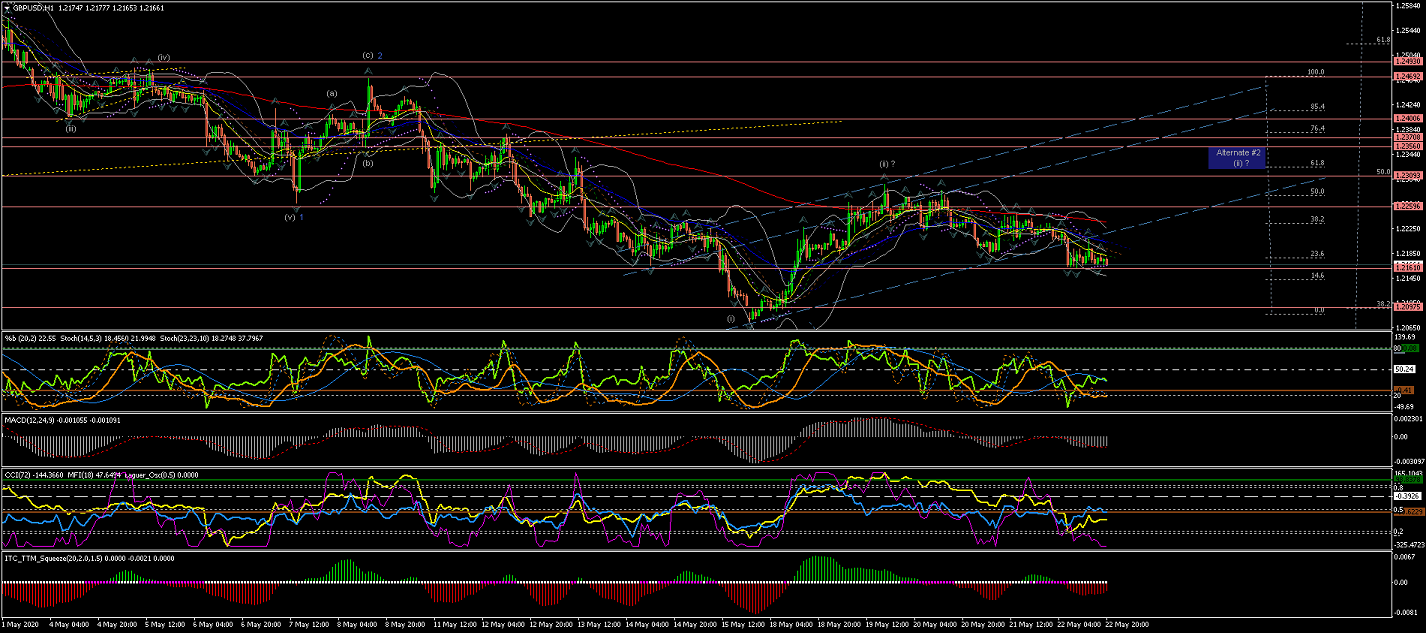
60Min Chart shows the internal waves of Wave 3(blue) under development;
With its internal Waves (i) and (ii) possibly completed.
Next, once Wave (ii) is finally completed, the price should continue moving down impulsively,
breaking out from the current price range to the downside.
All the best for everyone and please do not hesitate to contact me if you have any questions or comments.
Andres
info@tradingwaves.org


 Trading Waves .org