Fri 10-04-2020
Hi everyone, hope you are all ok.
Let's get into it...
USDJPY
Weekly Chart is showing how a completed Wave (E) has reached the %50 retracement of
the 5 waves raised up to year 2015;
A breakout of this long-term triangle, after the correction under the current count,
would suggest the beginning of the start of Wave (1) of a long-term raise.
(a drop towards the lower trendline would favor Alternate #2 count)
Bearing in mind that;
* The Alternate#1 count for an extended set of Waves (D) and (E)
* The Alternate#2 count for an extended Wave (C)
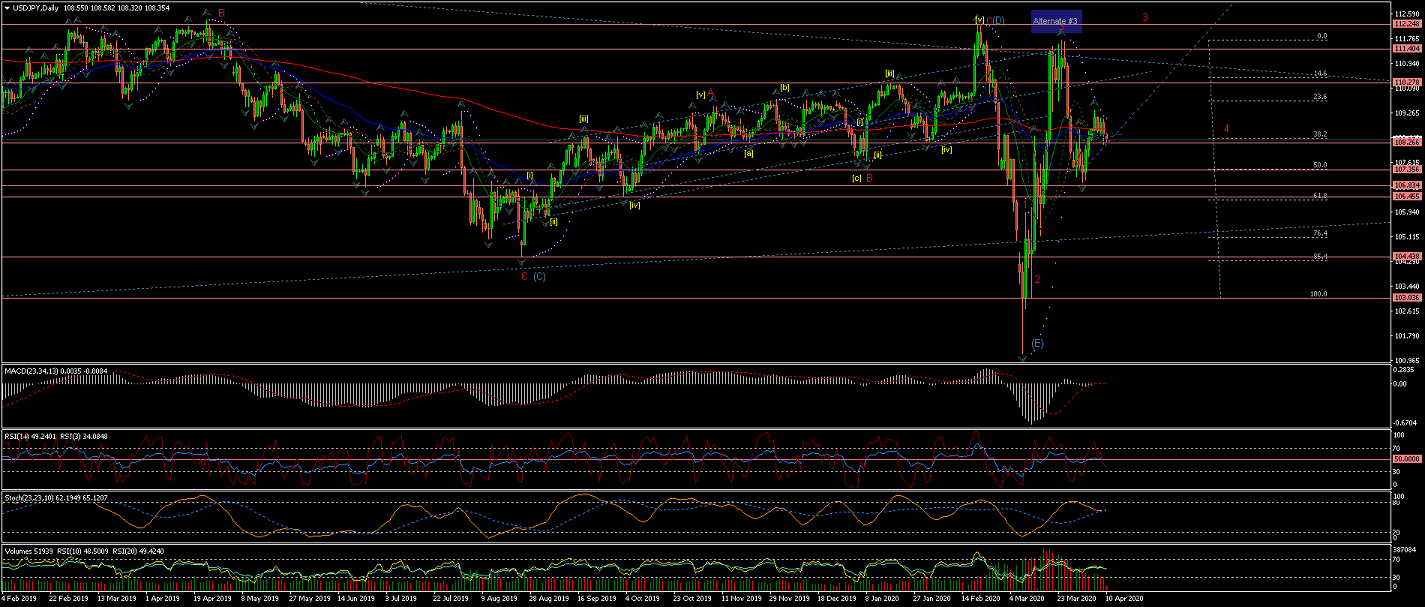
Daily Chart is showing Wave (E) completed with a extremely quick drop and an equally quick rise that followed up into the
triangle top again to form 3 possible waves; Wave 1(red), Wave 2(red) and Wave 3(red) that later was rejected at 111.404 resistance
to form Wave [iv] or Wave 4(red) as per Alternate #1 count; which might also be completed as of now....
Making the last set of waves of Wave 3(red) on its way up.
Next we should expect Wave 3(red) to complete across the upper long term trendline through a series of impulsive waves.
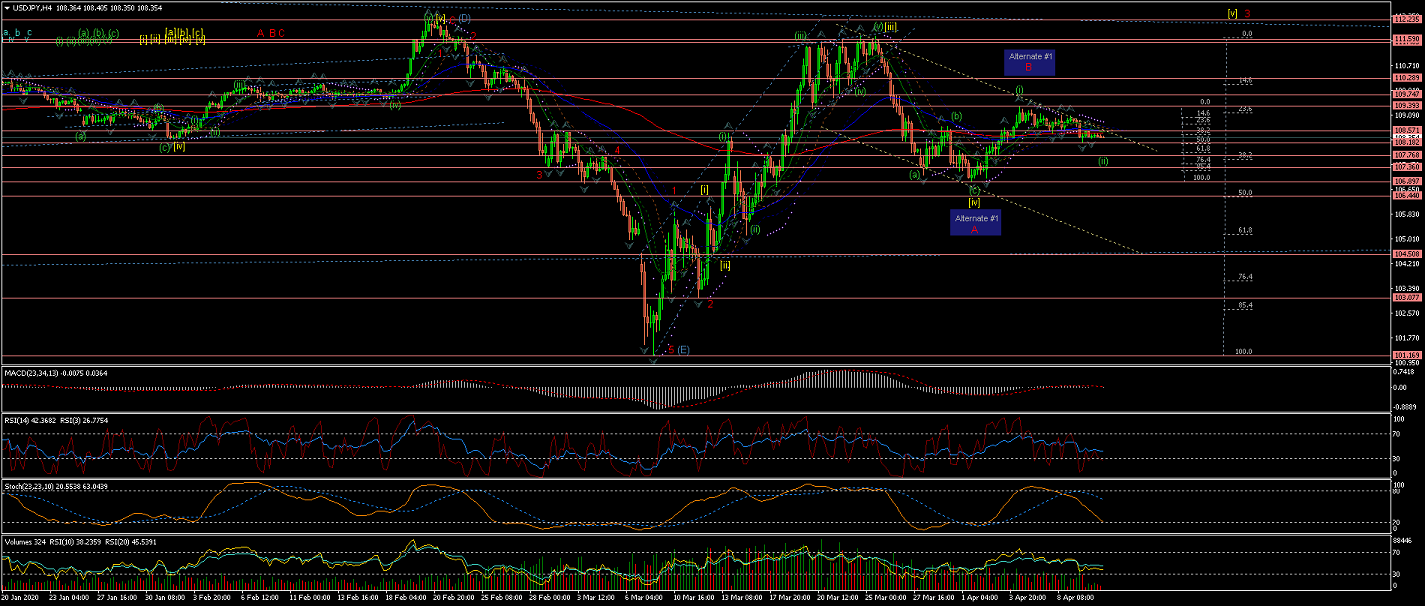
4Hour Chart shows a possibly completed Wave [iv] and now a rally up for Wave [v] to
cross the highest of Wave [iii] towards the trendline.
Alternate #1 shows a count for Wave A(red) completed and an expected rally up for Wave B(red)
before the price targets the lower trendline instead.
(a drop lower than Wave (i) 0 retracement would trigger this count)
60Min Chart shows in more detail the internal waves of the developing Wave [iv],
where its internal current Wave (c) bounced of support areas that now created a channel.
EURUSD
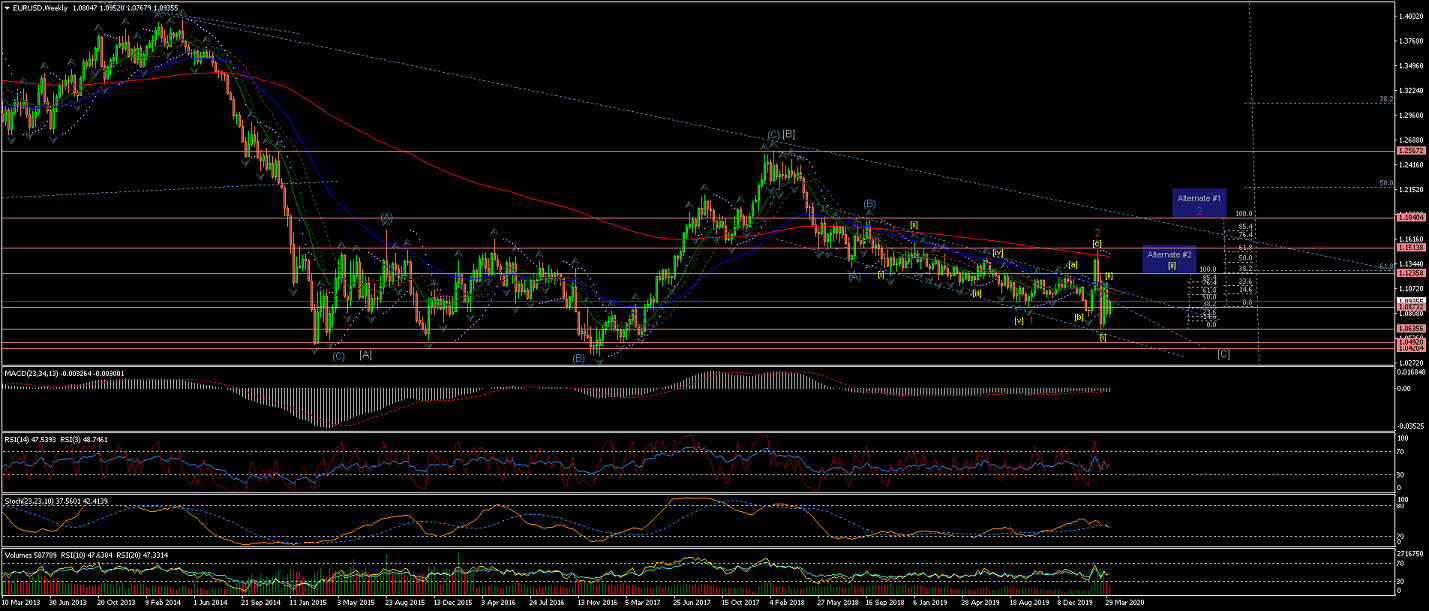
Weekly Chart, under the current interpretation,
shows a Wave 2(red) crossing slightly over the %62 retracement of Wave 1(red)
and now a sharp move down to start Wave 3(red).
Notice the Alternate counts for extended corrections to bear in mind.
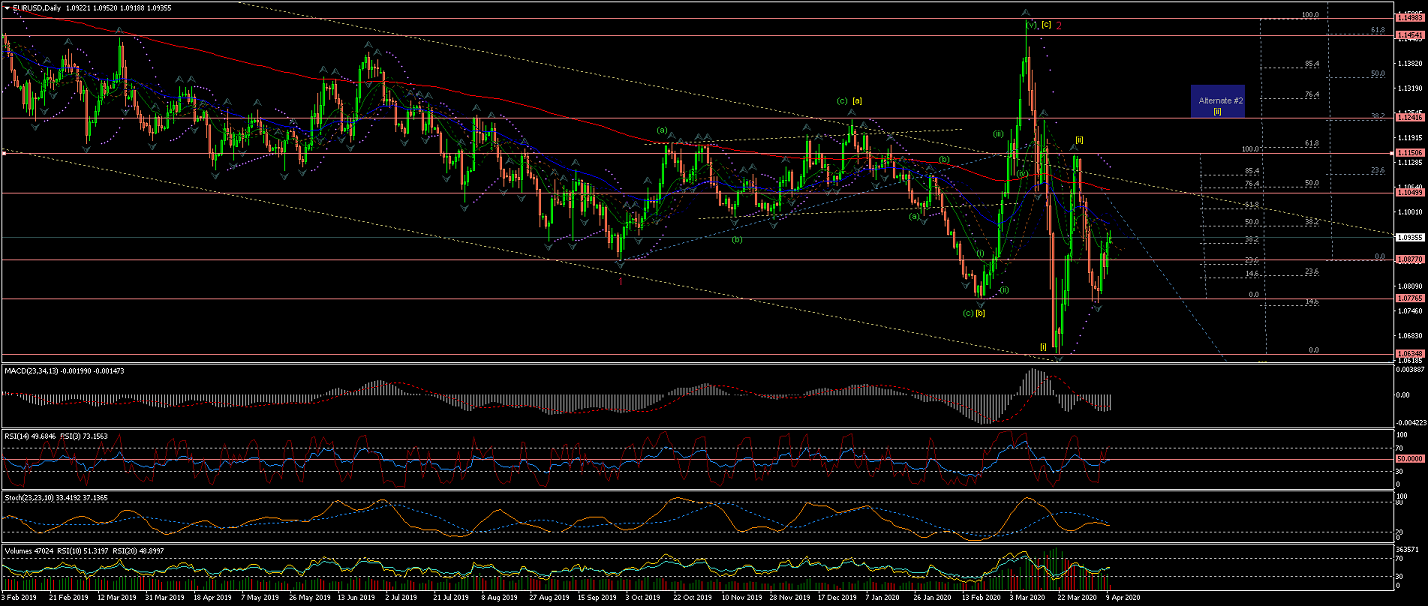
Daily Chart is showing Wave [ii] possibly completed after a rejection at close to the %62 retracement of Wave [i].
Further impulsive waves down will give more weight to the probability of Wave [iii] start.
Although, as per Alternate #2, there is a possibility for Wave [ii] to make an extended correction
and target the upper trendline again.
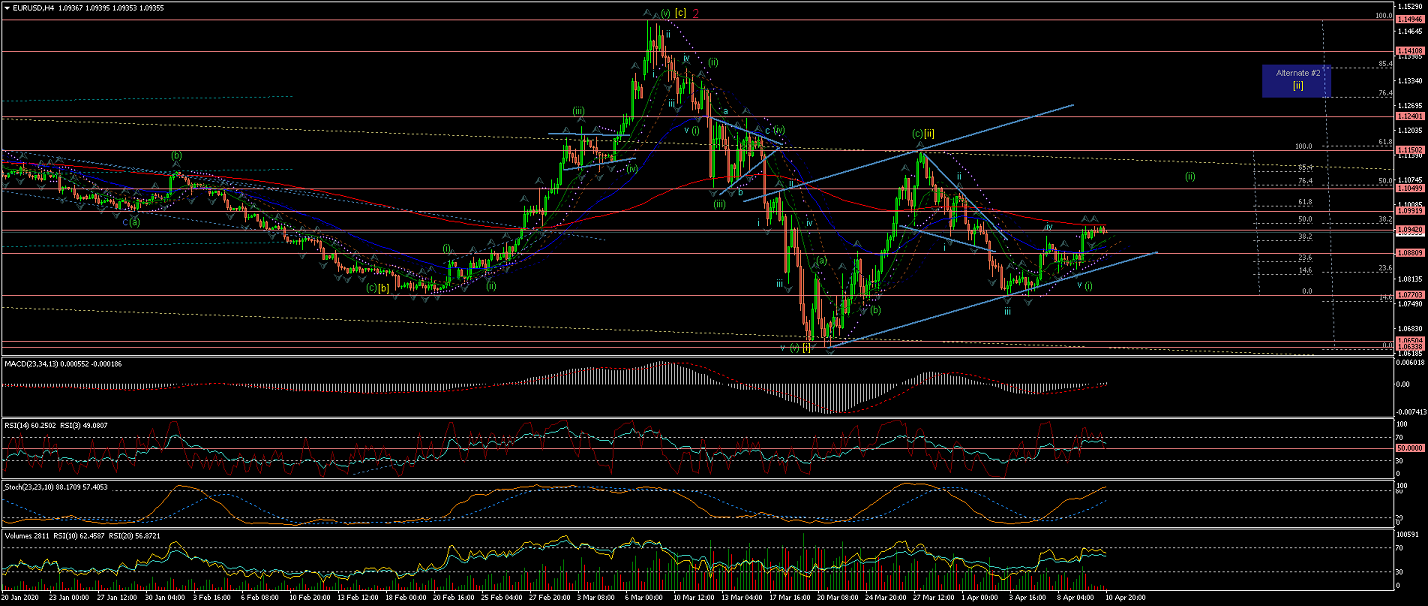
4Hour Chart is showing Wave [ii] correction possibly completed and now looking for price drop continuation
into Wave [iii] of Wave 3(red)...
Although the current breakout direction of the wedge formation would determine whether the current count remains
in place or the Alternate #2 count gets triggered.
60Min Chart is showing more in detail the internal Waves of the possible Wave (i) of Wave [iii] showing signs of completion;
And we should expect a drop to cross the lowest of Wave [i] to confirm Wave [iii] underway.
GBPUSD
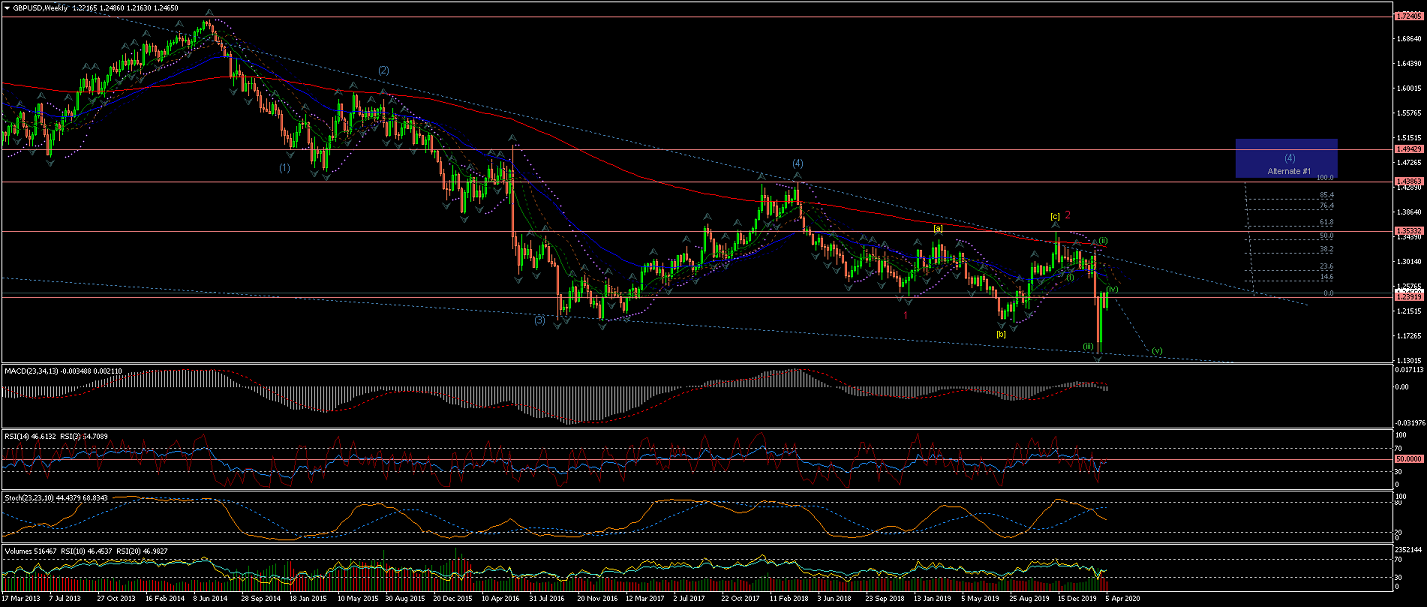
Weekly chart shows Wave 1(red) and a Wave 2(red) correction completed at the 200EMA level with a retracement
between %50 and %62 level.
From there the price showed an impulsive move down that was rejected by the lower tendline;
A move that suggest the initial waves of Wave [i] of Wave 3(red).
Note Alternate #1 for a possible larger Wave (4) developing.
Daily Chart is showing the Wave (iii) (of Wave [i] of Wave 3(red)) completed in a sharp move down.
The rally after looks like an odd Wave (iv) correction that stalled at %62 retracement of Wave (iii);
Although the price has not yet move impulsively down as would be expected from Wave (v) on this count;
but that should be the next move...
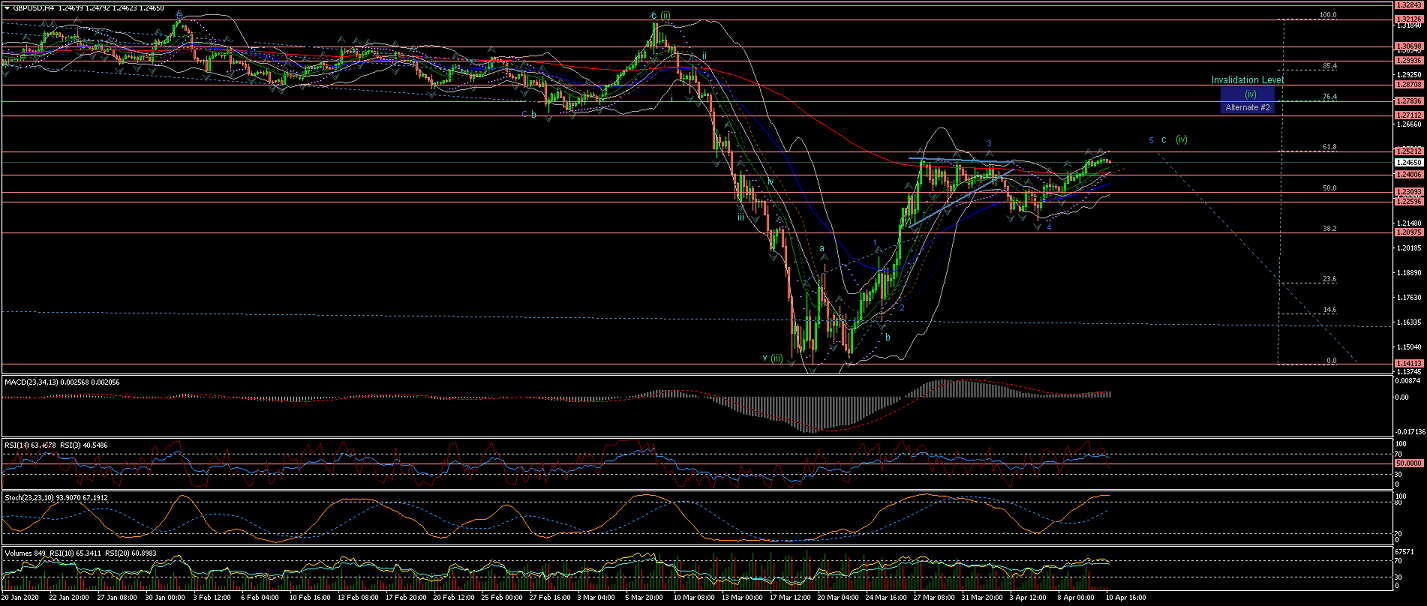
4Hour Chart shows the 5 internal waves of Wave (iii) and the 3 internal waves for an expanded flat Wave (iv)
now stalled at the 200EMA and nearly %62 fibo retracement of Wave (iii).
Wave (iv) should complete at any time now, so expect the price to drop for a start of Wave (v).
(although pay attention to the invalidation line which could trigger the alternate count)
Notice also how the Stochastic and RSI levels are showing high overbought levels; Similar to those at the start of Wave (iii) down.
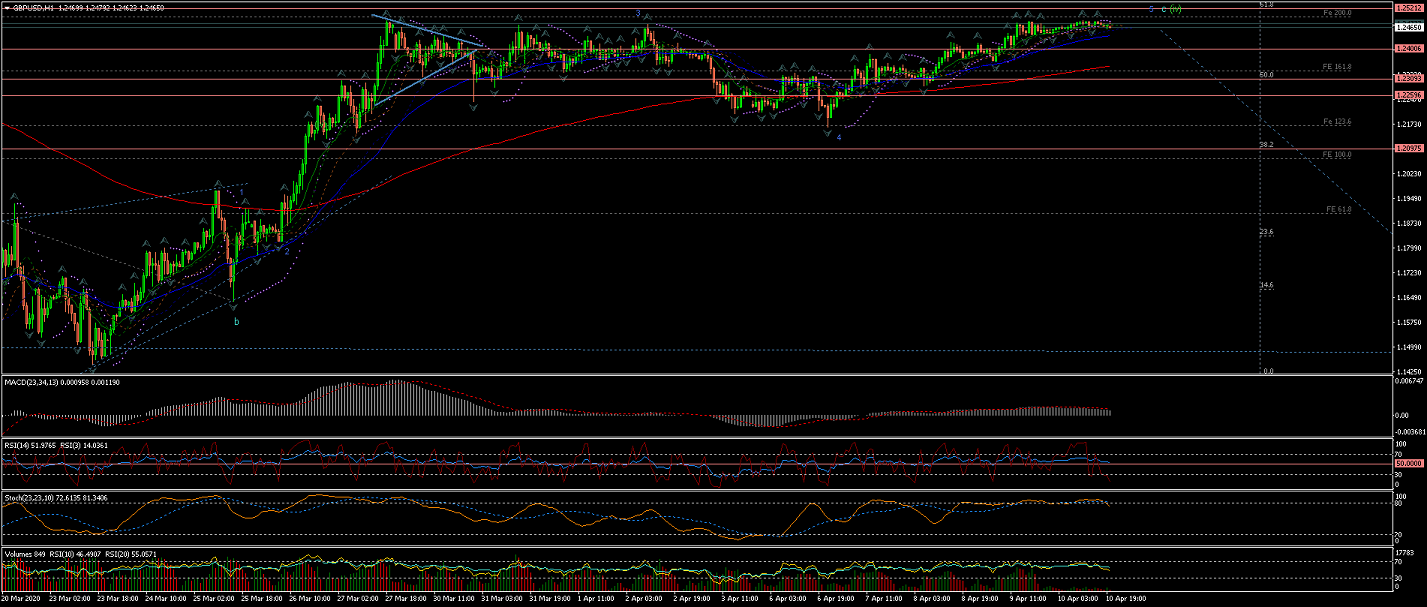
60Min Chart shows Wave (iv) reached the %200 Fibo extension of its internal Wave a at
the nearly %62 retracement level and same level of the previous lower level Wave iv.
All the best for everyone and please do not hesitate to contact me if you have any questions or comments.
Andres
info@tradingwaves.org


 Trading Waves .org