Hi everyone, hope you are all ok.
Let's get into it...
USDJPY
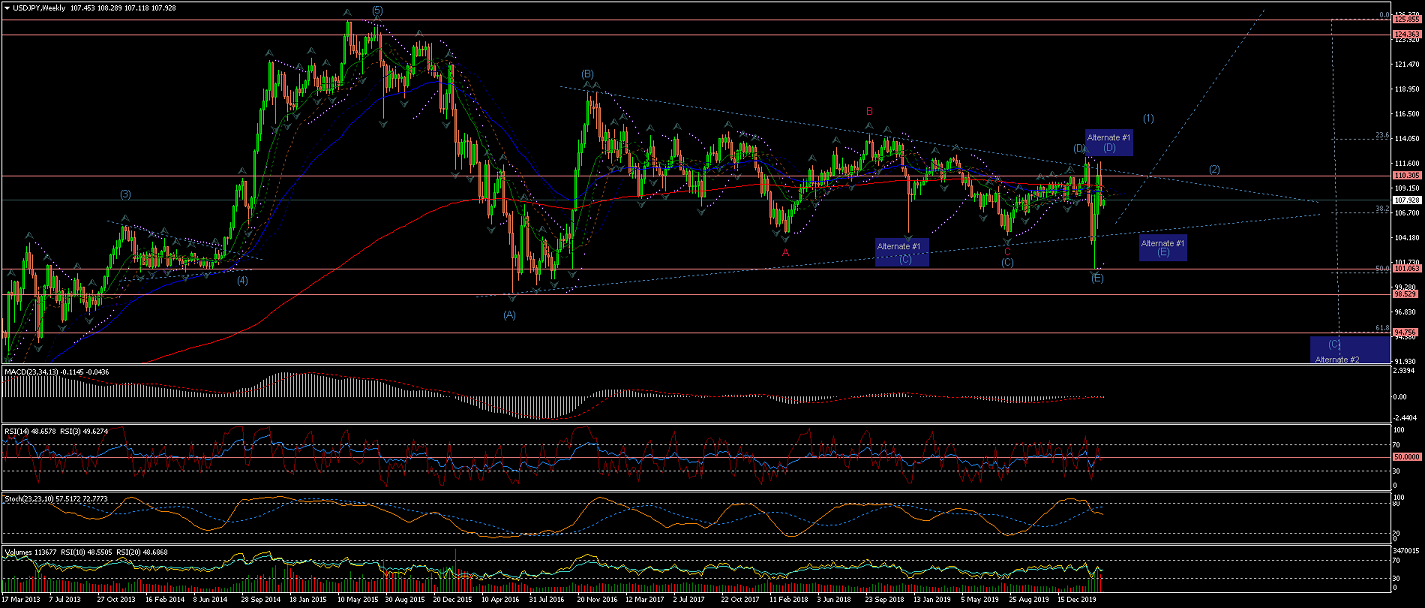
Weekly Chart is showing how a completed Wave (E) has reached the %50 retracement of
the 5 waves raised upto year 2015;
A breakout of this long-term triangle, after the correction under the current count,
would suggest the begining of the start of Wave (1) of a long-term raise.
Bearing in mind that;
* The Alternate#1 count for an extended set of Waves (D) and (E)
* The Alternate#2 count for an extended Wave (C)
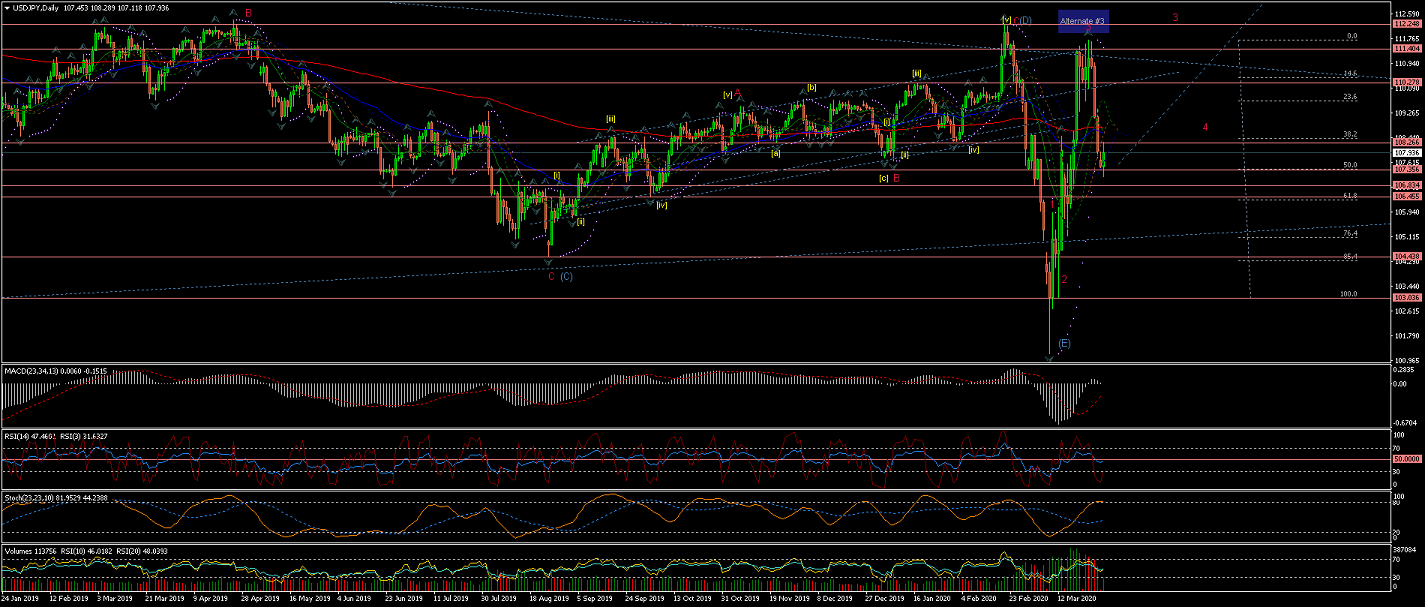
Daily Chart is showing Wave (E) completed with a extremelly quick drop and an equally rise that followed up into the
triangule top again to form 3 possible waves; Wave 1(red), Wave 2(red) and Wave 3(red) that later was rejected at 111.404 resistance
to form Wave 4(red).
Next is a continuation move to the upside to complete Wave 3(red)
Unless Alternate #3 is triggered for an already completed Wave 3(red)
in which case the current move down would be Wave 4(red) correction
In either case, we should expect impulsive moves towards the triangle upper trend
And any further moves to the downside would call for Alternates #1 and #2 (see Daily Chart).
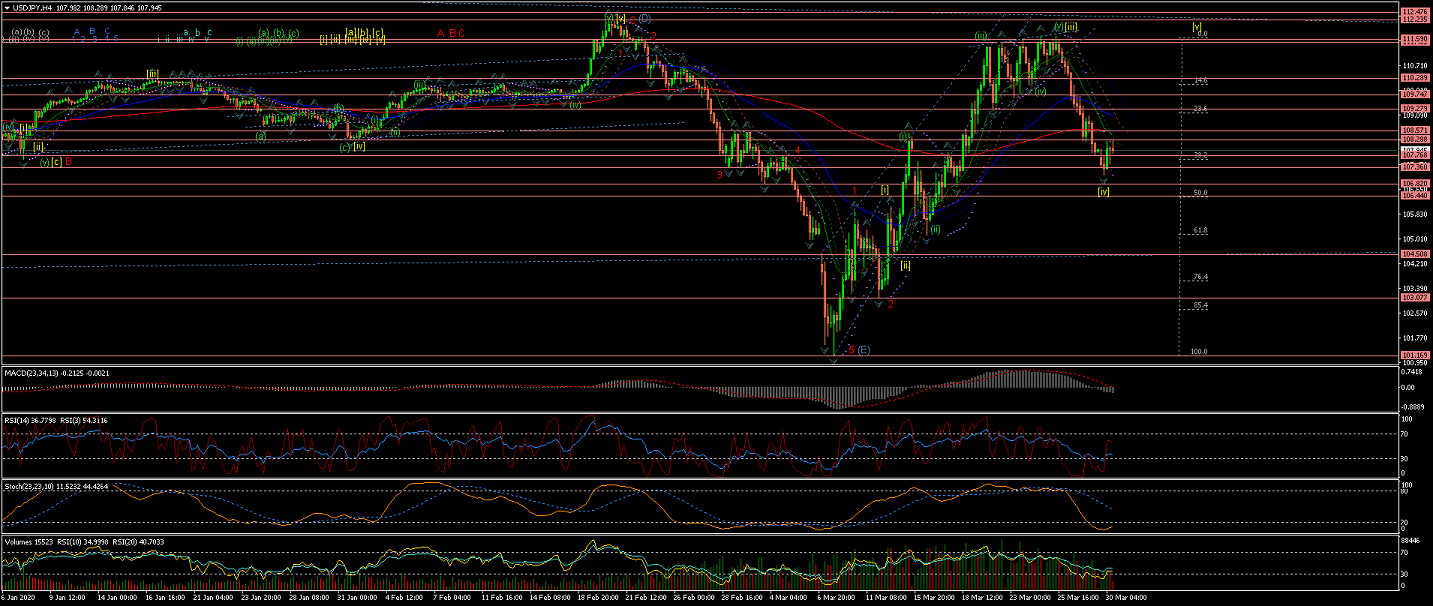
4Hour Chart shows a possibly completed Wave [iv] and now a rally up that
might have completed Wave [ii] at just below the %62 retracement of Wave [i].
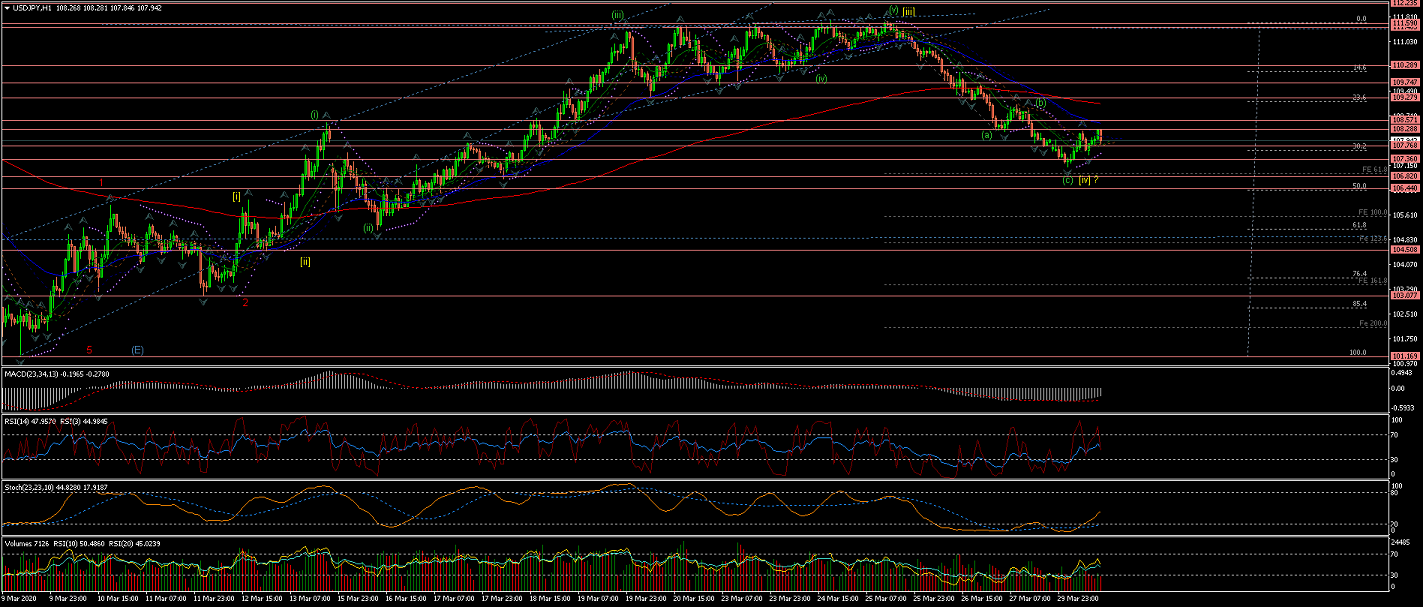
60Min Chart shows in more detail the internal waves of the developing Wave [iv],
where its internal current Wave (c) bounced of the %62 Fibo extension of Wave (a).
EURUSD
Weekly Chart, under the current interpretation,
shows a Wave 2(red) crossing slightly over the %62 retracement of Wave 1(red)
and now a sharp move down to start Wave 3(red).
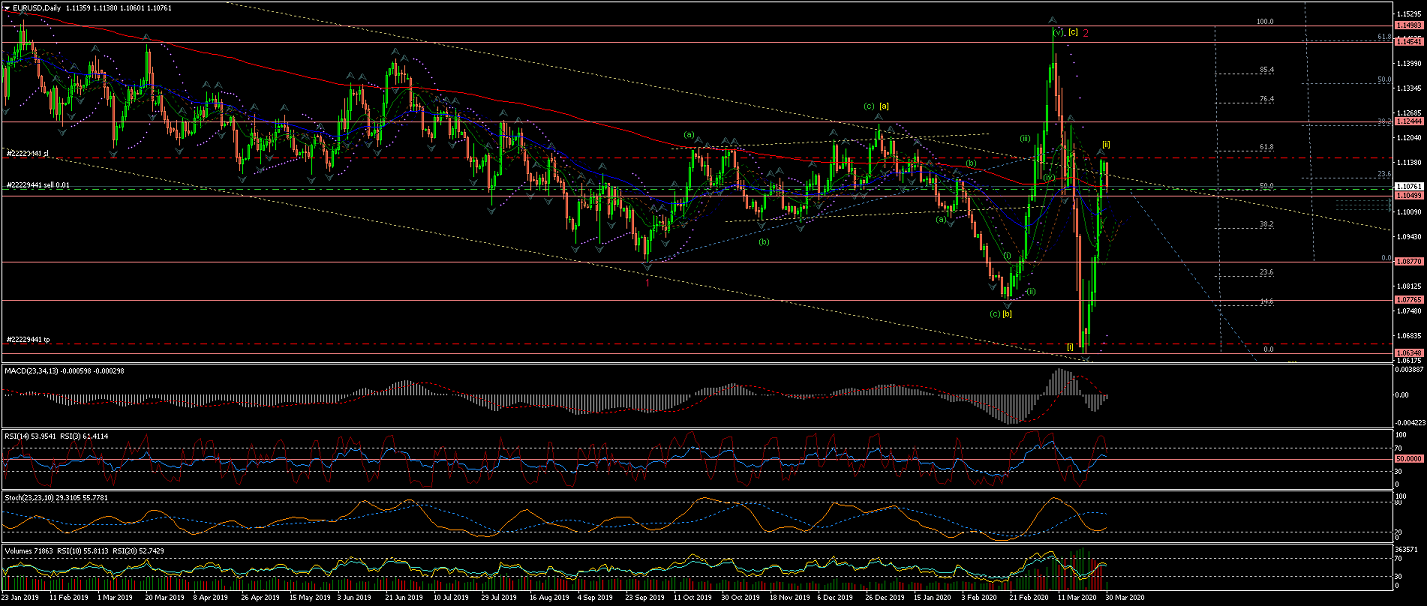
Daily Chart is showing Wave [ii] possibly completed after a rejection at close to the %62 retracement of Wave [i].
Further impulsive waves down will give more weight to the probability of Wave [iii] start.
4Hour Chart is showing Wave [ii] correction possibly completed and now looking for price drop continuation
into Wave [iii] of Wave 3(red)...
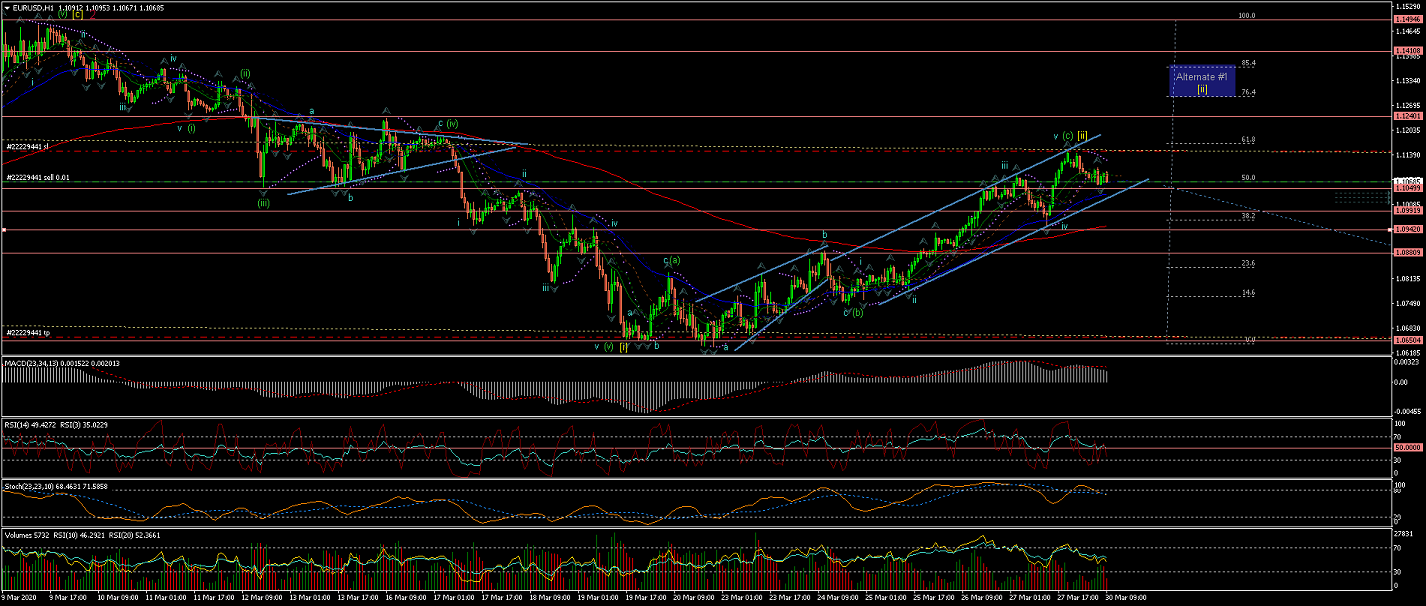
60Min Chart is showing more in detail the internal Waves of Waves [i] and [ii] showing signs of completion;
And we should expect a drop to cross the lowest of Wave [i] to confirm Wave [iii] underway.
GBPUSD
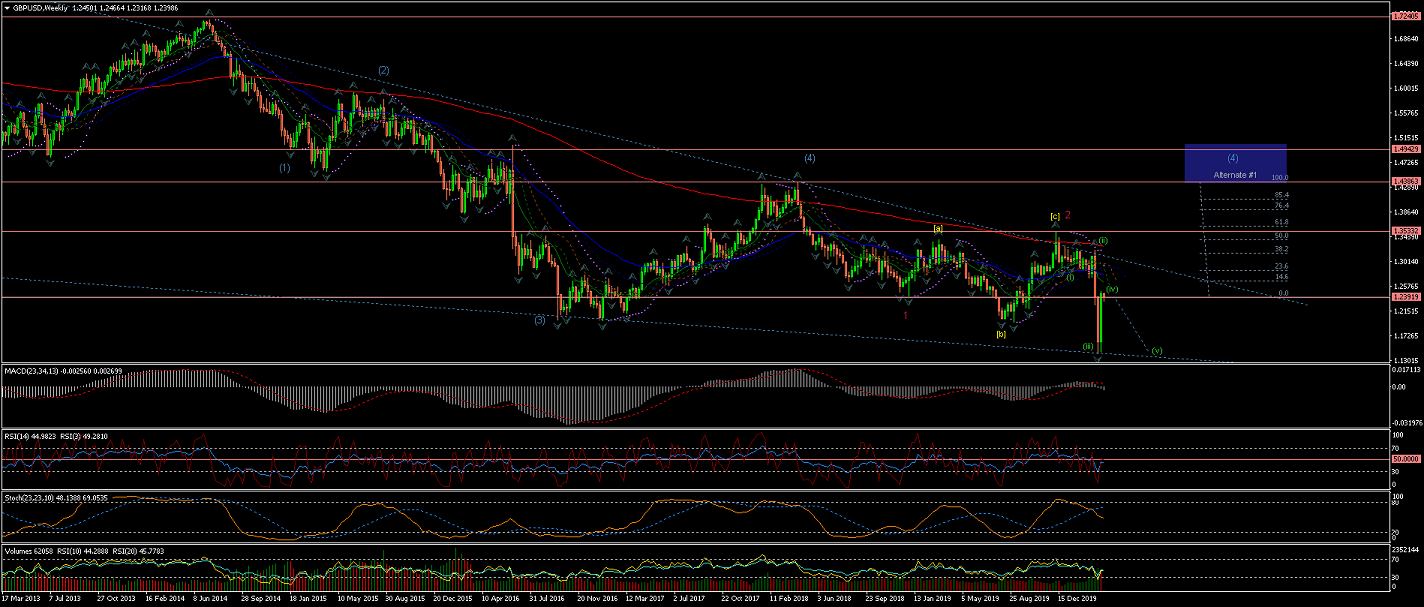
Weekly chart shows Wave 1(red) and a Wave 2(red) correction completed at the 200EMA level with a retracement
between %50 and %62 level.
Note Alternate #1 for a larger Wave (4) developing.
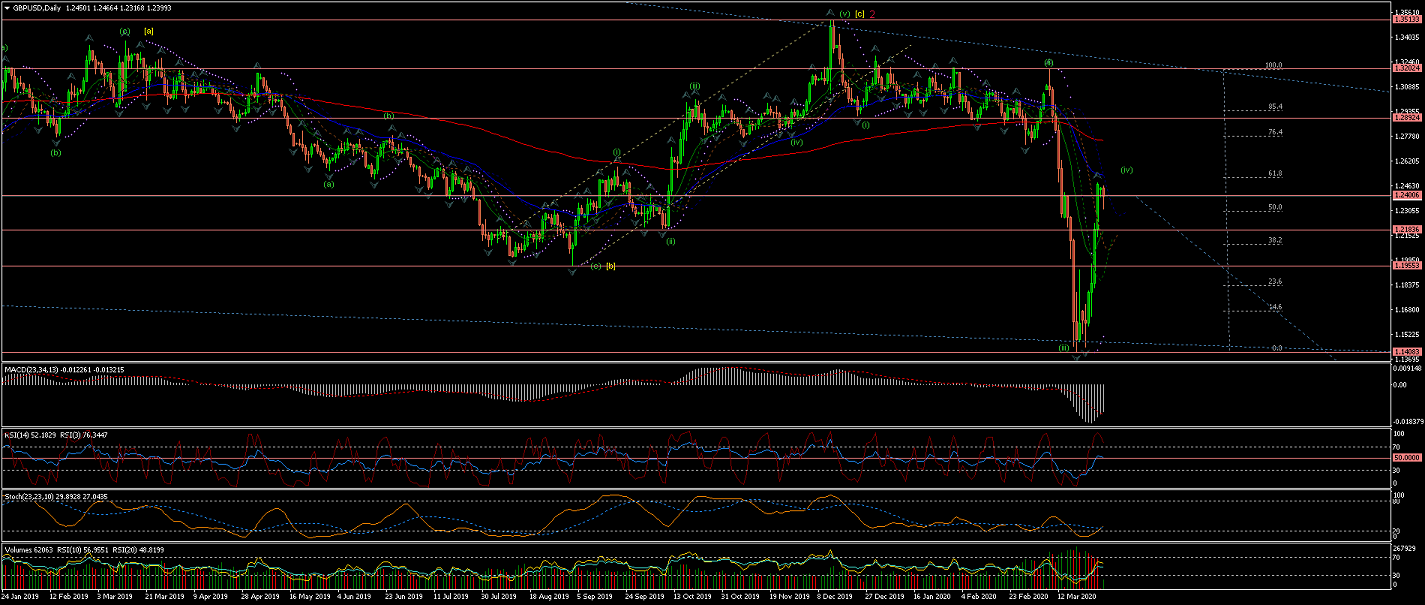
Daily Chart is showing the Wave (iii) (of Wave 3(red)) completed in a sharp move down,
in a similar setup as EURUSD.
The rally after is looking like an odd Wave (iv) correction; moving the price up now at nearly %62 retracement of Wave (iii).
4Hour Chart shows the 5 internal waves of Wave (iii) and the 3 internal waves for an expanded flat Wave (iv)
now stalled at the 200EMA and nearly %62 fibo retracement of Wave (iii).
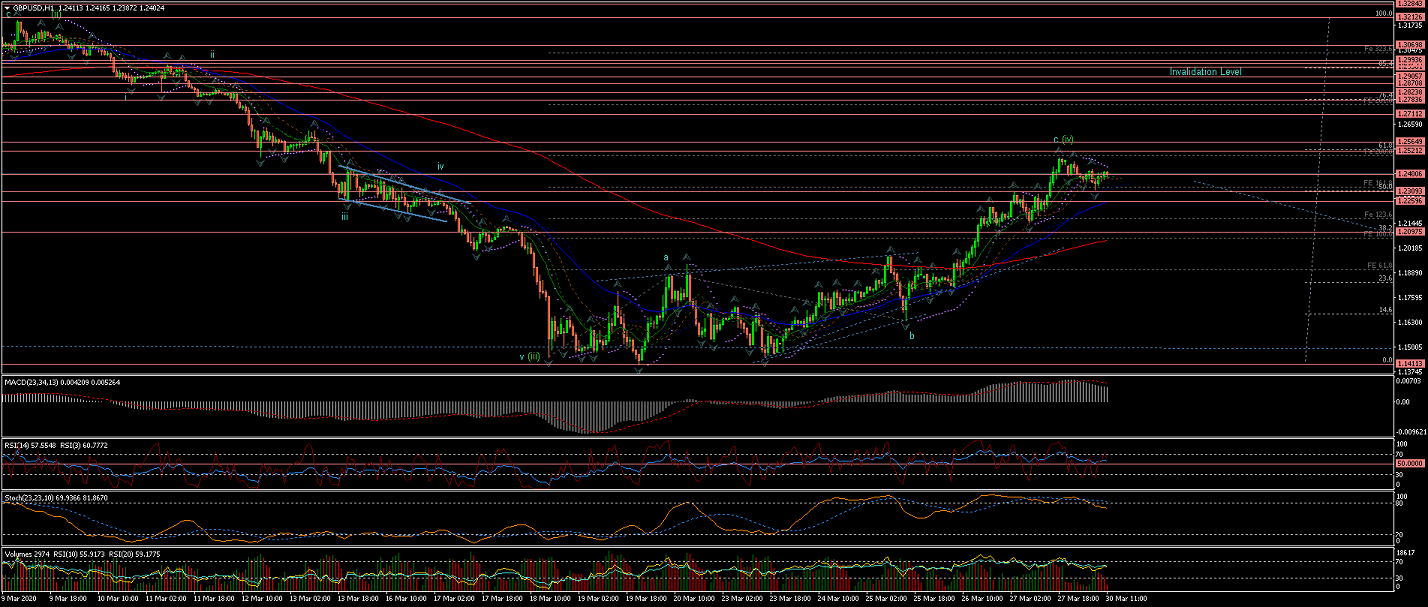
60Min Chart shows Wave (iv) reached the %200 Fibo extension of its internal Wave a at
the nearly %62 retracement level and same level of the previous lower level Wave iv.
All the best for everyone and please do not hesitate to contact me if you have any questions or comments.
Andres
info@tradingwaves.org


 Trading Waves .org