Fri 20-03-2020
Hi everyone, hope you are all ok.
Let's get into it...
USDJPY
Weekly Chart is showing how a completed Wave (E) has reached the %50 retracement of
the 5 waves raised upto year 2015;
A breakout of this long-term triangle would suggest the beginning of the start of Wave (1) of a long-term raise.
Bearing in mind that;
* The Alternate#1 count for an extended Wave (C)
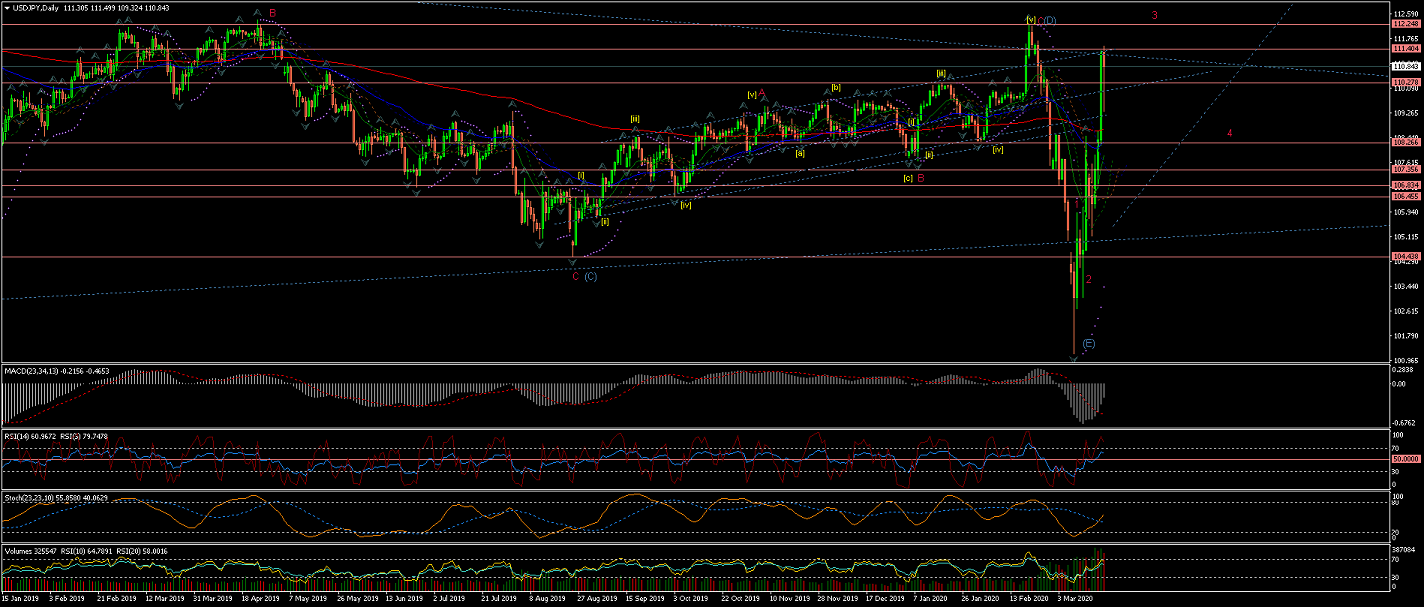
Daily Chart is showing Wave (E) completed with a extremely quick drop and a rise that followed up into the
triangle again to form 3 possible waves; Wave 1(red), Wave 2(red) and Wave 3(red) now being rejected at 111.404 resistance.
Next is confirmation of Wave 3(red) completion to move into Wave 4(red).
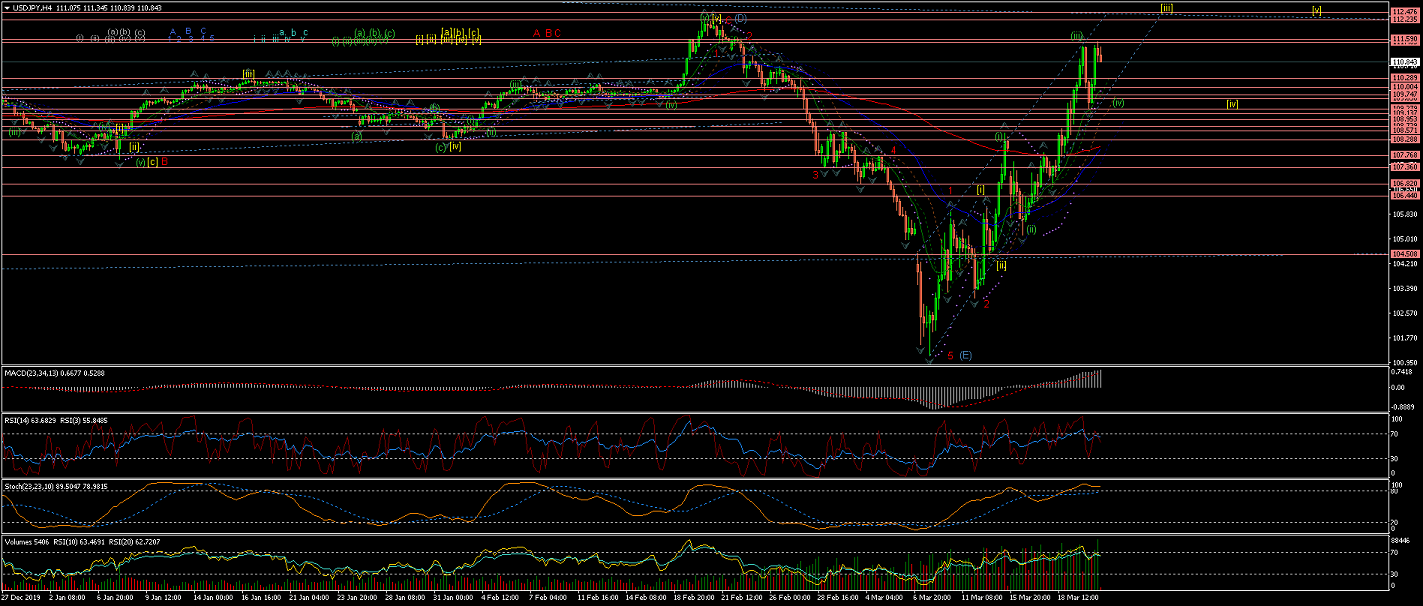
4Hour Chart shows the internal Waves of the current Wave 3(red) With its internal Wave [iii] still not looking complete
and a corrective move underway; which should be Wave (iv) of Wave [iii] still playing within a raising wedge.
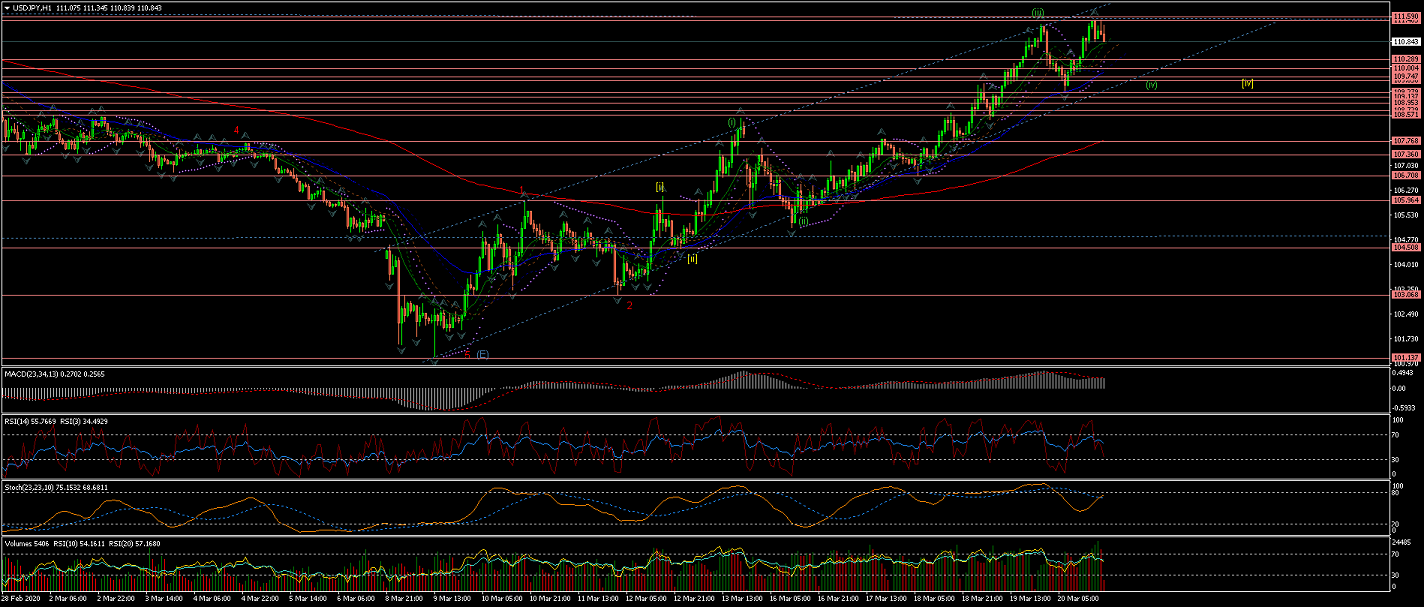
60Min Chart shows in more detail the internal waves up of the developing Wave [iii].
EURUSD
Weekly Chart, under the current interpretation,
shows a Wave 2(red) crossing slightly over the %62 retracement of Wave 1(red)
and now a sharp move down to start Wave 3(red).
Daily Chart is showing Wave 2(red) possibly completed after a clear rejection at the %62 retracement.
A series of impulsive waves down are pointing out to be the initial Waves (i), (ii) and (iii) of Wave [i] of Wave 3(red).
Next, we should expect Wave (iv) to move in a corrective way before Wave (v) continues trending down.
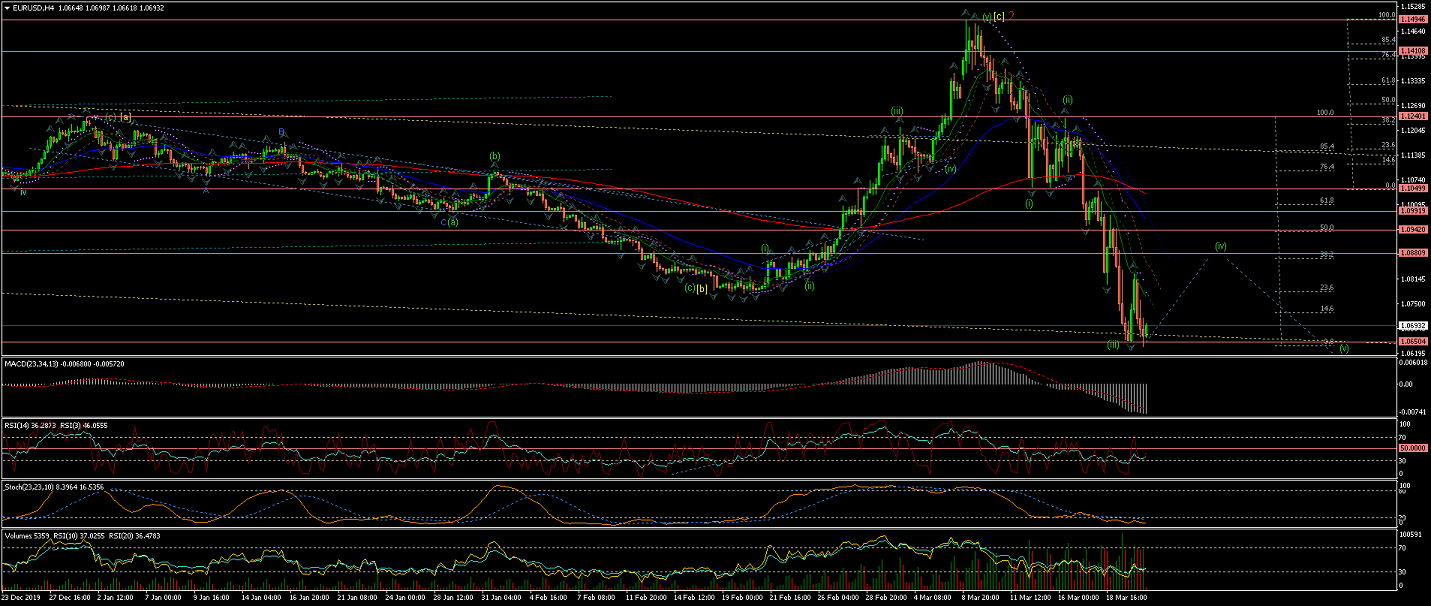
4Hour Chart is showing Wave (iii) down possibly completed and now looking for a reversal for Wave (iv) correction
Once Wave (iv) is completed, there should be a good opportunity (between %38 and %50 retracement of Wave (iii)) to take
on Wave (v) to the downside trend again.
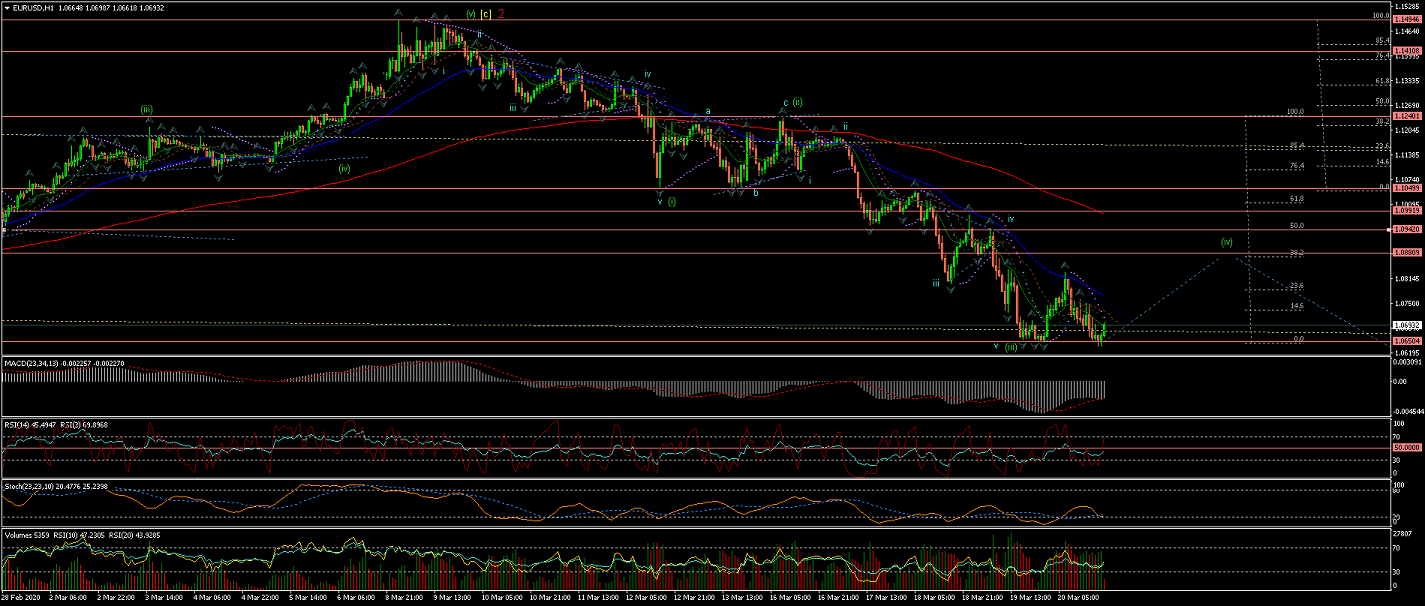
60Min Chart is showing more in detail the internal Waves of Wave (iii);
And we should expect a raise for Wave (iv) correction, possibly towards the 200EMA,
as it is where the %38 retracement of Wave (iii) lies before Wave (v) starts to bring the price down again.
GBPUSD
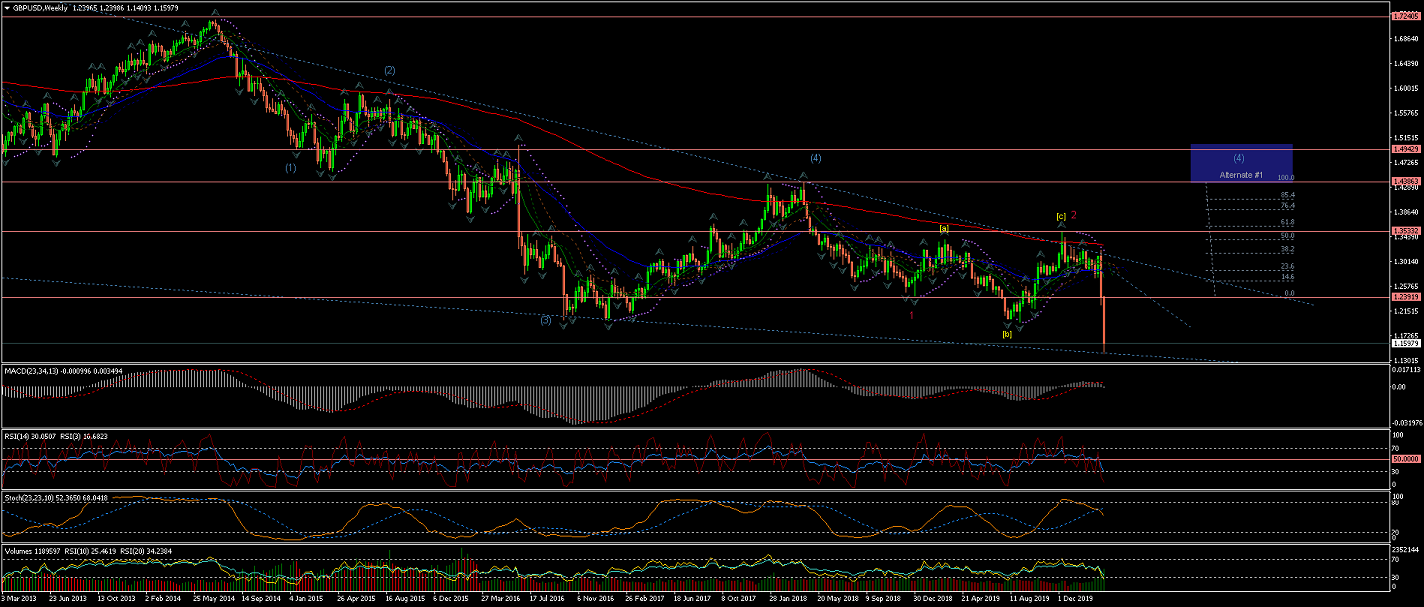
Weekly chart shows Wave 1(red) and a Wave 2(red) correction completed at the 200EMA level with a retracement
between %50 and %62 level.
Note Alternate #1 for a larger Wave (4) developing.
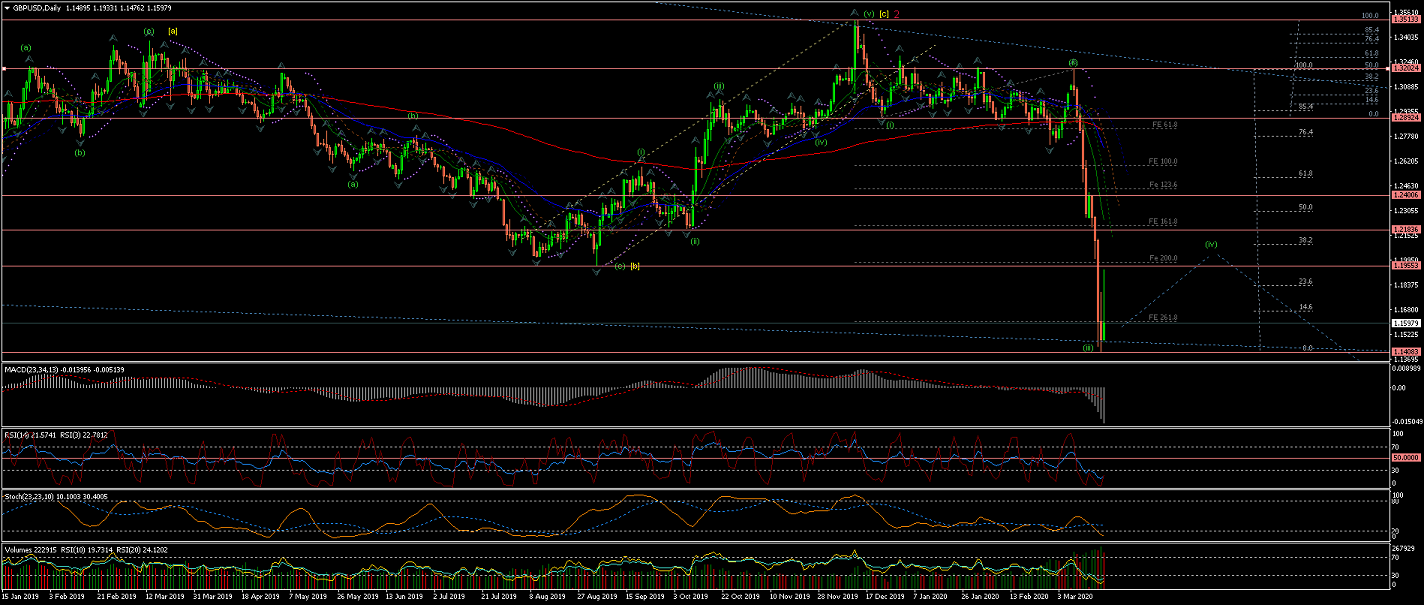
Daily Chart is showing the Wave (iii) (of Wave 3(red)) completed in a sharp move down,
in a similar setup as EURUSD.
Next we should expect Wave (iv) correction to move the price up towards the %38 to %50 retracement of Wave (iii).
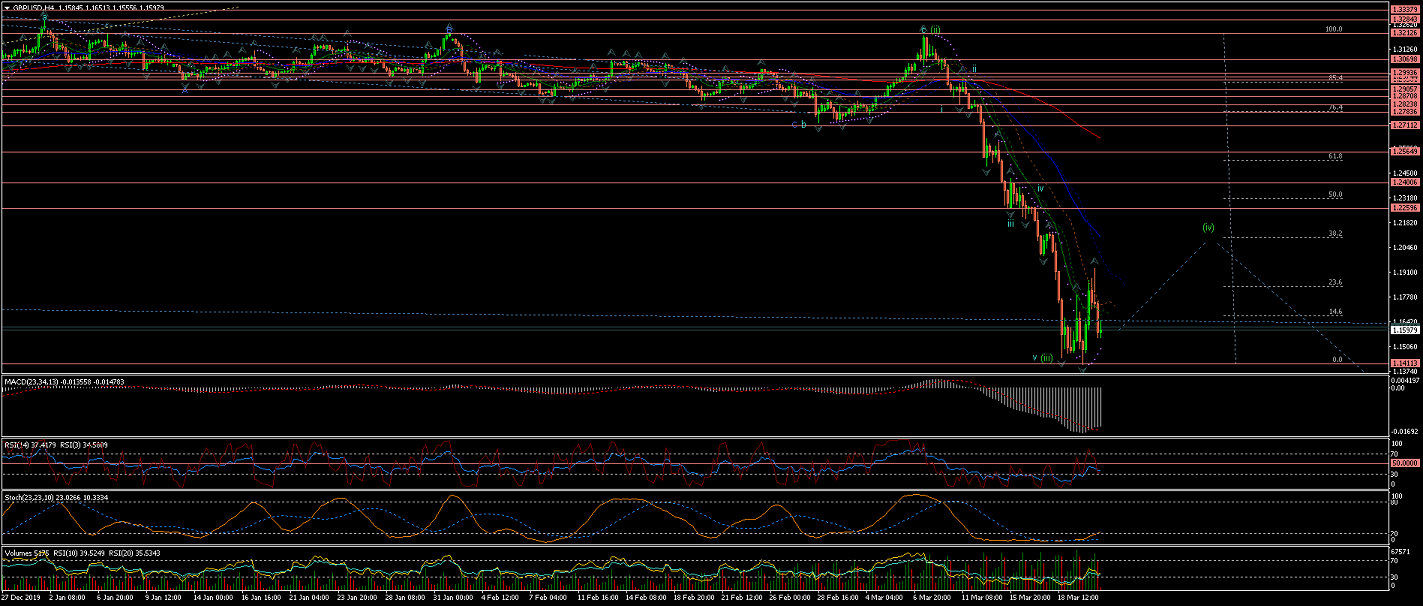
4Hour Chart shows the 5 internal waves of Wave (iii) and the initial move up for corrective Wave (iv)
towards the 200EMA and %38 to %50 fibo retracement of Wave (iii).
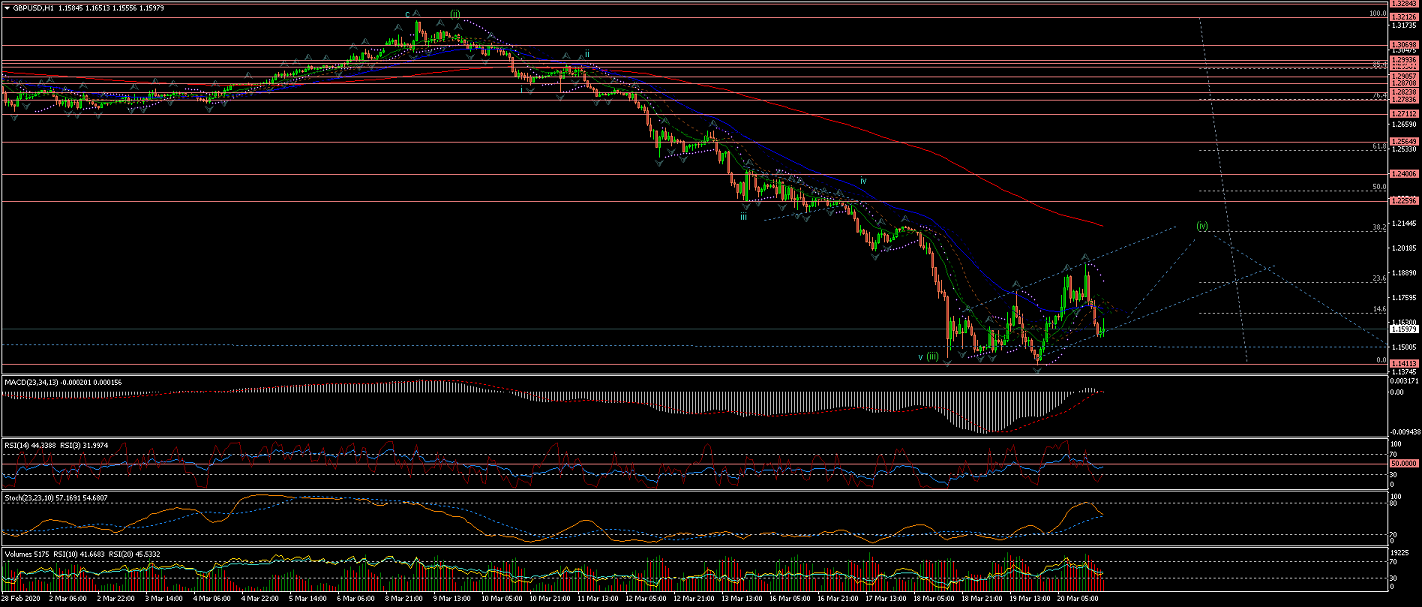
60Min Chart shows Wave (iv) starting to develop a trend-line towards the 200EMA and %38 to %50 retracement of Wave (iii)
All the best for everyone and please do not hesitate to contact me if you have any questions or comments.
Andres
info@tradingwaves.org


 Trading Waves .org