Fri 13-03-2020
Hi everyone, hope you are all ok.
Let's get into it...
USDJPY
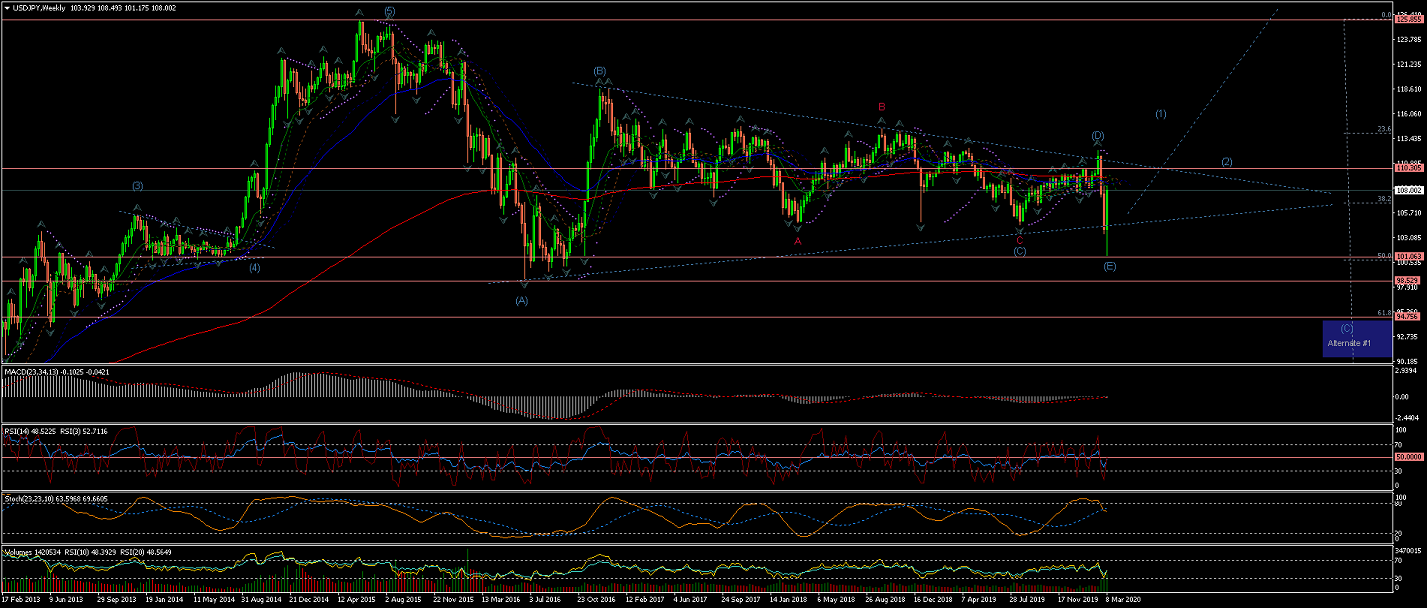
Weekly Chart is showing how previous Alternate #2 count has been triggered and Wave (E) has reached the %50 retracement of
the 5 waves raised up to year 2015.
The price has surged into the triangle formation again for the possible start of Wave (1) of a long-term raise.
Bearing in mind that;
* The Alternate#1 count for an extended Wave (C)
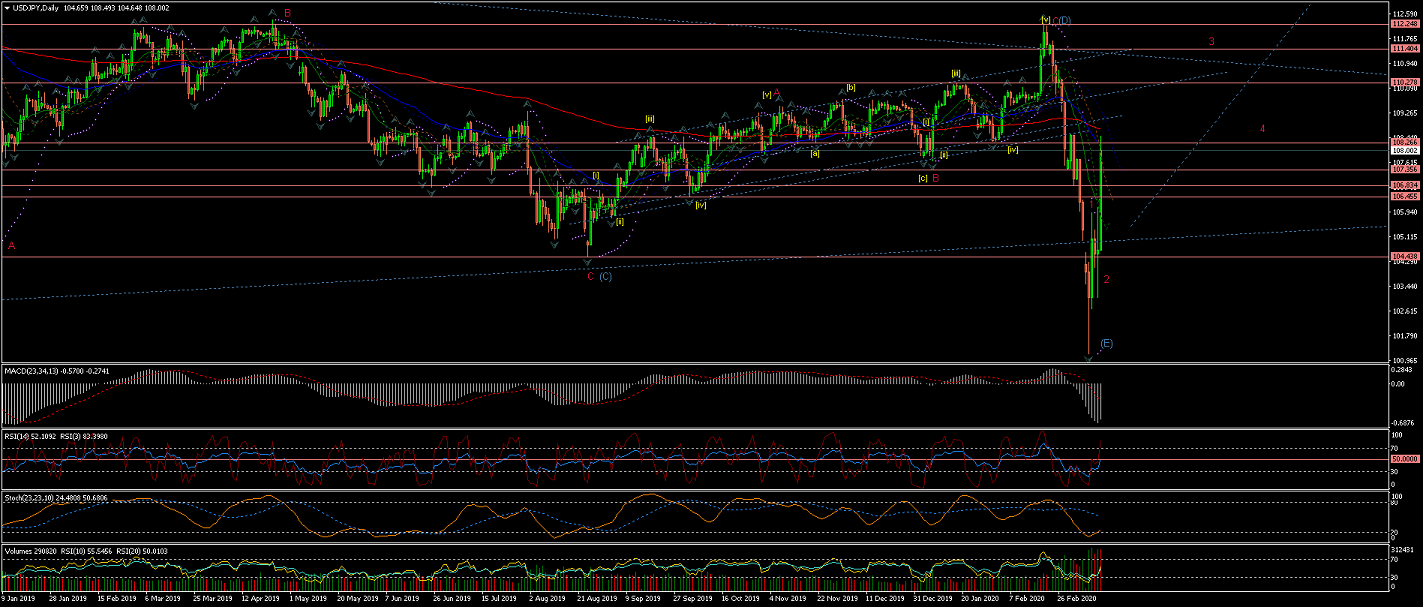
Daily Chart is showing the new count As Wave (E) completed with a extremely quick drop and a rise that followed up into the
triangule again to form Wave 1(red) and an already completed Wave 2(red).
Next is the completion of the already started Wave 3(red).
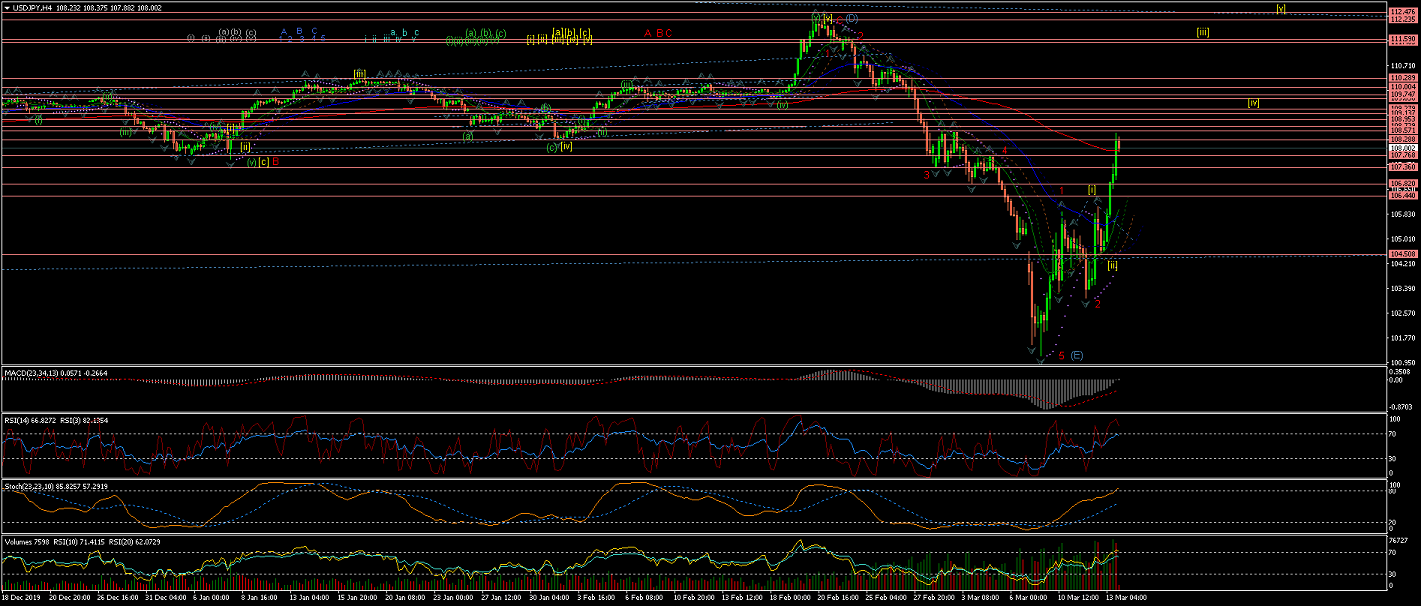
4Hour Chart shows the internal Waves of the current Wave 3(red) and the projection for the continuation of this
raise towards the upper long term trend line
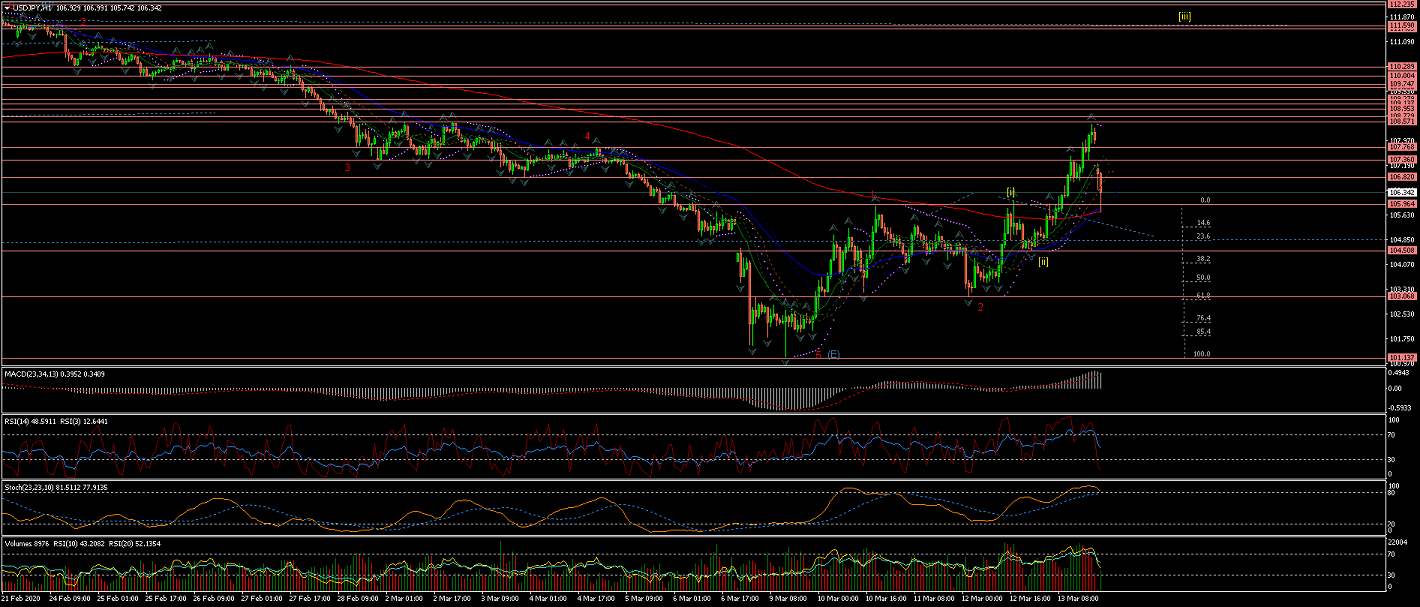
60Min Chart shows in more detail the 5 internal waves up of Wave 3(red) still under development.
EURUSD
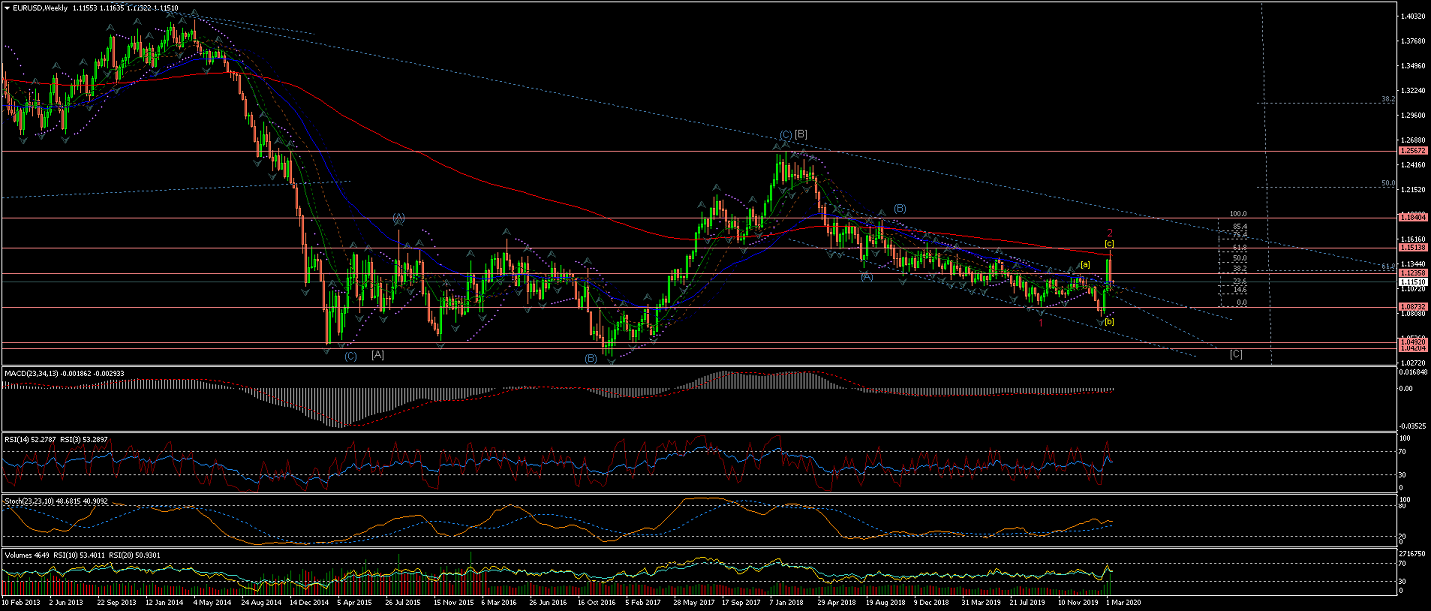
Weekly Chart, under the current interpretation
shows a Wave 2(red) crossing slightly the %62 retracement of Wave 1(red)
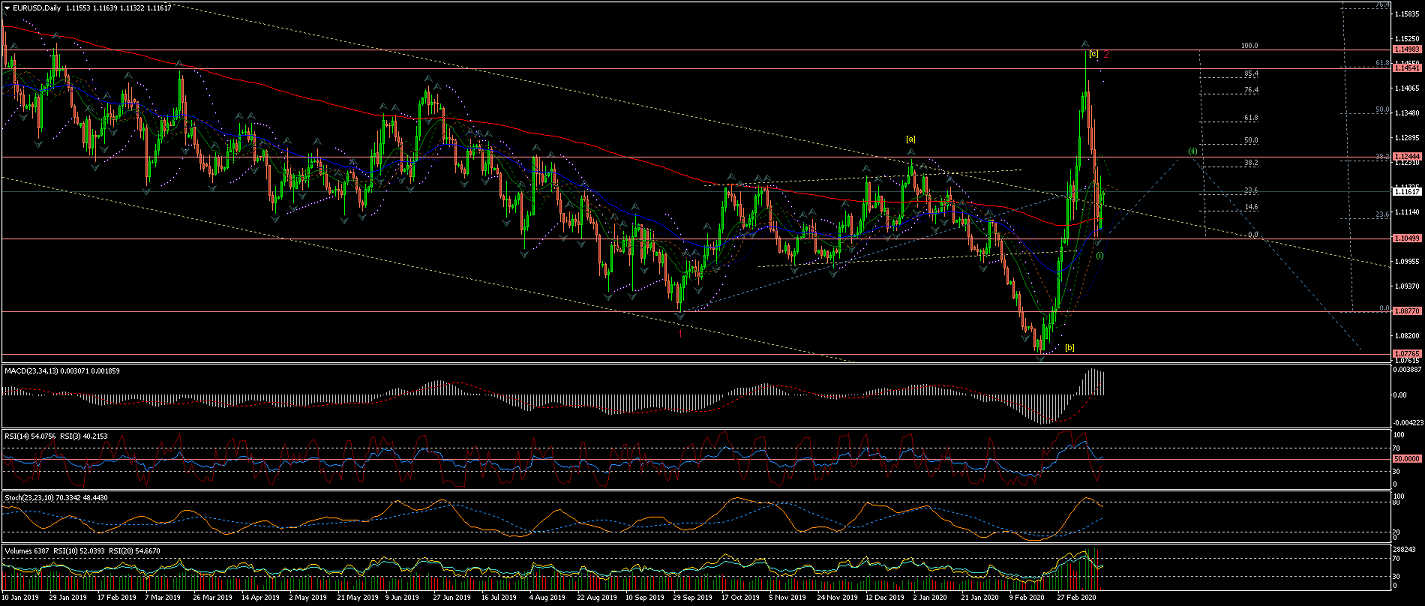
Daily Chart is showing Wave 2(red) possibly completed after a clear rejection at the %62 retracement.
An impulsive move down that suggest to be the initial Wave (i) of Wave [i] of Wave 3(red).
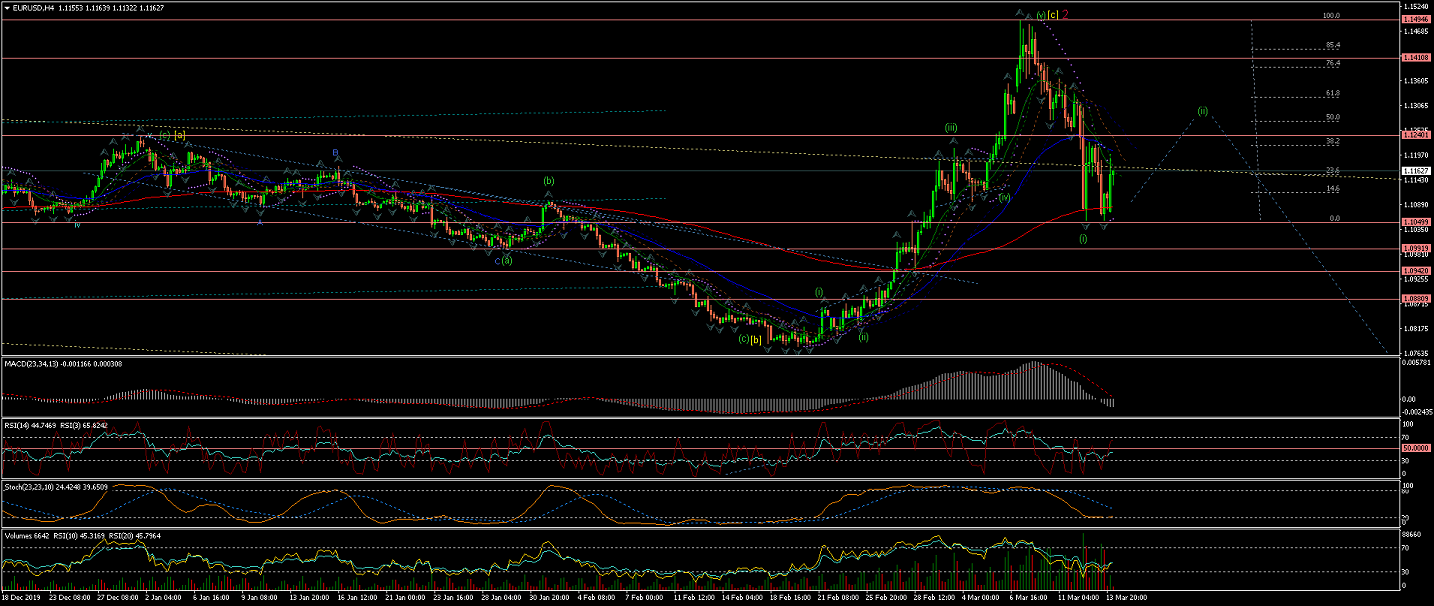
4Hour Chart is showing Wave (i) down possibly completed and now looking for a reversal for Wave (ii) a correction
Once Wave (ii) is completed, there should be a good opportunity to take on Wave (iii) to the downside trend again.
60Min Chart is showing the internal Waves of Wave (i);
And we should expect a raise for Wave (ii) correction in the next couple of sessions or so
before Wave (iii) brings the price down again.
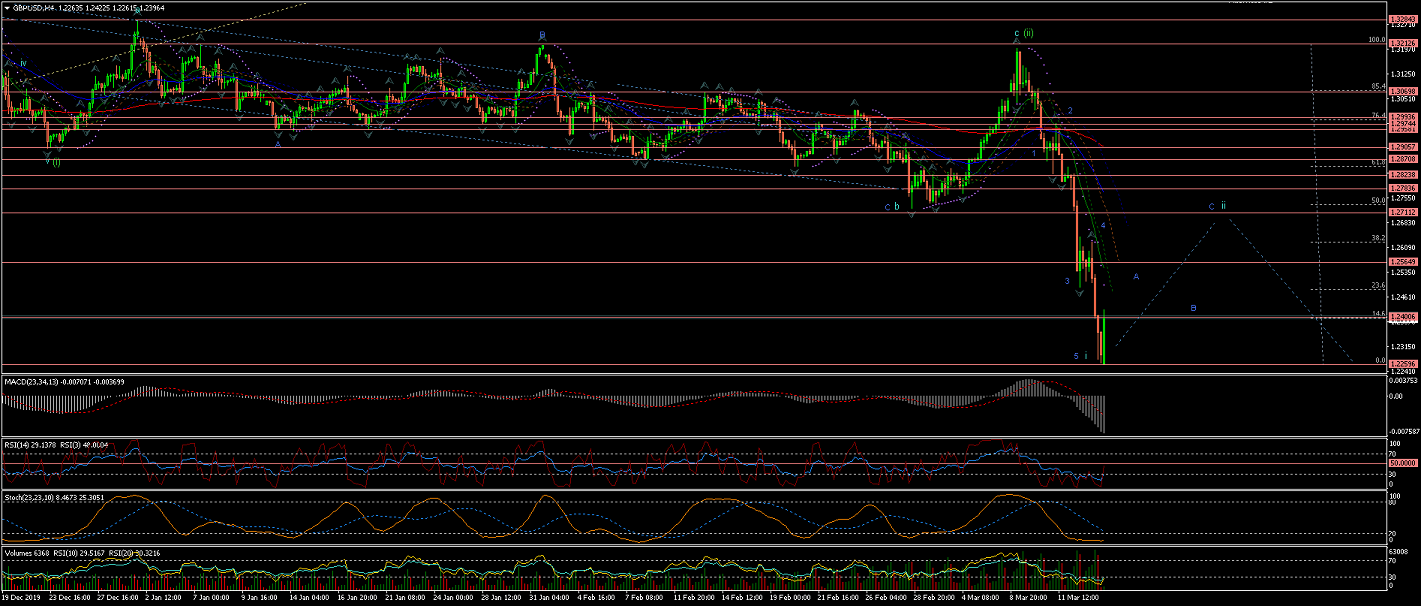
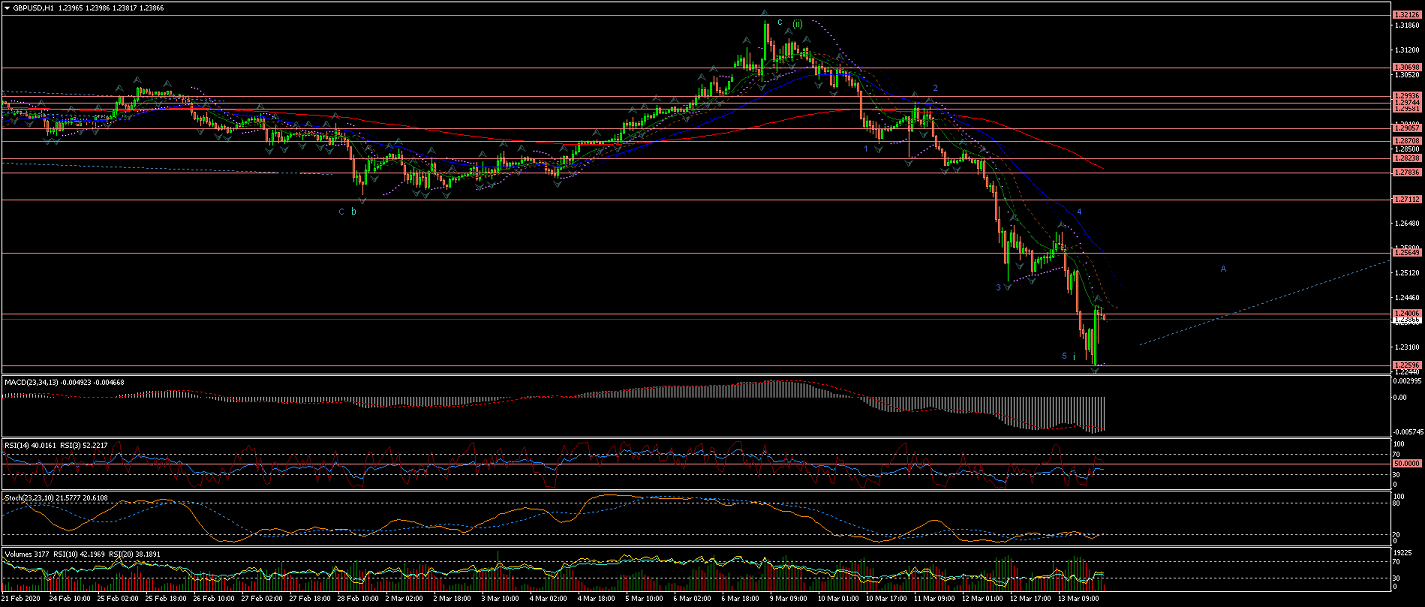
GBPUSD
Weekly chart shows Wave 1(red) and a Wave 2(red) correction completed at the 200EMA level with a retracement between %50 and %62 level.
Note Alternate #1 for a larger Wave (4) developing.
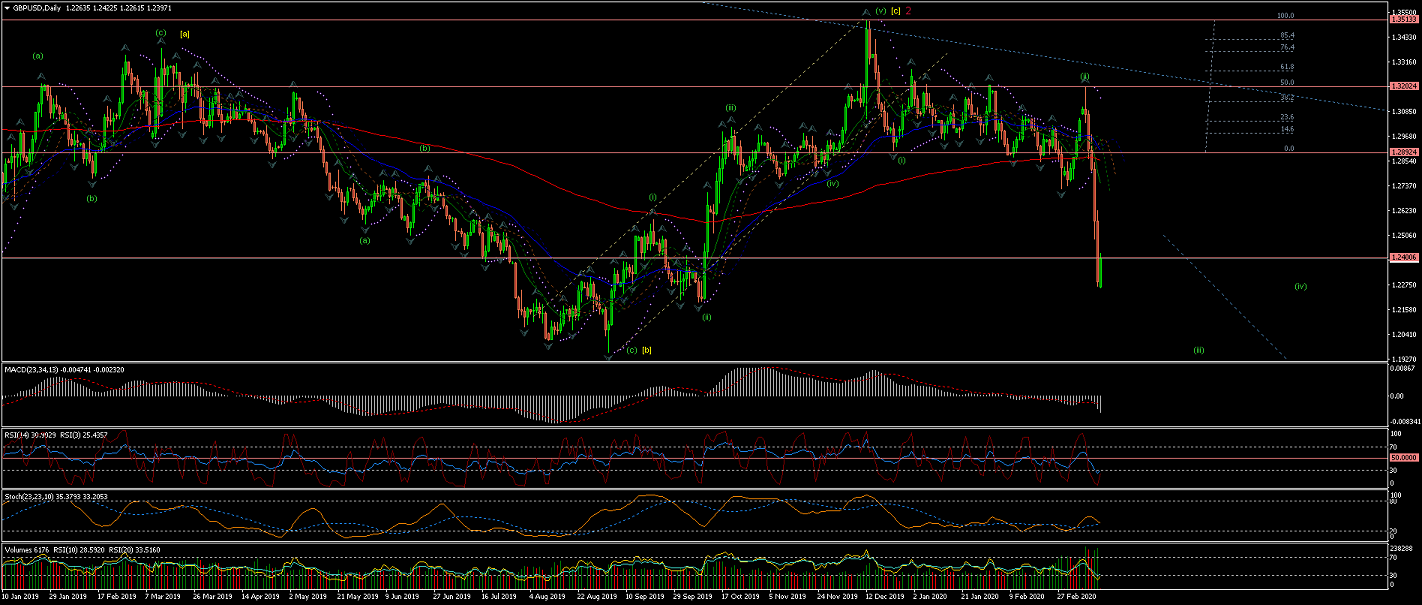
Daily Chart is showing the initials Wave (i) and Wave (ii) of Wave [i](yellow) (of Wave 3(red)) completed
after an impulsive move down suggested the start of Wave (iii) down.
4Hour Chart shows an impulsive drop that suggests the move to be the initial internal Wave i of Wave (iii).
60Min Chart shows Wave i being completed with 5 internal waves
and an impulsive move up suggesting the start of Wave A of Wave ii.
All the best for everyone and please do not hesitate to contact me if you have any questions or comments.
Andres
info@tradingwaves.org


 Trading Waves .org