Fri 21-02-2020
Hi everyone, hope you are all ok.
Let's get into it...
USDJPY
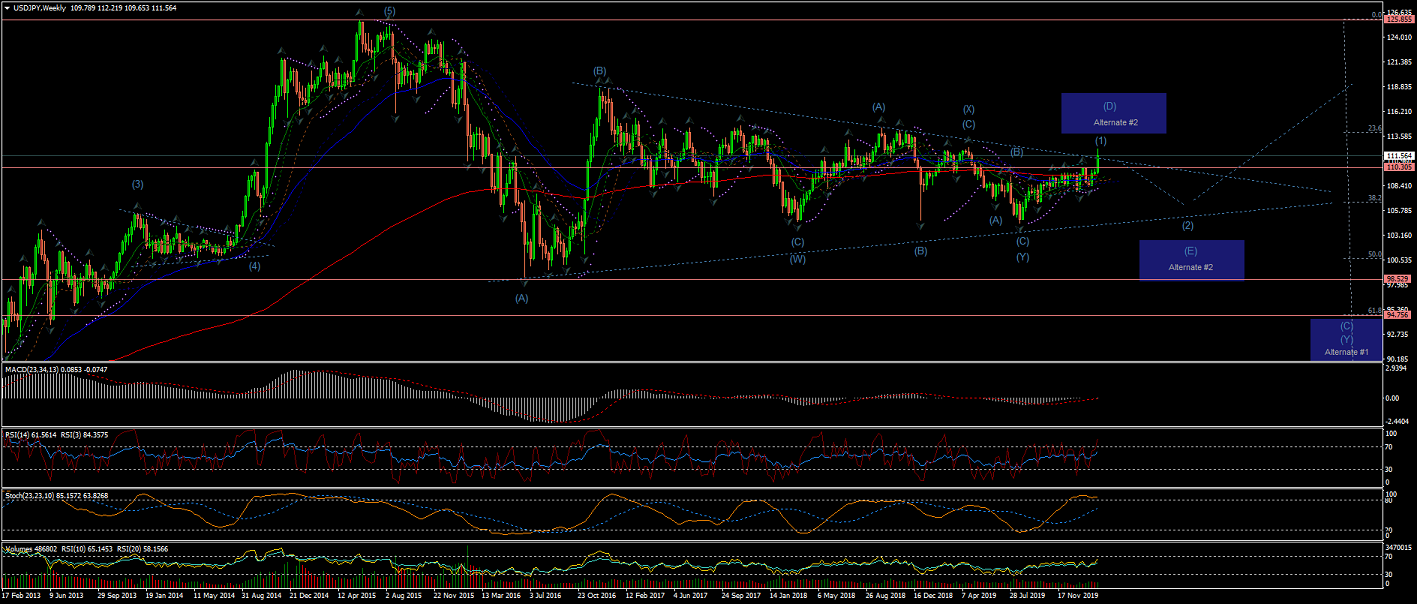
Weekly Chart is showing the price crossed the long term upper trend line for Wave (1), under the current count;
* Bearing in mind the Alternate#1 count for an extended Wave (C) of Wave (Y)
* And Alternate #2 for a Wave (D) topping at the upper trend line and then targeting the lower trend for Wave (E).
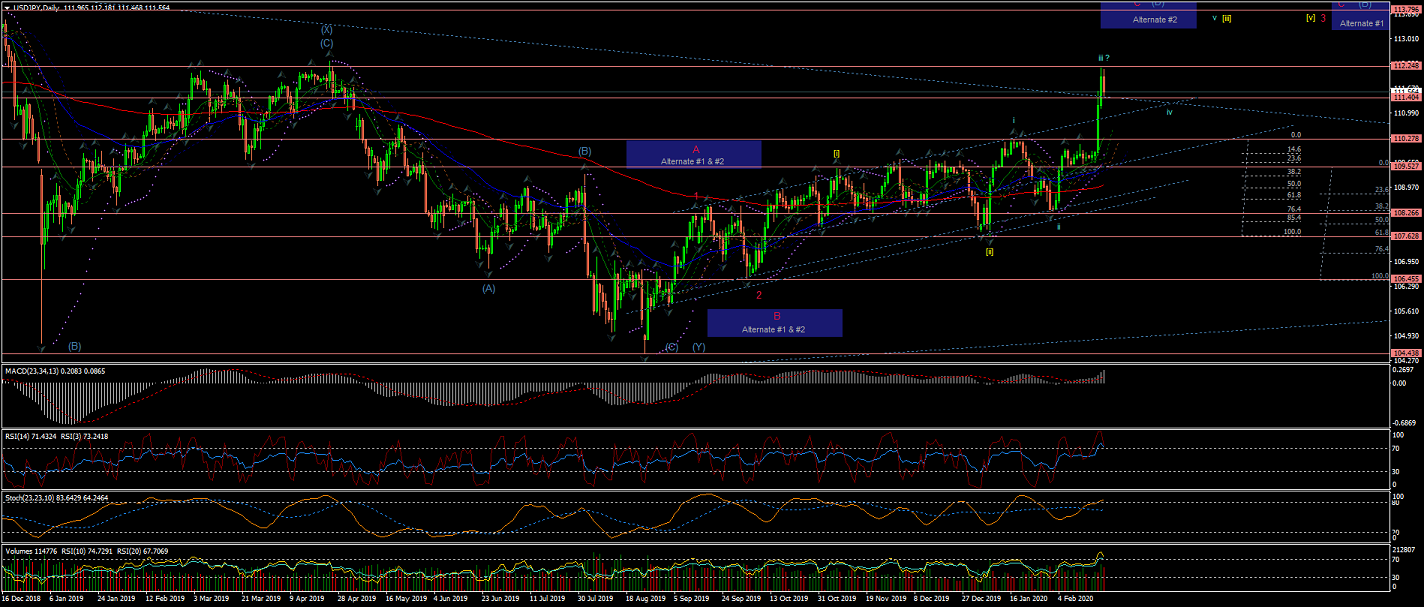
Daily Chart is showing Wave iii of Wave [iii] developing impulsive moves across the upper trendline.
Although there is still the possibility of a fake breakout for Wave C(red) of Wave (D);
marked as Alternate #2.
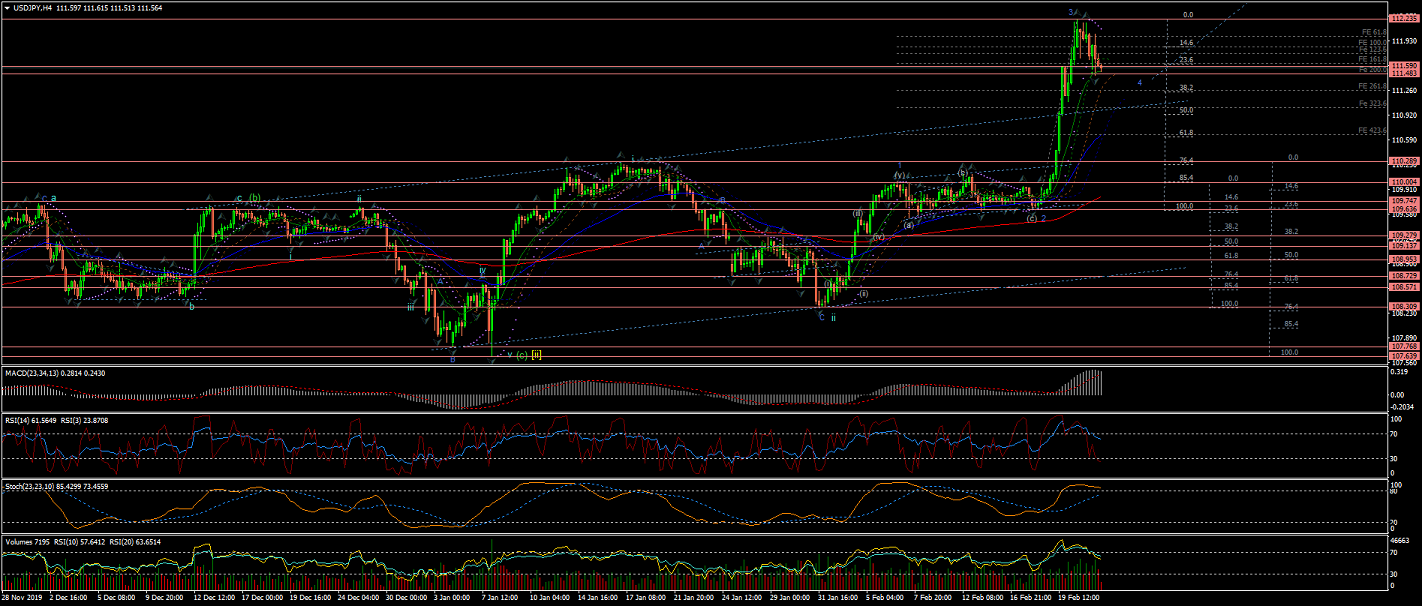
4Hour Chart shows Wave 3(blue) of Wave iii possibly complete at nearly 1 Fib Extension of Wave 1(blue)
as the price reversed back towards the trendline and support levels;
This reversal should now be forming Wave 4(blue) correction under the current count (unless Wave 3(blue) gets further extended).
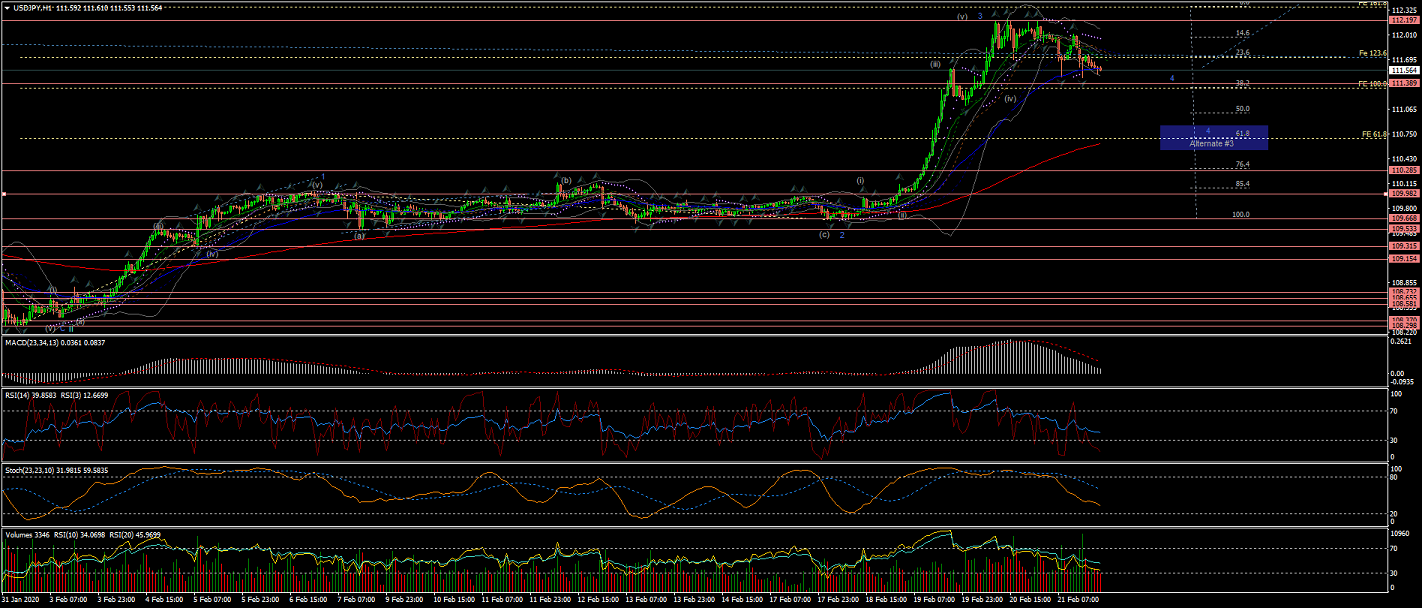
60Min Chart shows in more detail the 5 internal waves of Wave 3(blue).
And the early stages of the correction forming now as Wave 4(blue).
The initial target for Wave 4(blue) is to complete at %38 retracement of Wave 3(blue),
Although I have marked Alternate #3 for a correction towards the 200EMA at the %61Fib retracement.
EURUSD
Weekly Chart, under the current interpretation, shows a Wave [C] developing towards
the %76 retracement of the 5-Waves raise from 2002 to 2008.
(This will lead to the lows of 2014)
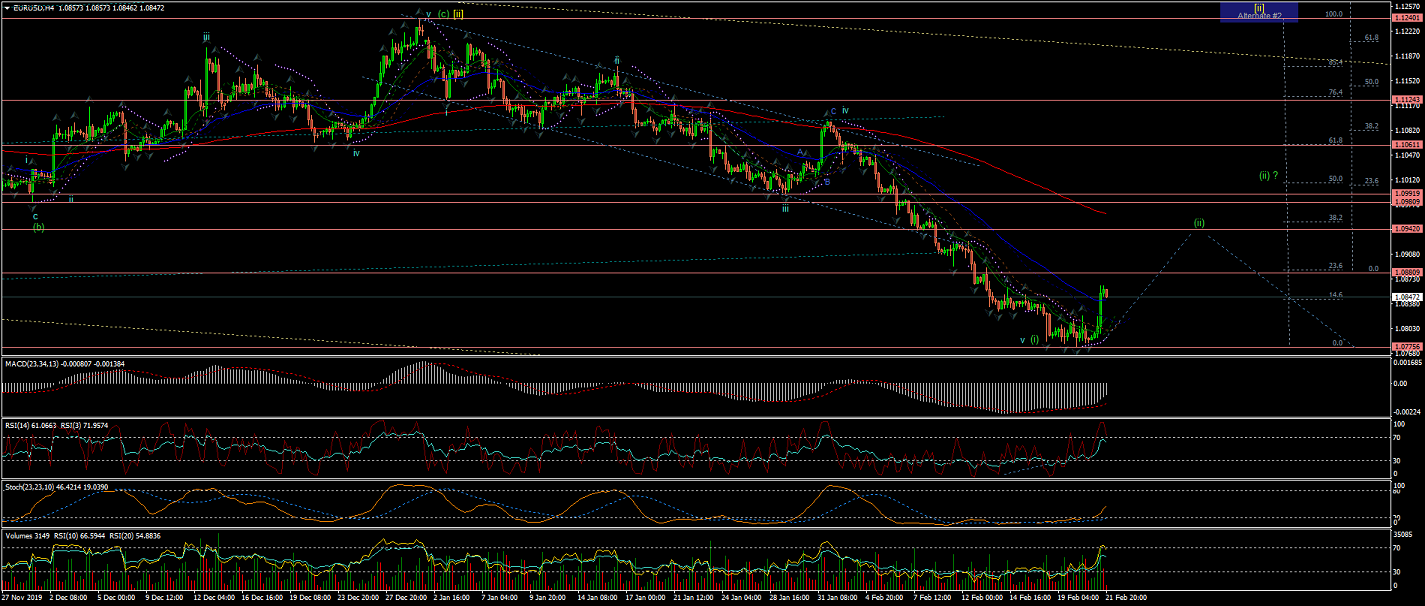
Daily Chart is showing Wave [iii] taking a series of impulsive and showing a big area of support
at 1.07765 where is trying to find a bottom.
Although there is still a possibility for Alternate #1 for larger Wave 1 and 2 (red).
And Alternate #2 for an expanded Flat Wave [ii] to cross the upper trendline again.
4Hour Chart is showing Wave v of Wave (i) been extended and completed at support levels of 1.07756
Wave (ii) has started to raise the price way towards the %38 as the initial retracement levels (200EMA).
(There is a strong bearish sentiment and, after Wave (ii) correction, there is a Wave (iii) that is most probable to carry an even
more impulsive set of impulsive waves).
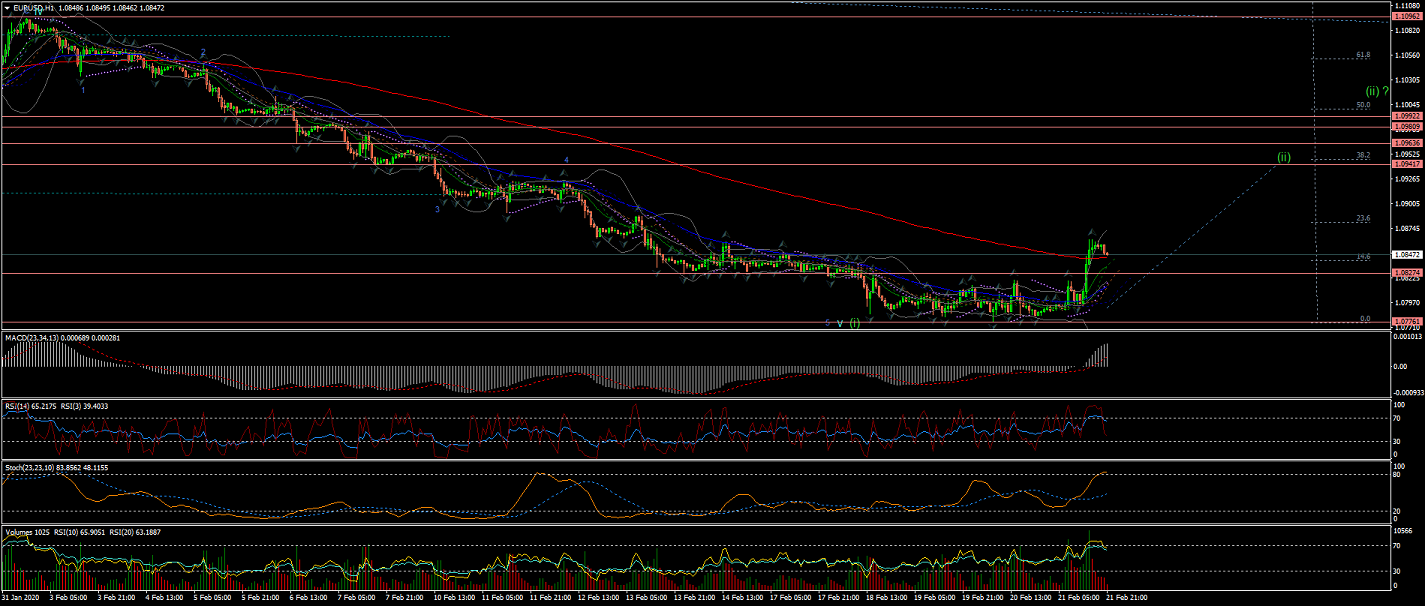
60Min Chart is showing the internal Waves of Wave v having completed Wave (i).
And a bug rally confirming the initial start of Wave (ii); So too early to determine the type of correction.
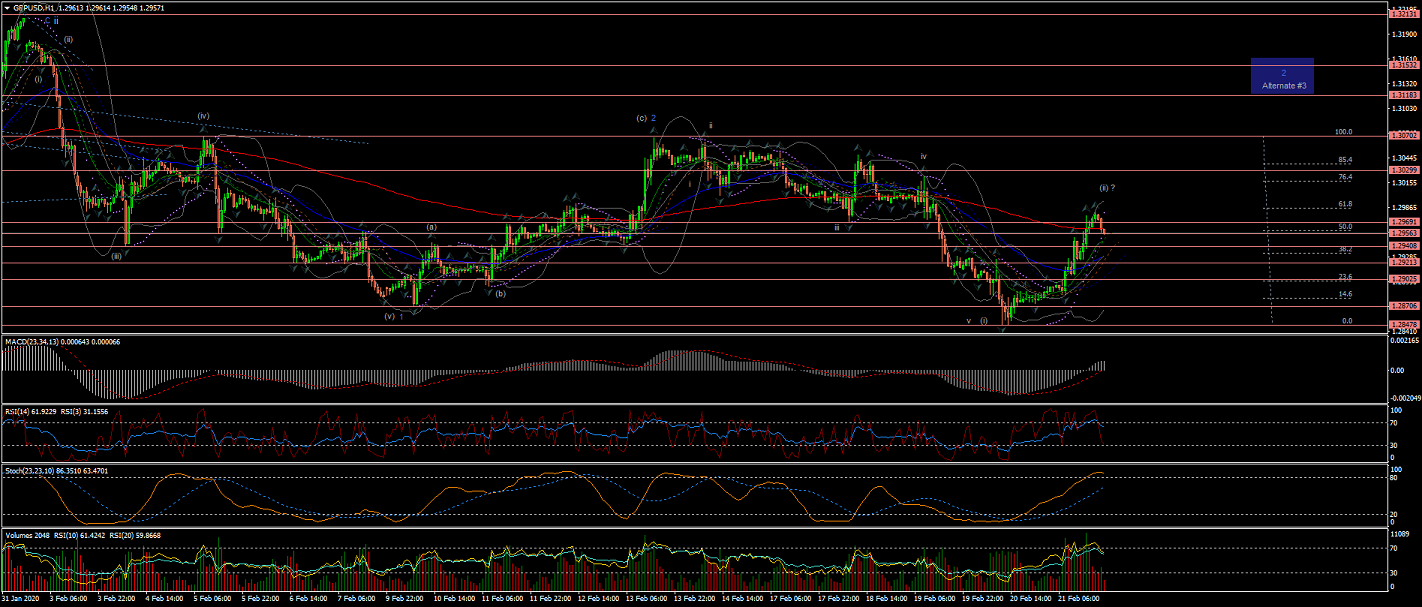
GBPUSD
Weekly chart shows Wave 1(red) and a Wave 2(red) correction completed at the 200EMA level with a retracement between %50 and %62 level.
Note Alternate #1 for a larger Wave (4) developing.
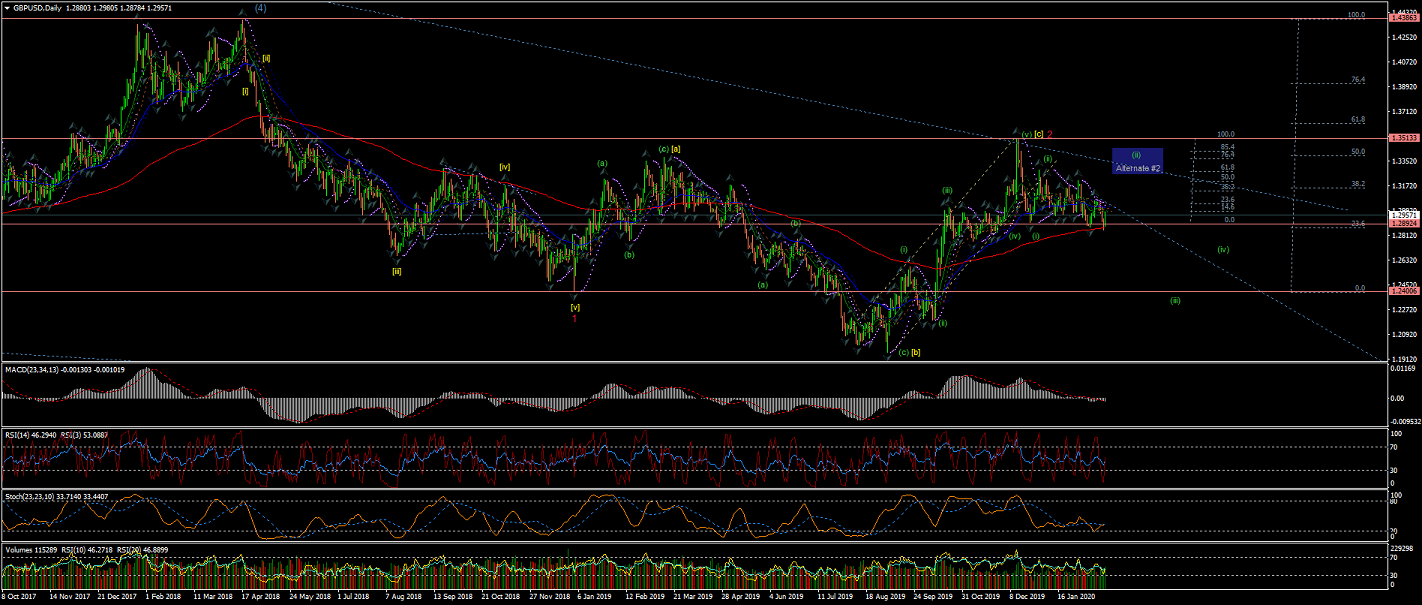
Daily Chart is showing the initials Wave (i) and Wave (ii) of Wave [i](yellow) (of Wave 3(red)) most likely completed.
And now Wave (iii) likely under development, although yet struggling to cross the lowest of Wave (i)(green) and 200EMA.
Hence, I have marked Alternate #2 for a possible extended Wave (ii) in the form of an expanded Flat correction.
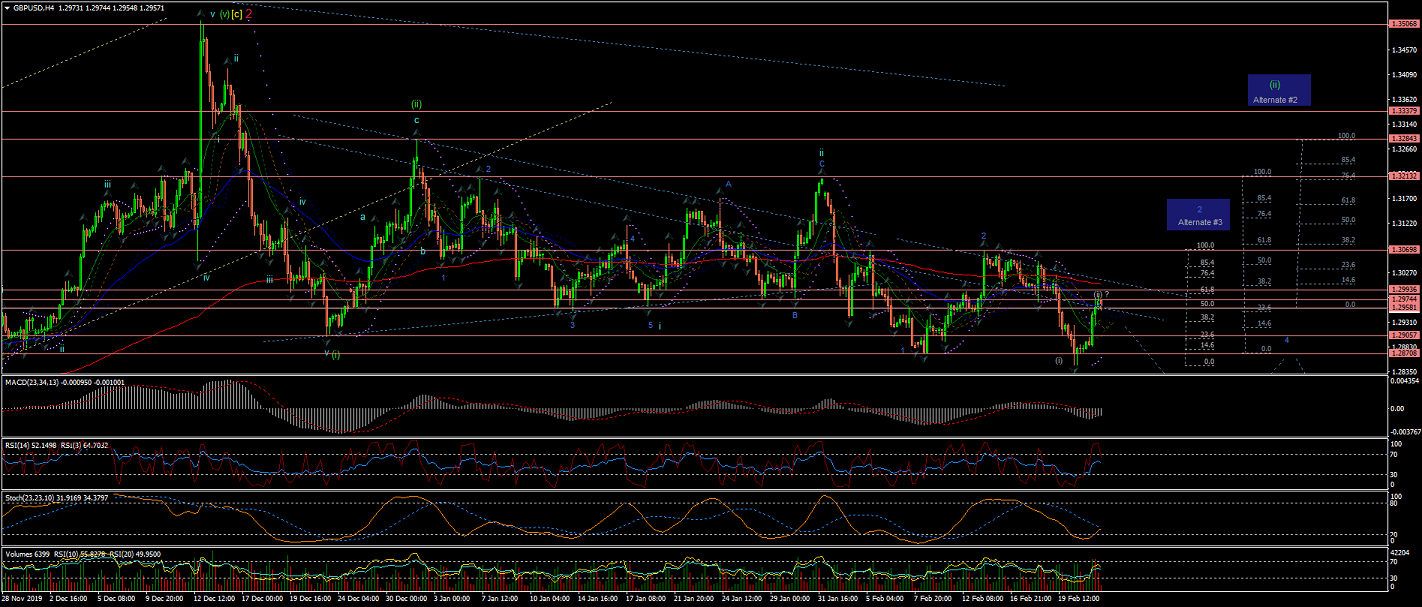
4Hour Chart shows the current count now stands for Waves 1(blue) and Wave 2(blue) of Wave iii completed already.
Unless Alternate #3 is triggered by crossing the 0 retracement of the just completed Wave (i) for an expanded Flat Wave 2(blue).
As per current count, Wave (i) of Wave 3(blue) should now be completed, as just mentioned,
and Wave (ii) had a rejection at the %62 retracement of Wave (i),
although there has not been a clear confirmation that Wave (iii) is underway,
so this correction could still take the price higher and/or take more time to complete.
60Min Chart shows the internal 5 waves of Wave (i) completed
And now a Wave (ii) correction that has reached the %62.
All the best for everyone and please do not hesitate to contact me if you have any questions or comments.
Andres
info@tradingwaves.org


 Trading Waves .org