Tue 11-02-2020
Hi everyone, hope you are all ok.
Let's get into it...
USDJPY
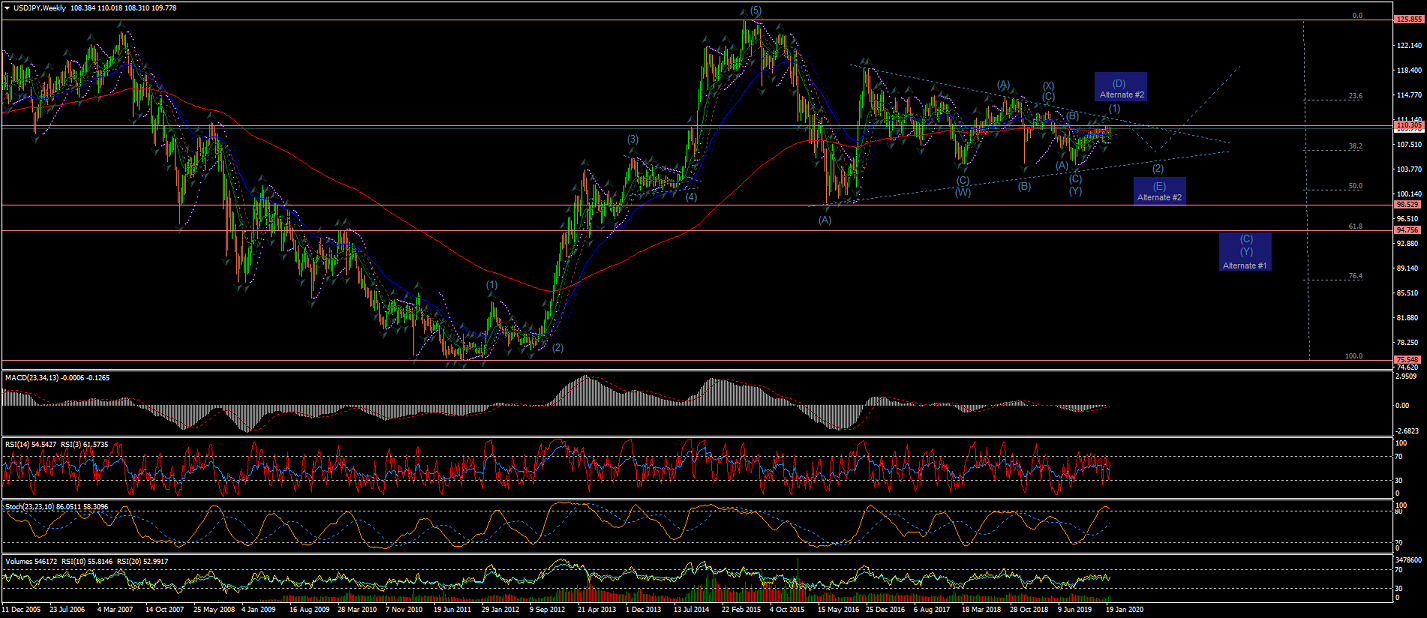
Weekly Chart is showing the price hitting the 200EMA and dropping after almost reaching the long term upper trend line for Wave (1);
* Bearing in mind the Alternate#1 count for an extended Wave (C) of Wave (Y)
* And Alternate #2 for a Wave (D) topping at the upper trend line and then targetting the lower trend for Wave (E).
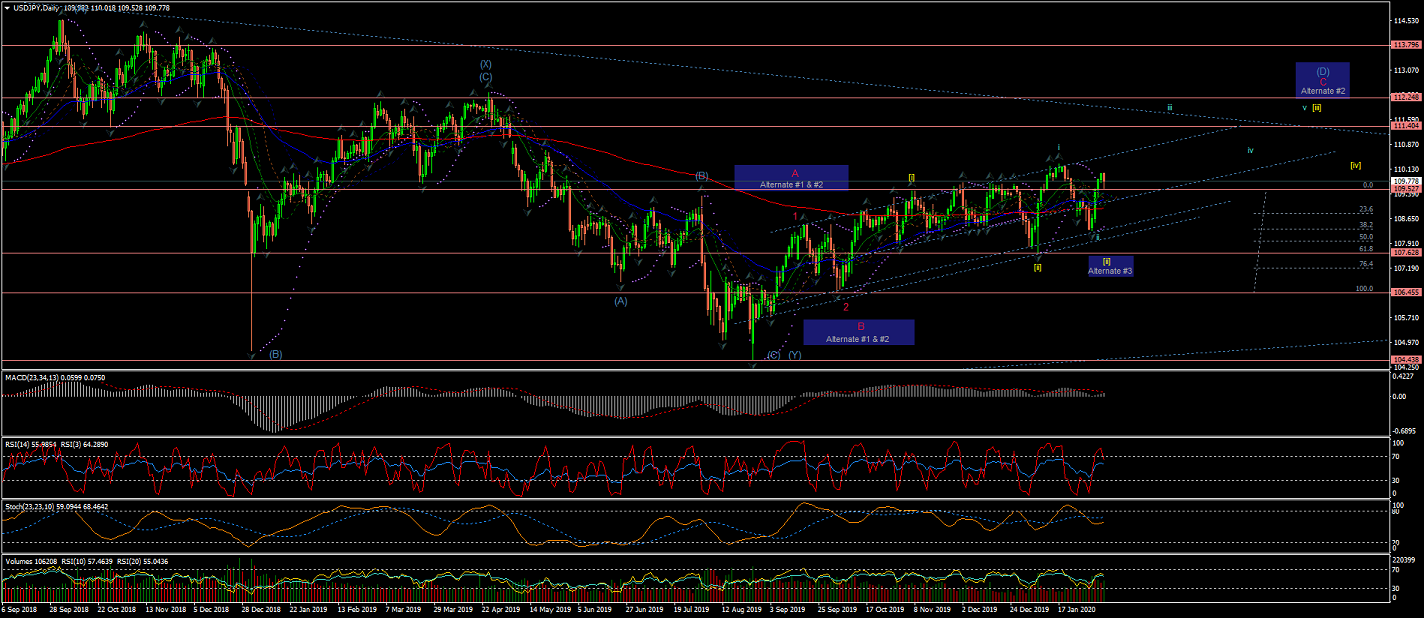
Daily Chart is showing Wave iii of Wave [iii] showing impulsive moves towards the upper trendline after bouncing off the lower trendline.
Although there is now the possibility of an Expanded flat correction for Wave [ii] (which would make current rally as Wave i);
marked as Alternate #3.
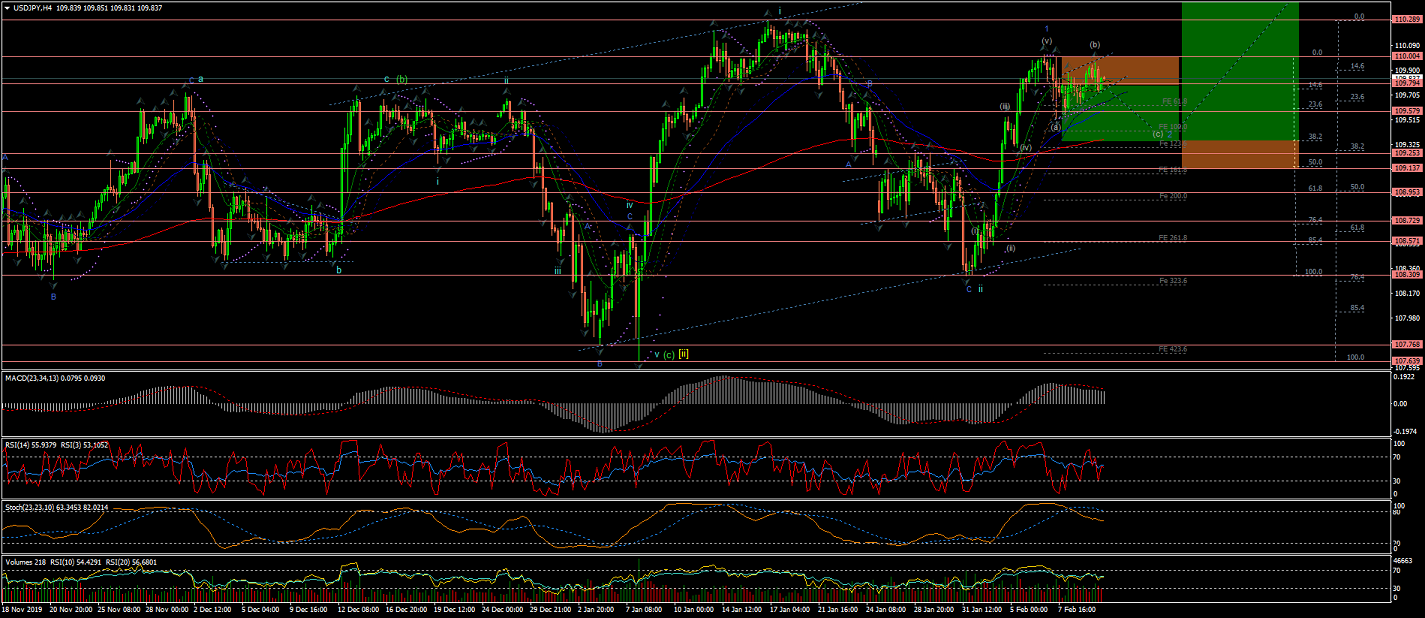
4Hour Chart shows 5 impulsive waves up for Wave 1(blue) of Wave iii.
The price it is now showing signs of what could be Wave (b) of Wave 2(blue) correction.
Trading this correction does not bring the best risk:reward ratio; With a target to hit the %38 retracement at the 200EMA level.
Bearing in mind also that this is a strong bull pair at the moment and the correction might be small (i.e. %23 or %38)
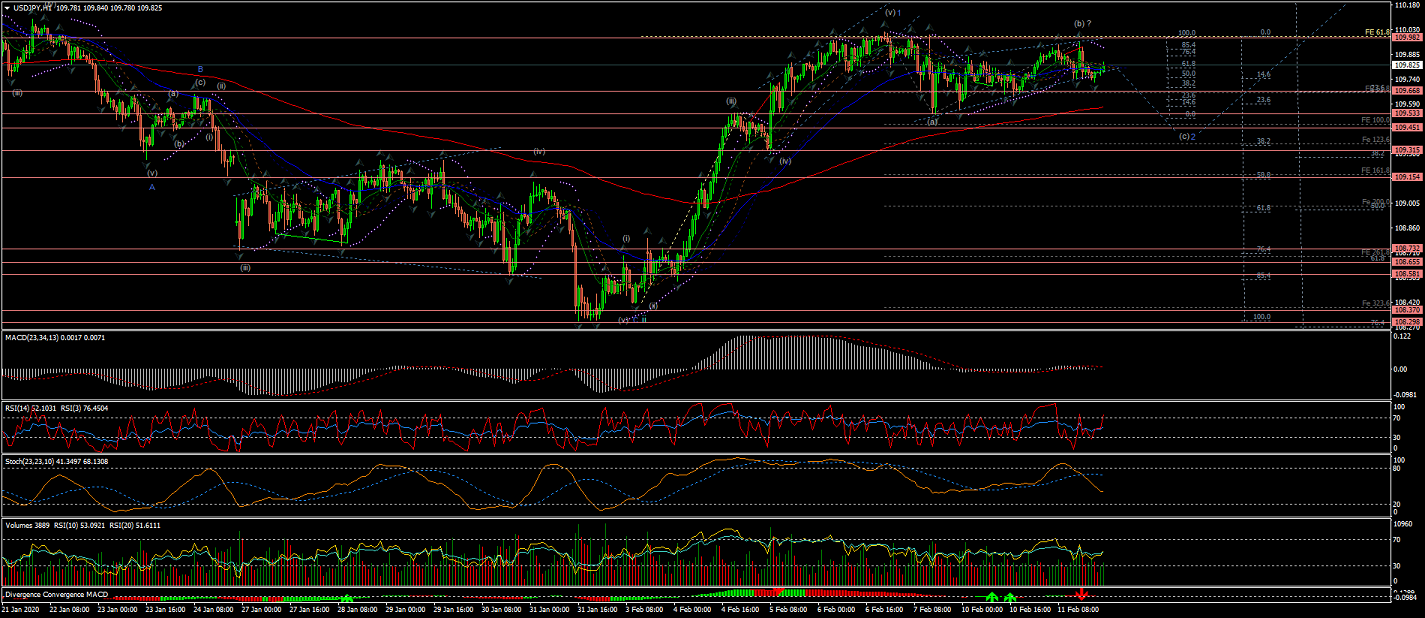
60Min Chart shows in more detail the 5 waves up. And a leading diagonal Wave (v) completed.
Now, in Wave 2(blue) correction, there is a raising wedge formation that suggest Wave (b), and
A breakout to the lower side would suggest Wave (c) of Wave 2(blue) to see
the end of this correction towards the 200EMA or previous Wave 4(blue) price level;
That would be around the %38 retracement of Wave 1(blue) and 0 to 3 Fibo Estension of Wave (a) (of Wave 2(blue)).
EURUSD
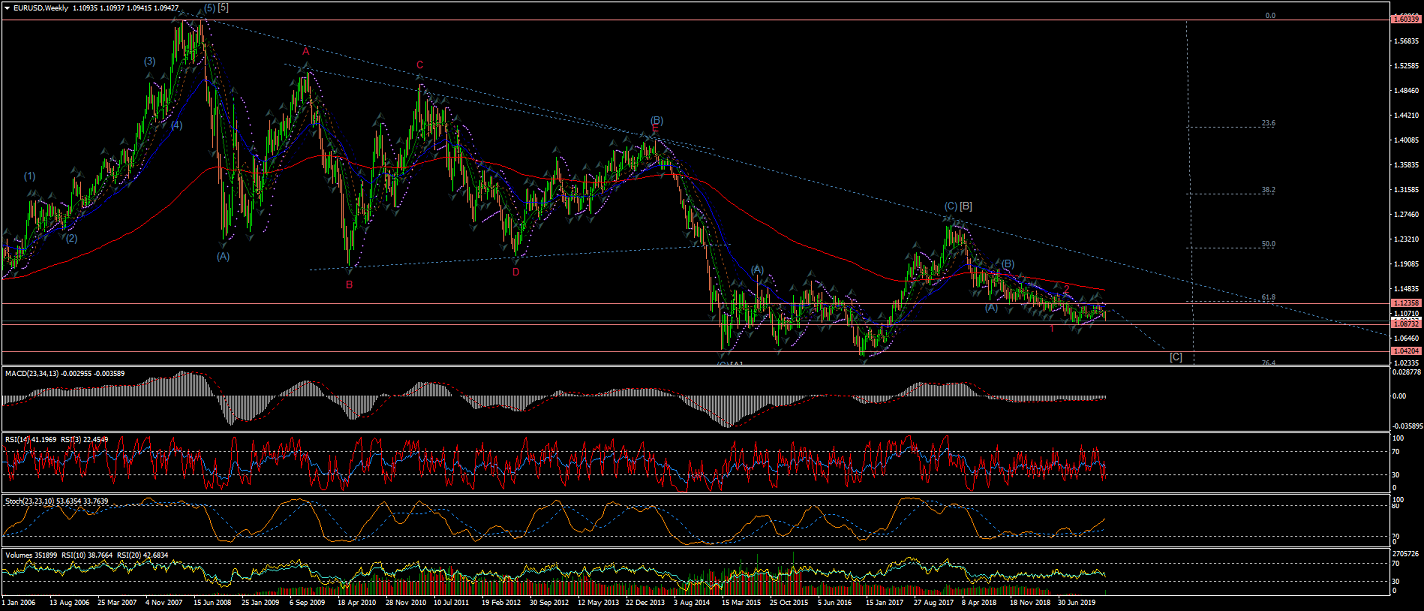
Weekly Chart, under the current interpretation, shows a Wave [C] developing towards
the %76 retracement of the 5-Waves raise from 2002 to 2008.
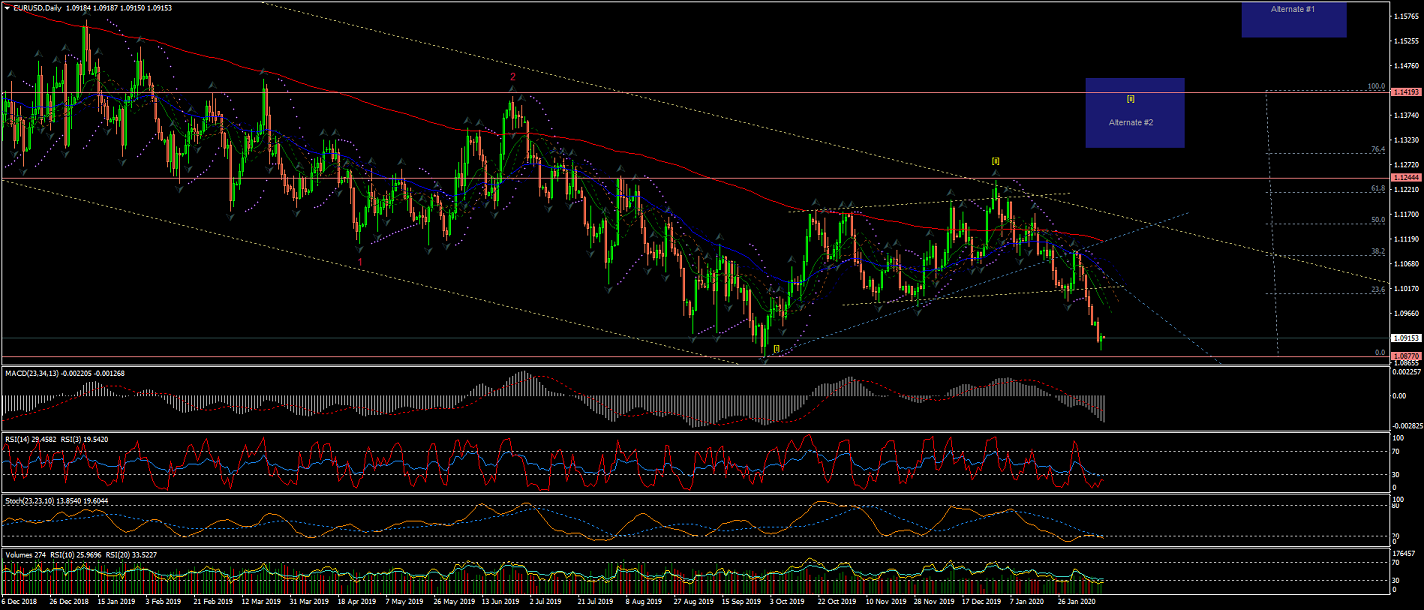
Daily Chart is showing Wave [iii] taking a series of impulsive waves towards the next area of support
at 1.08770 to finally find a bottom.
Although there is still a possibility for Alternate #1 for larger Wave 1 and 2 (red).
And Alternate #2 for an extended Wave [ii] to test the upper trendline again.
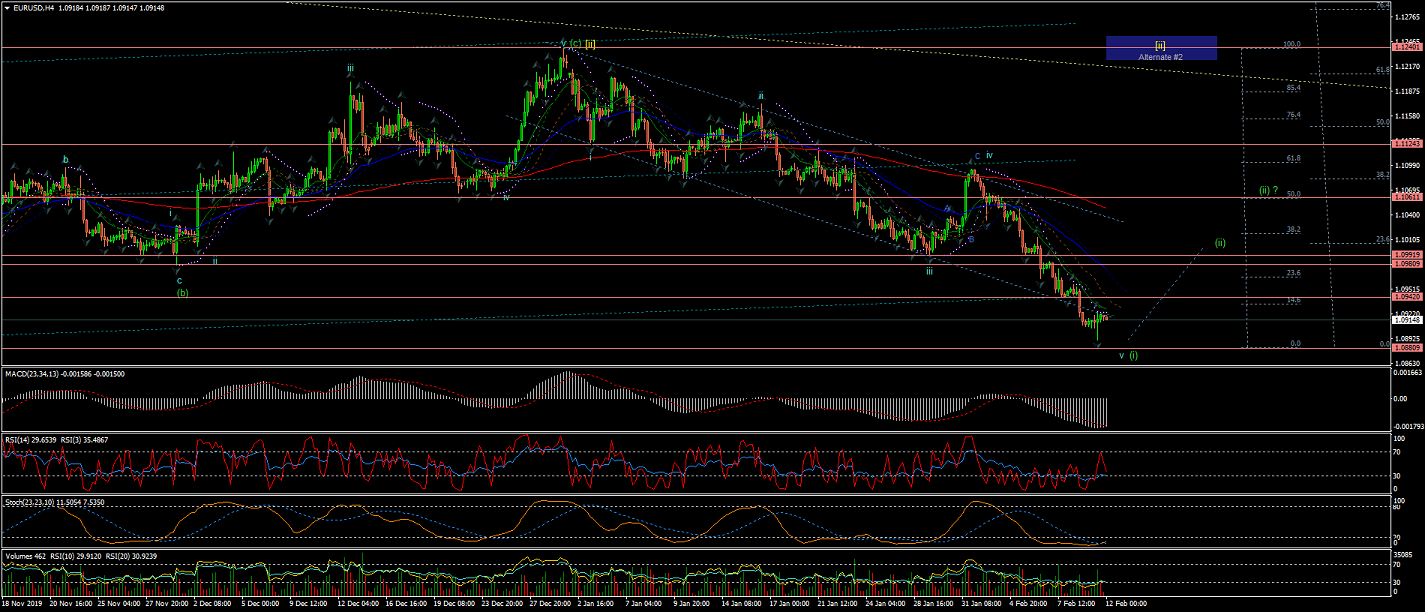
4Hour Chart is showing Wave v of Wave (i) been extended pass the lower trendline towards the next big level of support at 1.08809
So, once Wave (i) finally finds a bottom Wave (ii) retracement should raise the price in a corrective way towards
the upper trendline, 200EMA and other areas of resistance
(i.e. Fibo retracement levels at %38 or perhaps %50/%62).
(Note there is a strong bearish sentiment and, after Wave (ii) correction, there is a Wave (iii) that is most probable to carry an even
more bearish set of impulsive waves).
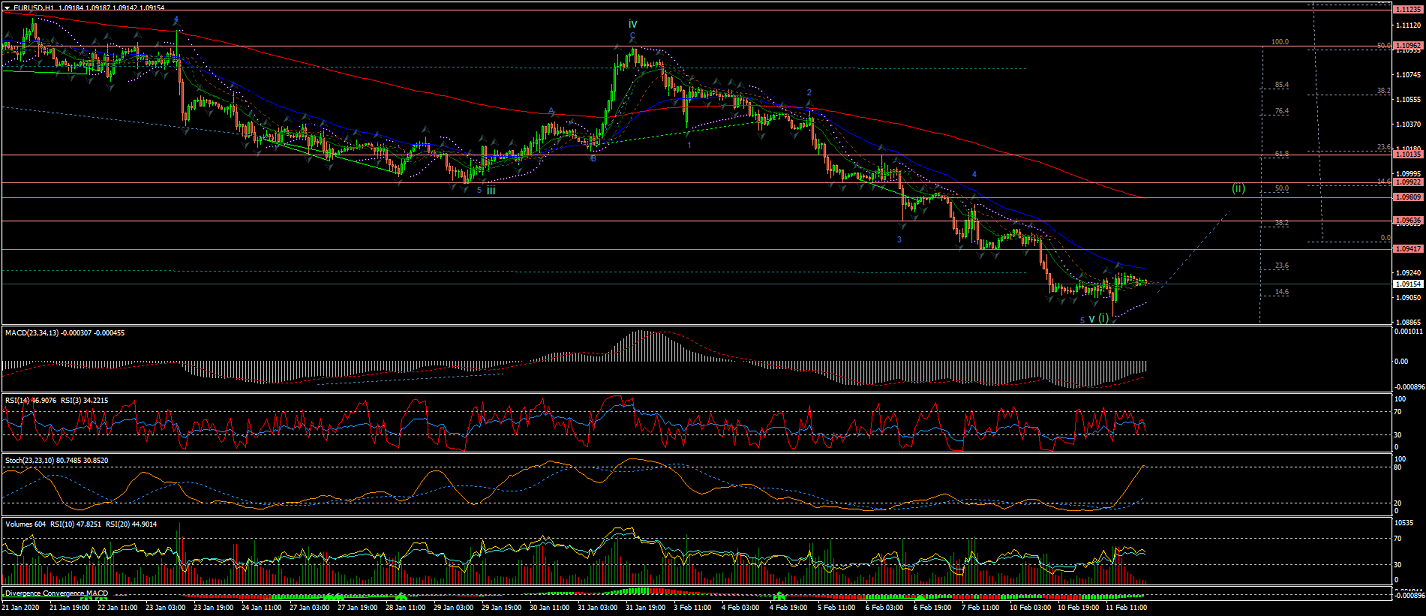
60Min Chart is showing the internal Waves of Wave v still yet to confirm its completion...
although there is already signs of bull exhaustion and what could be the initial start of Wave (ii) correction.
GBPUSD
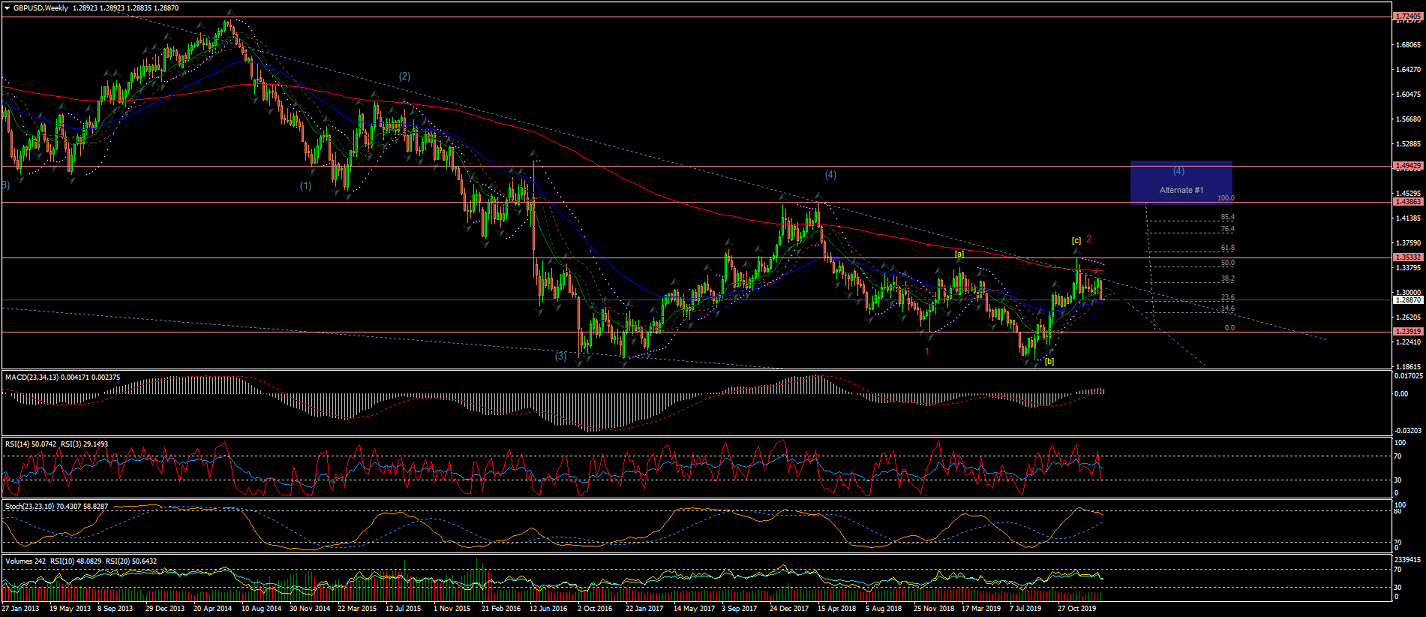
Weekly chart shows Wave 1(red) and a Wave 2(red) correction completed at the 200EMA level with a retracement between %50 and %62 level.
Note Alternate #1 for a larger Wave (4) developing.
Daily Chart is showing the initials Wave (i) and Wave (ii) of Wave [i] (of Wave 3(red)) most likely completed.
And now Wave (iii) under development.
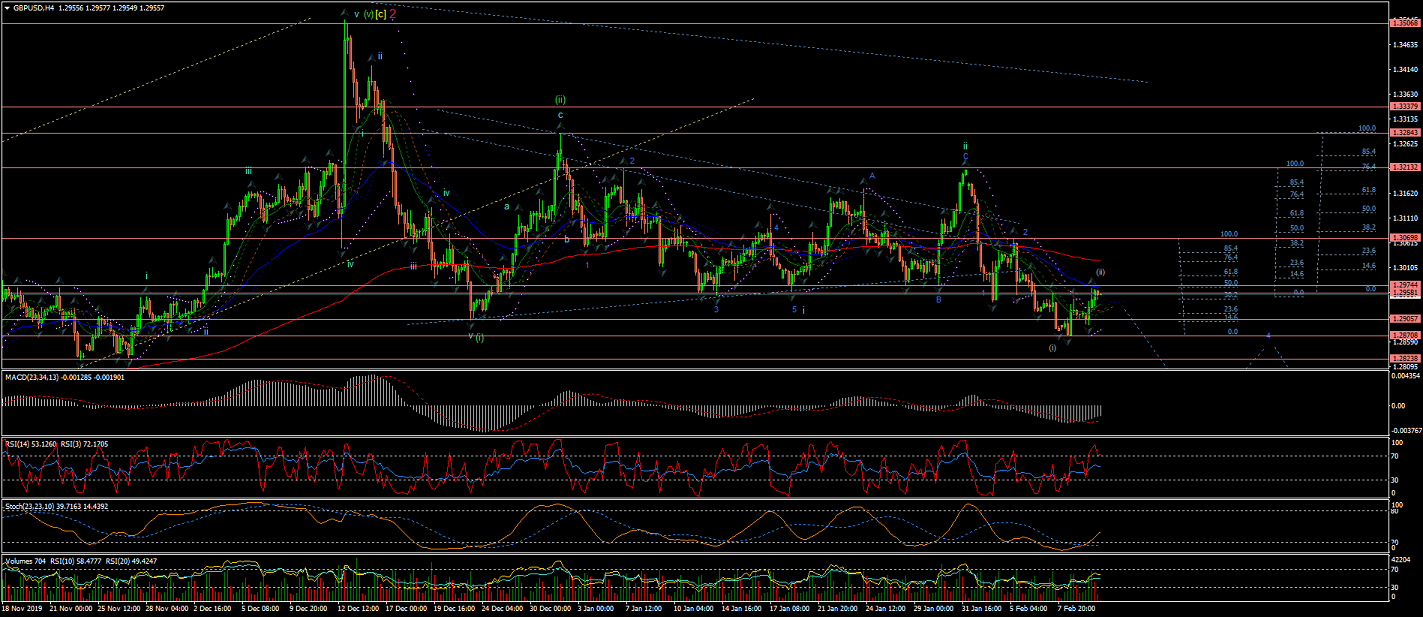
4Hour Chart shows the current count now stands for a completed Wave ii of Wave (iii)
and Waves 1(blue) and Wave 2(blue) of Wave iii completed already.
Now Wave 3(blue) is going across the levels of support with a correction to what could be its internal Wave (ii).
Bearing in mind a possible target for Wave 3(blue) at the next big level of support @ 1.28238.
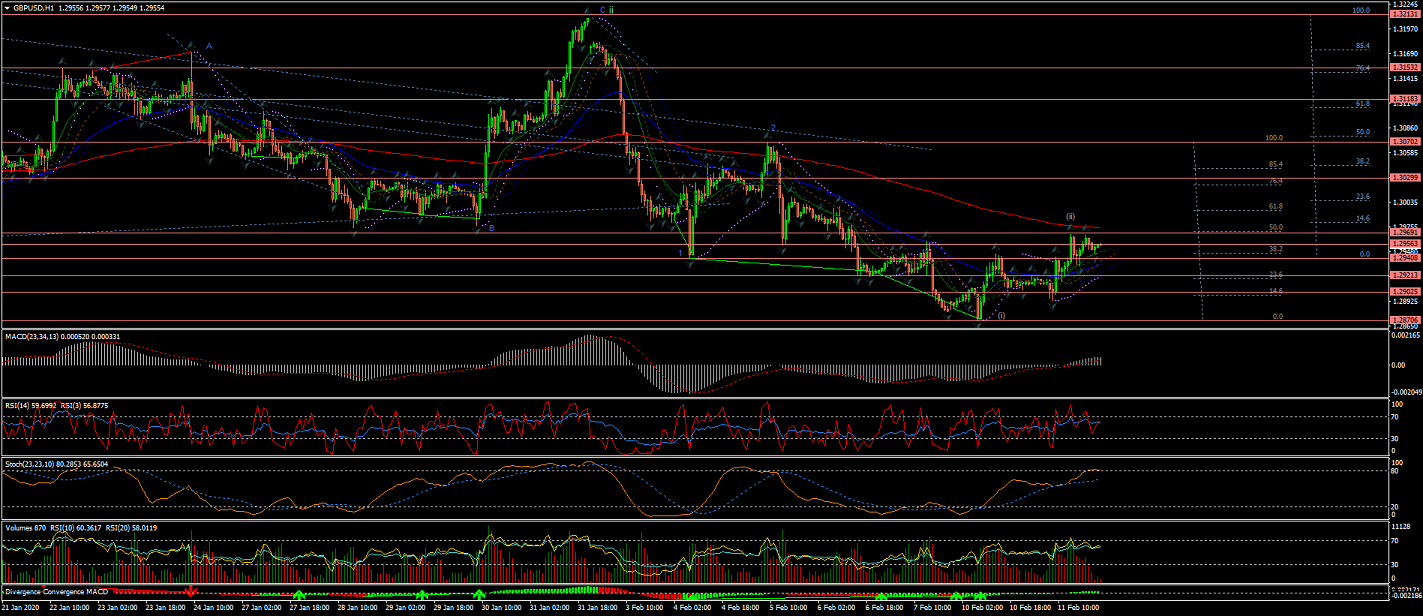
60Min Chart shows Wave 3(blue) of Wave iii is continuing bringing the price down.
With its internal Wave (i) completed and now developing a corrective Wave (ii) correction.
All the best for everyone and please do not hesitate to contact me if you have any questions or comments.
Andres
info@tradingwaves.org

 Trading Waves .org