Fri 31-01-2020
Hi everyone, hope you are all ok.
Let's get into it...
USDJPY
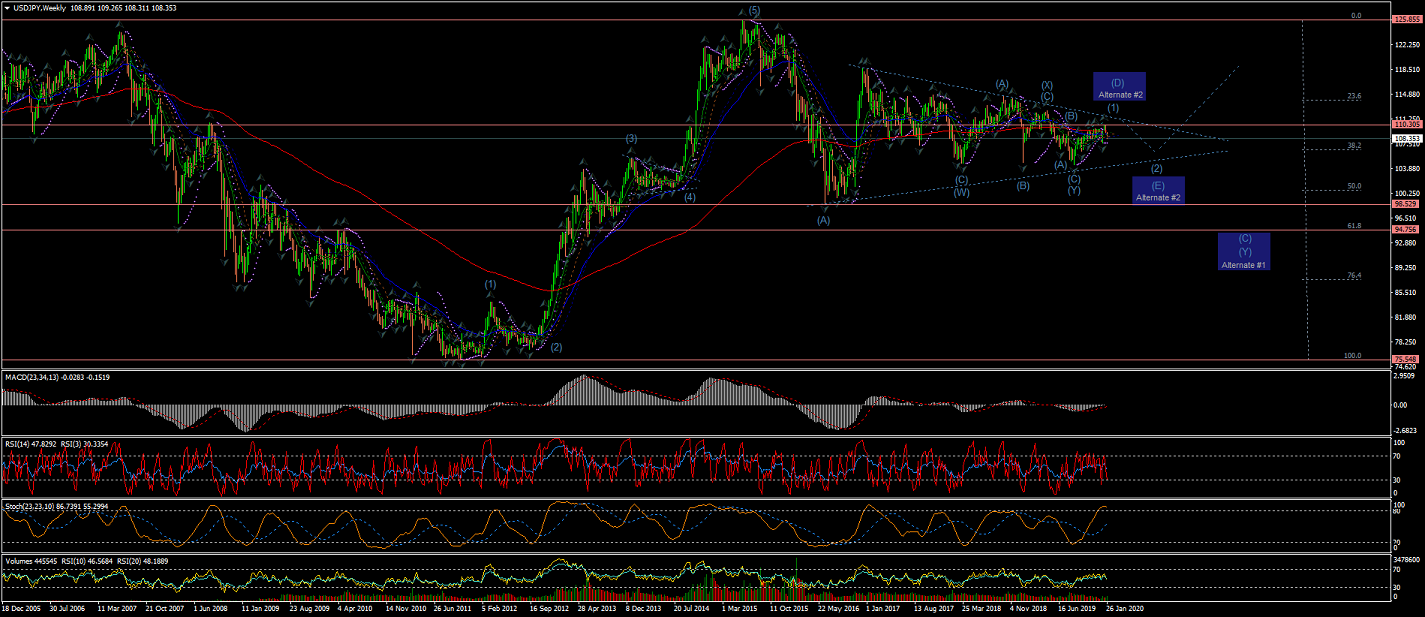
Weekly Chart is showing the price hitting the 200EMA and dropping after almost reaching the long term upper trend line for Wave (1);
* Bearing in mind the Alternate#1 count for an extended Wave (C) of Wave (Y)
* And Alternate #2 for a Wave (D) topping at the upper trend line and then targetting the lower trend for Wave (E).
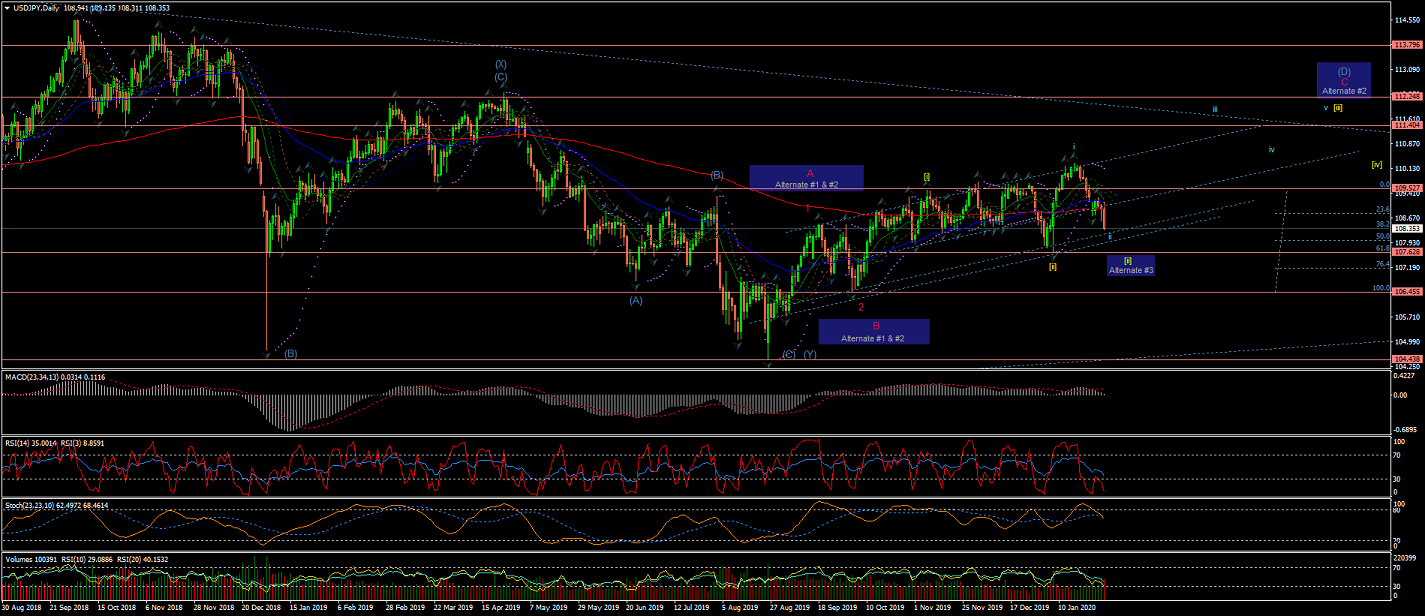
Daily Chart is showing Wave ii of Wave [iii] made a big rally down towards the lower trendline.
Although there is now the posibility of an Expanded flat correction for Wave [ii]; marked as Alternate #3.
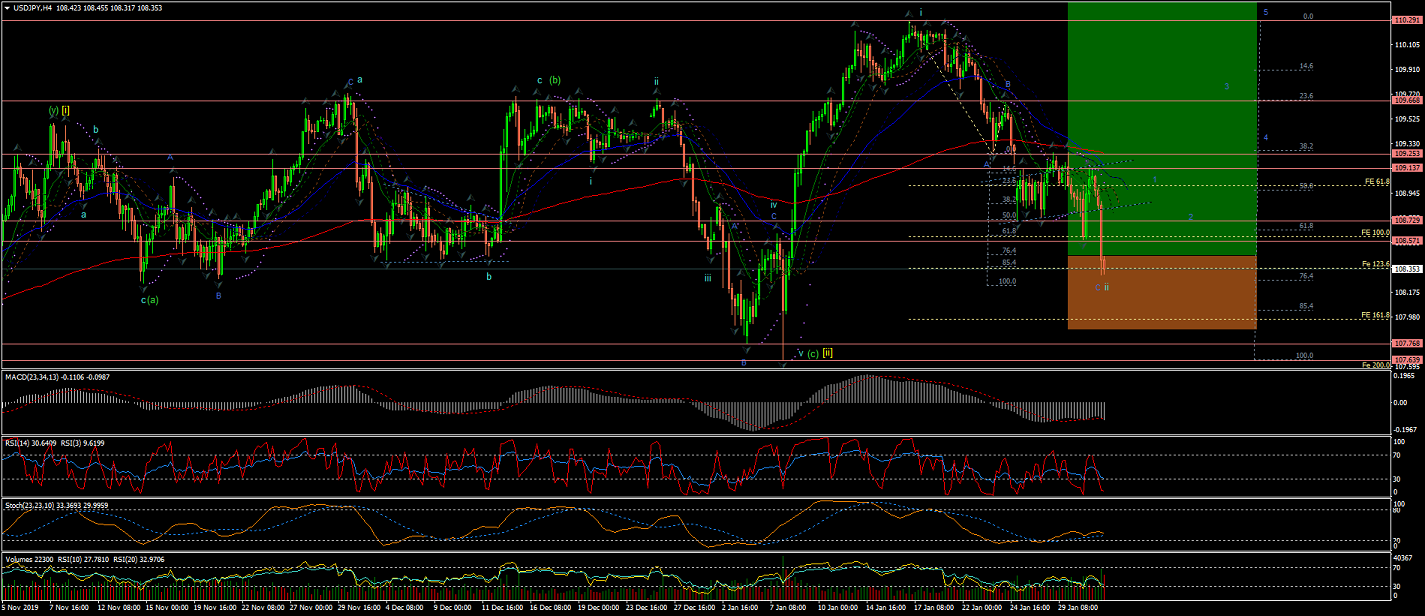
4Hour Chart shows Wave C of Wave ii completed at almost %76 retracement of Wave i (although not confirm yet);
Which is about %85 of Wave A... 0 of Wave A would be at the %76 retracement of Wave i
And the price is now stalled at 3.6 Fibo Extension of Wave A from Wave B
This setup left a nice oportunity for going long at the possible start of Wave iii,
with a good risk:reward ratio, as per current count.
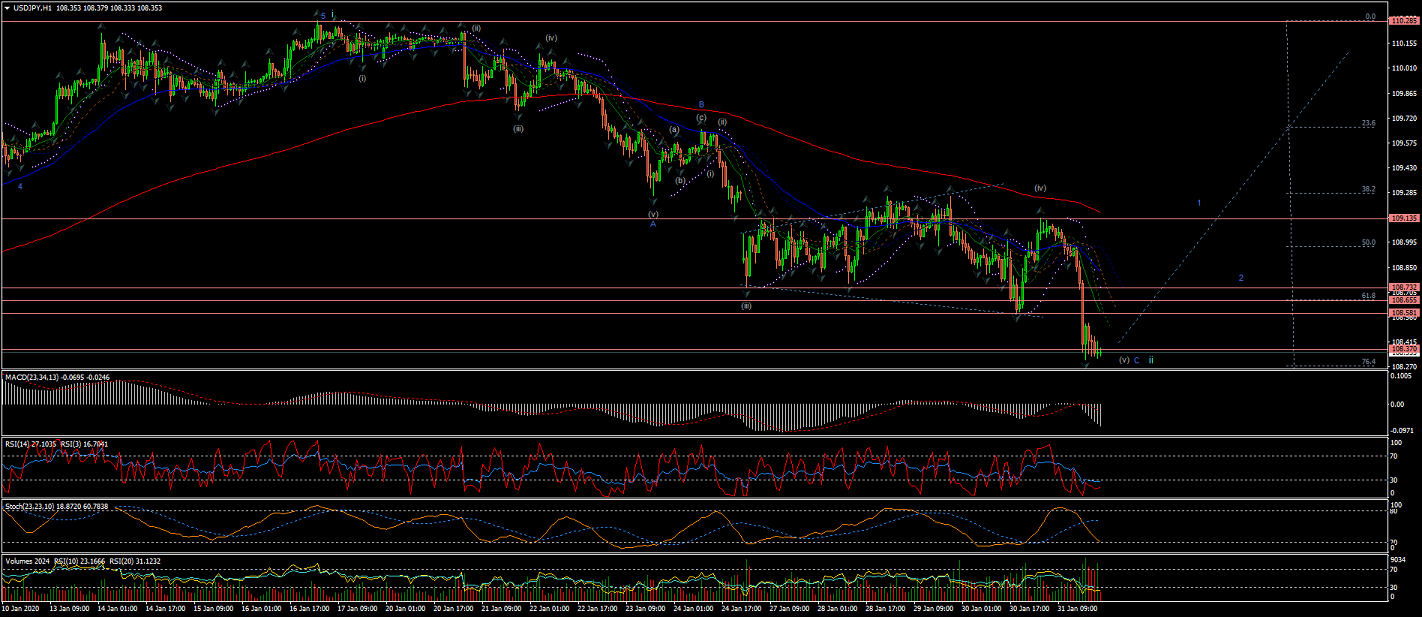
60Min Chart shows in more detail the internal waves of Wave ii coming to a completion at nearly %76 retracement.
As marked earlier in the week with the Short-Term Alternate count.
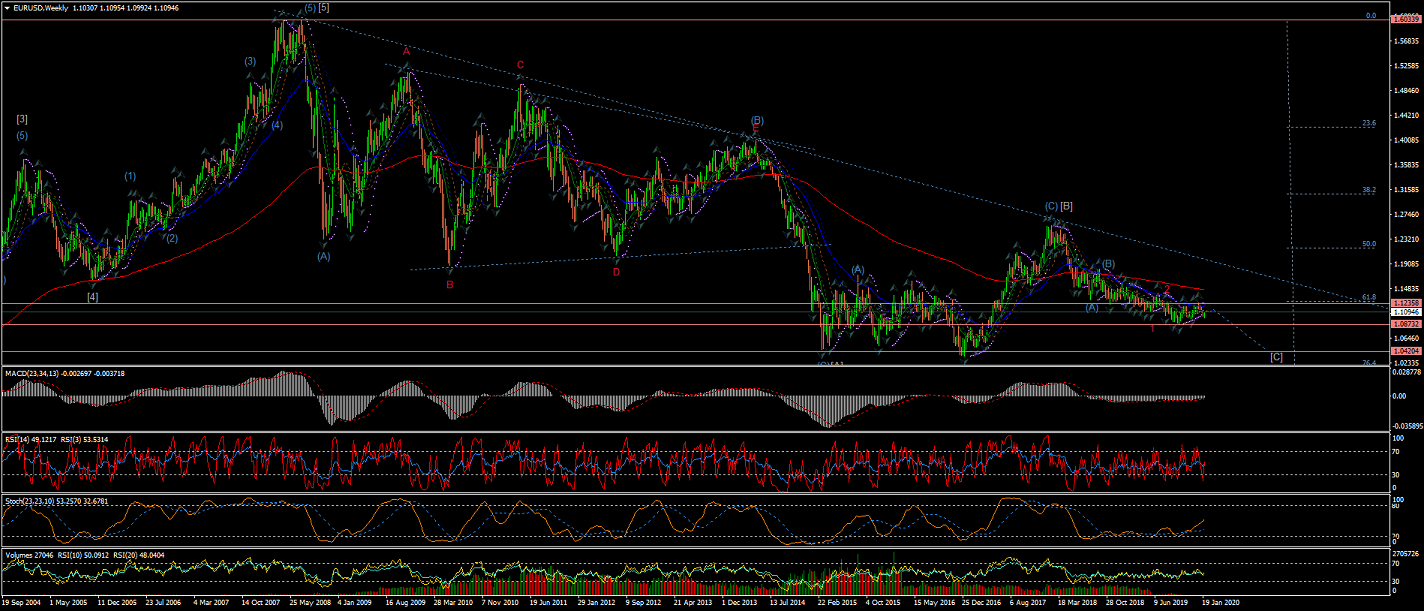
EURUSD
Weekly Chart, under the current interpretation, shows a Wave [C] developing towards the %76 retracement of the 5-Waves raise from 2002 to 2008.
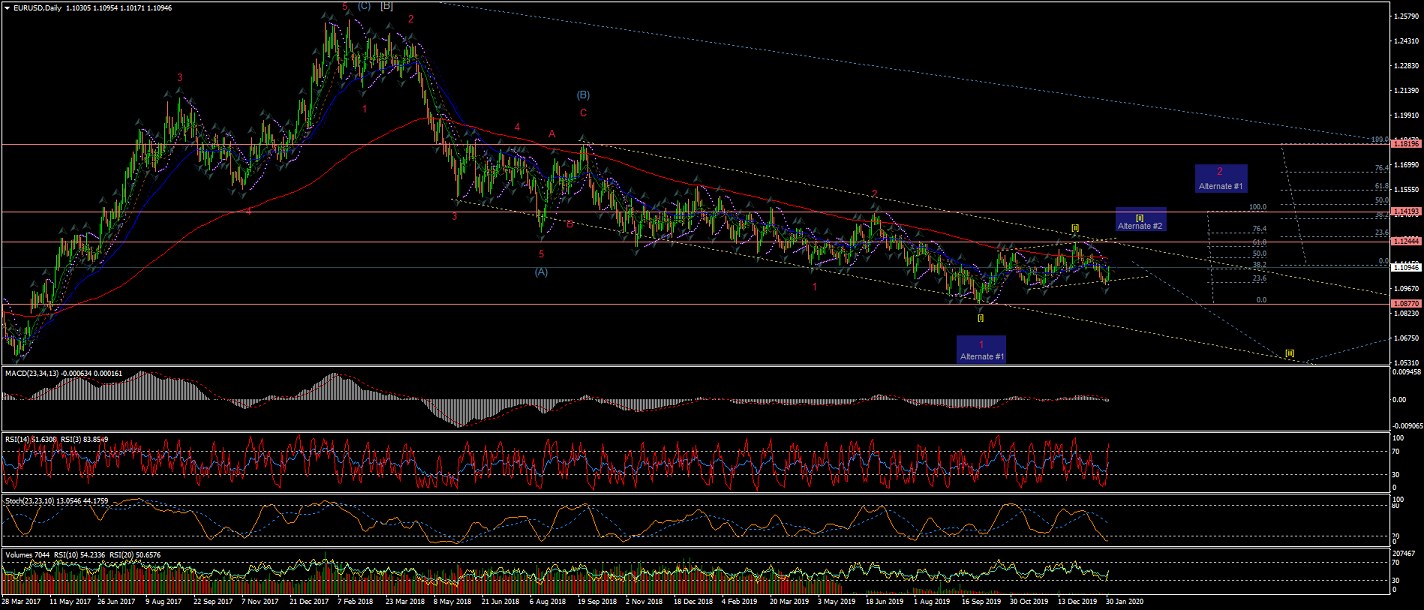
Daily Chart is showing Wave [ii] so far reached just above the %62 retracement.
This remains the best interpretation as the price has been rejected convincingly at the upper trendline and now aiming towards the lower one.
Although I have marked Alternate #1 for largers Wave 1 and 2 (red).
And Alternate #2 for an extended Wave [ii] to test the upper trendline again.
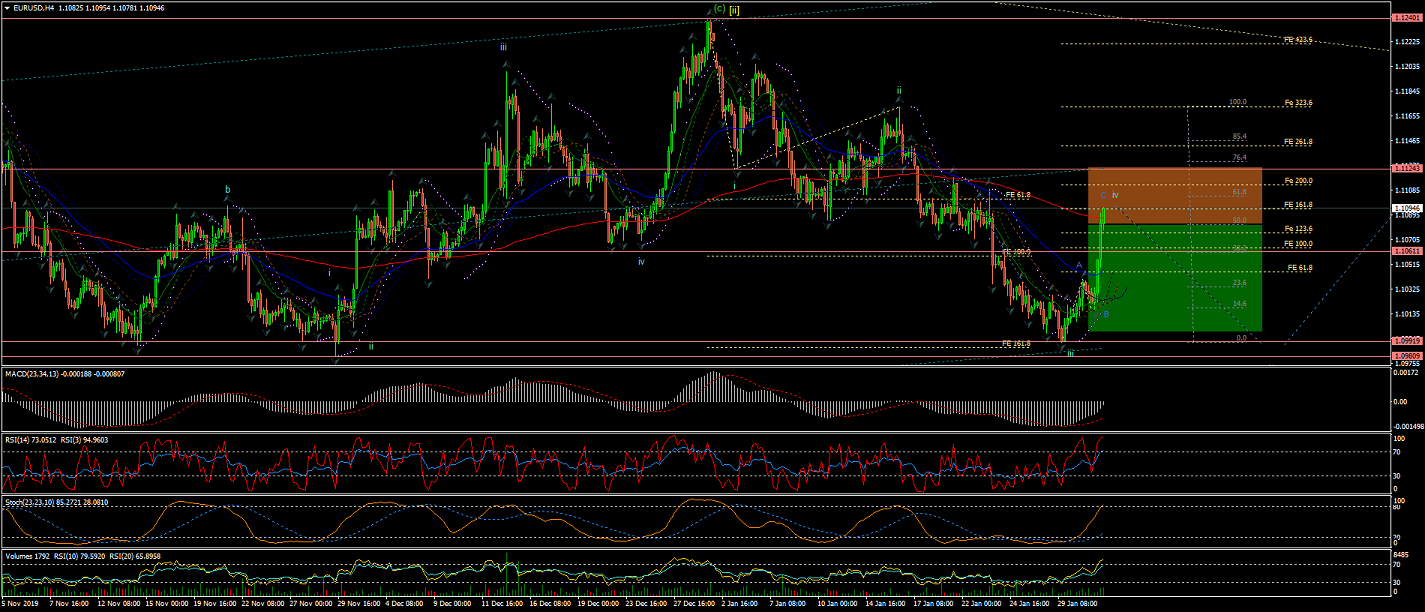
4Hour Chart is showing Wave iv reaced between %50 and %62 of Wave iii.
And Wave C (of Wave iv) has now reached 1.8 Fibo Extension of Wave A (of Wave iv).
This setup offers an opportunity to take on Wave v next,
as the price should not go over the territory of Wave i.
60Min Chart is showing the internal Waves of Wave iv developing; to what appears to be a ZigZag correction.
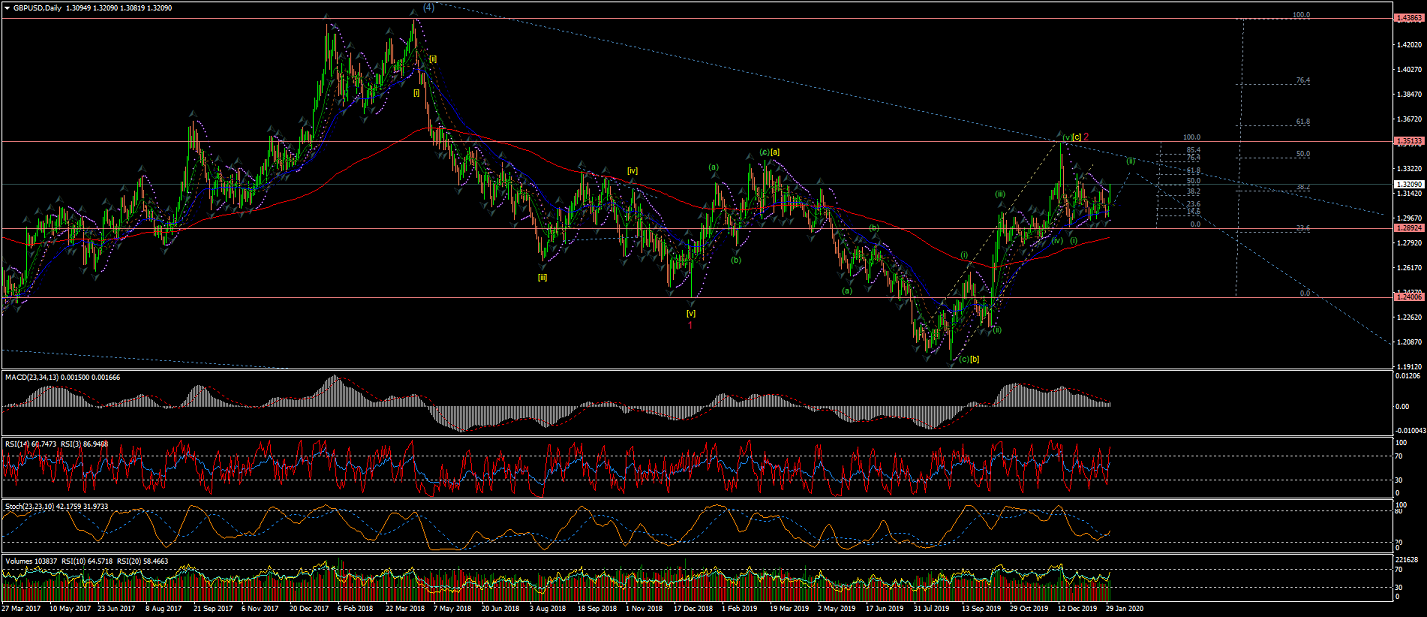
GBPUSD
Weekly chart shows Wave 1(red) and a Wave 2(red) correction completed at the 200EMA level with a retracement between %50 and %62 level.
Note Alternate #1 for a larger Wave (4) developing.
Daily Chart is showing the internal wave counts of Wave 2(red) most likely completed at this point,
as the first impulsive Wave (i) of Wave 3(red) has developed and now Wave (ii) correction is under development.
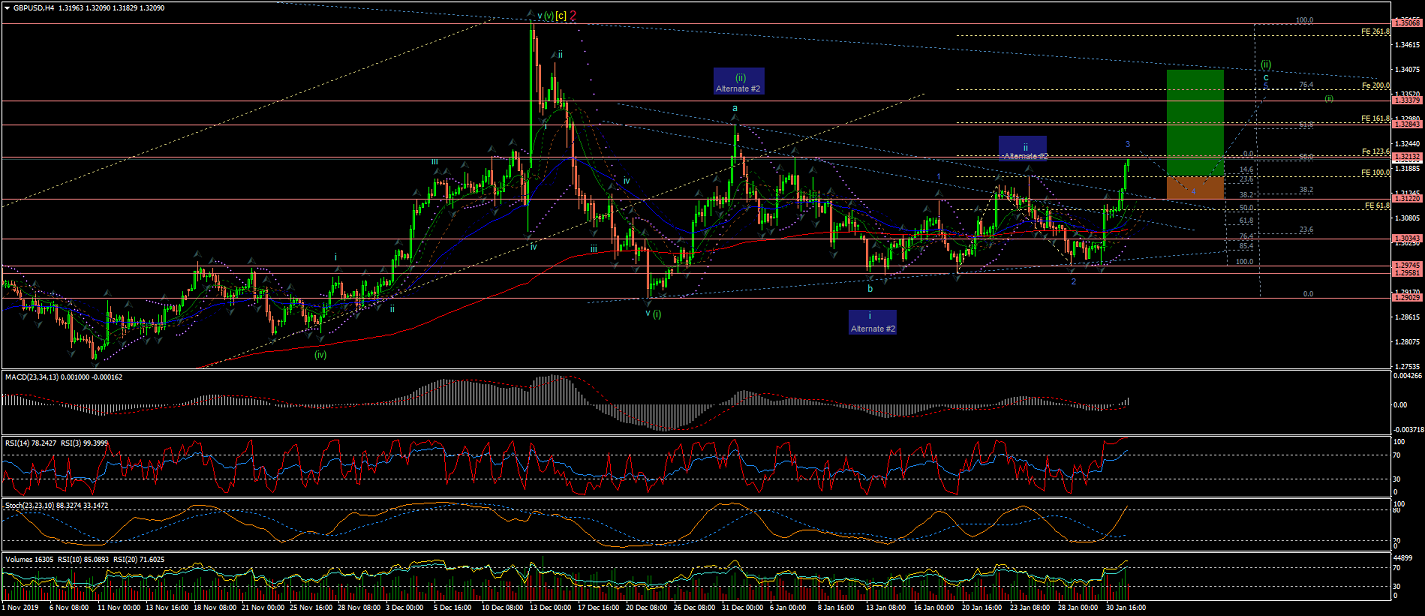
4Hour Chart shows a possible extended Wave (ii) ZigZag correction still underway;
With Wave c going through its internal Wave 3(blue), with a breakout of the triangule which should see a retracement for Wave 4(blue) next.
(A pullback of this breakout for Wave (iv) could offer a low-risk entry)
I have marked Alternate #2 as a count for an already completed Wave (ii);
Which would mean that the current correction would be Wave ii of Wave (iii) instead.
(Although this Alternate can be discarded if the breakout continues pass through the highest of previous Wave a).
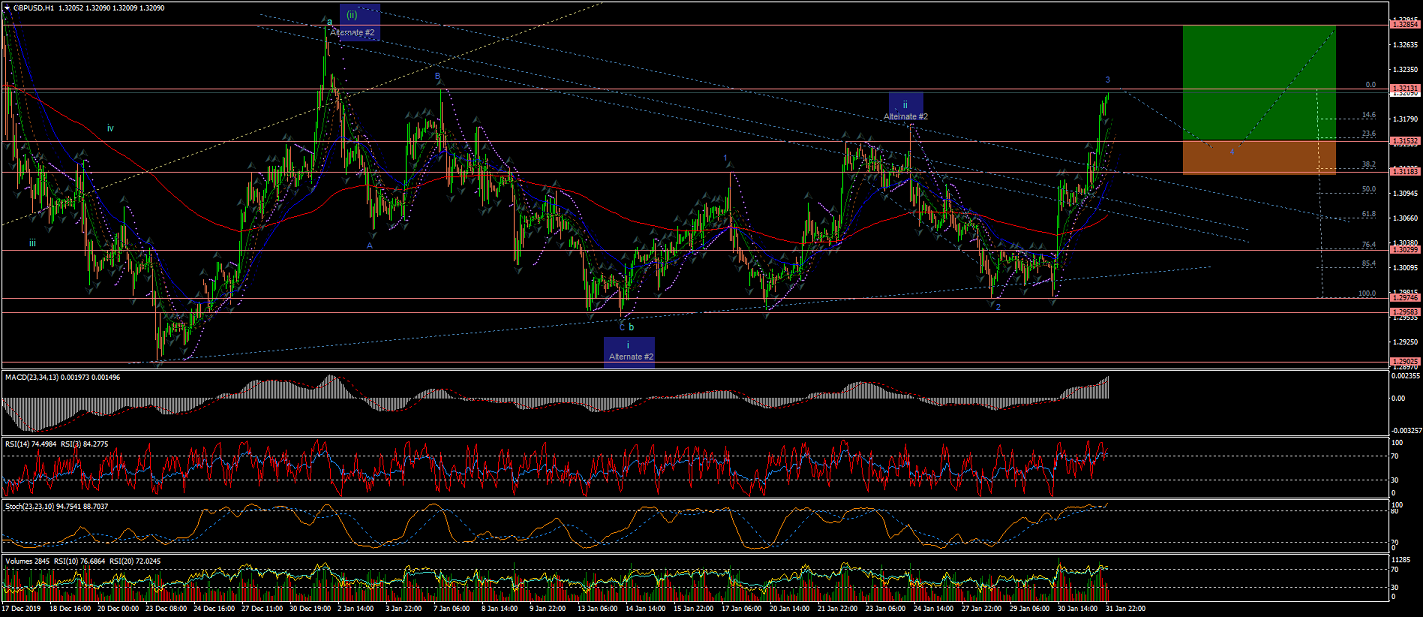
60Min Chart shows the current count for Wave 3(blue) of Wave c of Wave (ii) possibly completed after the breakout.
Wave 4(blue) should retrace towards the triangule apex in a corrective manner.
The target for Wave 4(blue) should be %23 to %38 max (retracement of Wave 3(blue))
as crossing the highest of Wave 1 (at 1.31183) would invalidate this count.
All the best for everyone and please do not hesitate to contact me if you have any questions or comments.
Andres
info@tradingwaves.org


 Trading Waves .org