Mon 27-01-2020
Hi everyone, hope you are all ok.
Hope you are ok with the new look of the Charts as I moved on to MetaTrader.
Although I have tried to make it look as similar as possible to previous look at NinjaTrader.
Let's get into it...
USDJPY
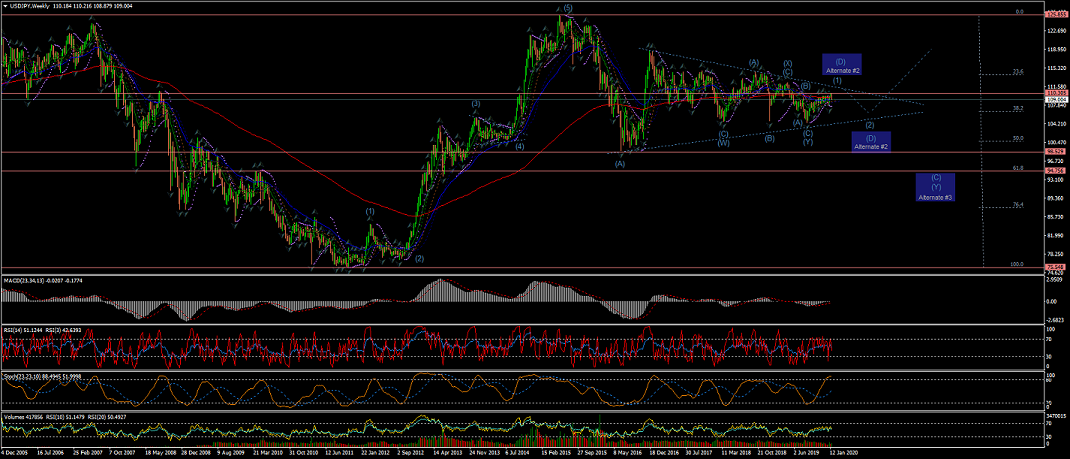
Weekly Chart is still showing the price hitting the 200EMA and almost reaching the long term upper trend line for Wave (1);
* Bearing in mind the Alternate#1 count for an extended Wave (C) of Wave (Y)
* And Alternate #2 for a Wave (D) topping at the upper trend line.
Daily Chart is showing Wave [ii] made a big rally down towards lower retracements possibly completed at exactly %62 rewtracement of Wave [i].
Which I believe the best interpretation is for an expanded flat correction.
4Hour Chart shows the internal waves of Wave ii correction coming to a completion;
With Wave C (blue) of Wave ii now stack at the %62 retracement after a gap down.
There are other series of support towards the %76 level, if it were to drop lower.
And any moves lower than the 0 retracement would invalidate the current count.
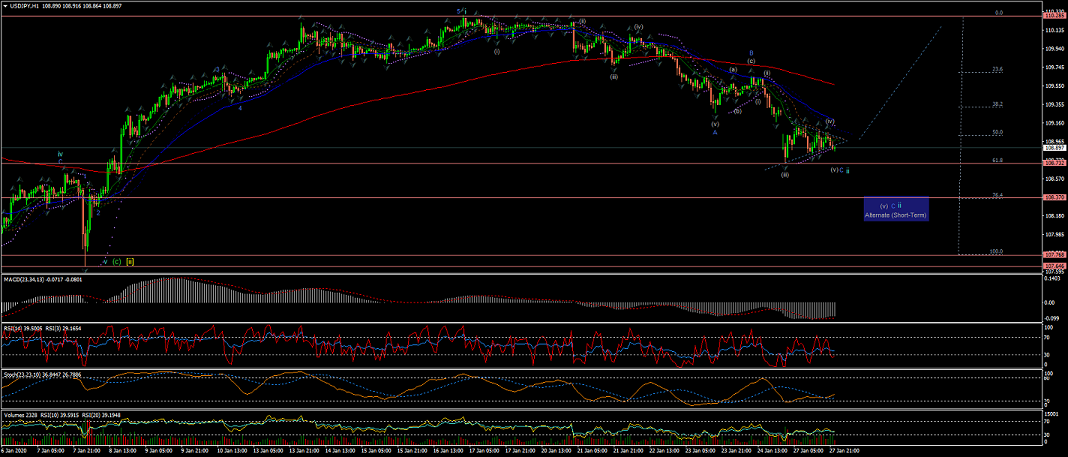
60Min Chart shows in more detail the internal waves of Wave ii coming to a completion.
With the 5 internal waves of Wave C of Wave ii almost matching the length of Wave A if its completion ends at the %62 retracement.
But further moves down would suggest to finish at the next level of Fib retracement (%76).
And now we should wait for a confirmation move up to confirm the start of Wave iii up and completion of this correction, if this interpretation count is correct.
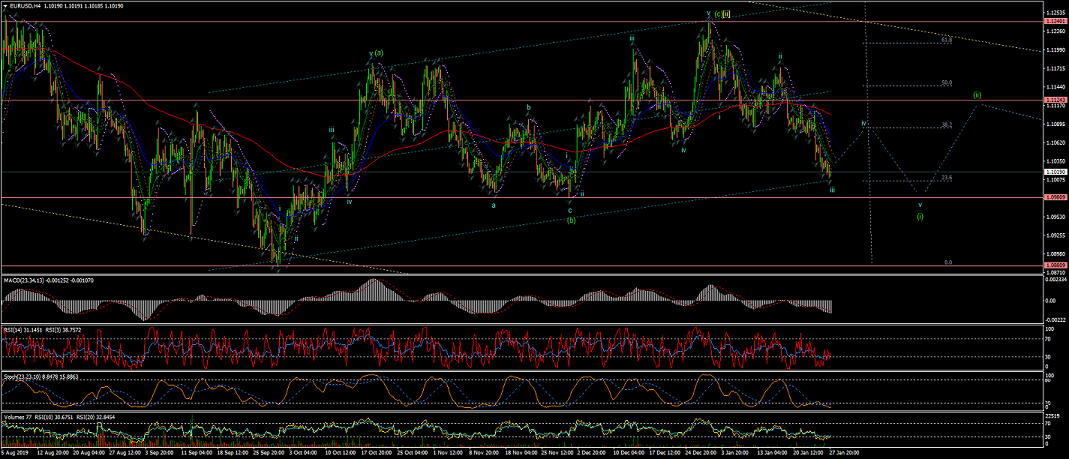
EURUSD
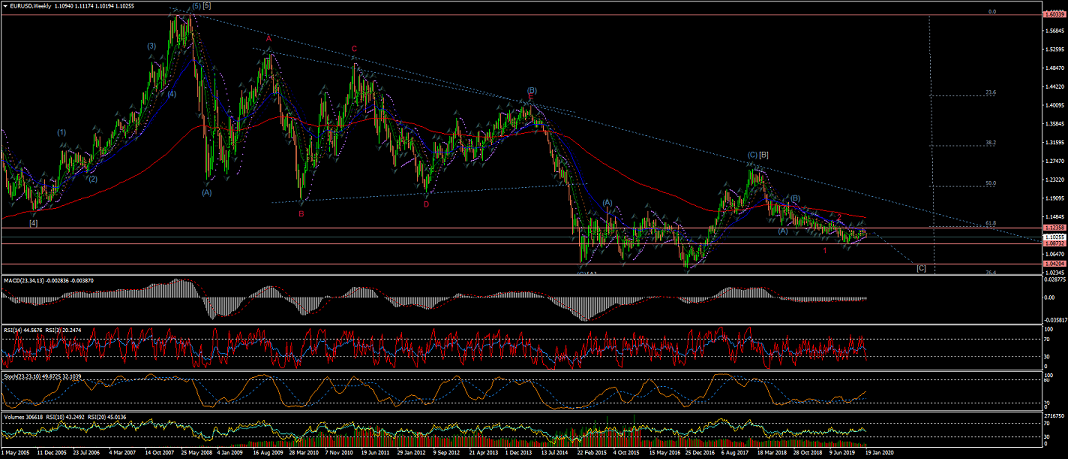
Weekly Chart under the current interpretation, shows a Wave [C] developing towards the %76 retracement of the 5-Waves raise from 2002 to 2008.
Alternate #1 shows a wave count for extended Waves (A) and (B).
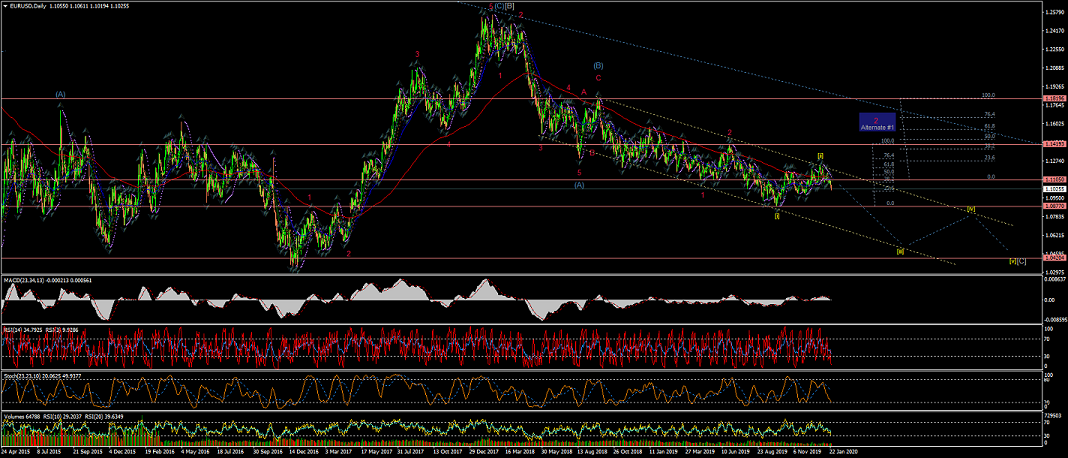
Daily Chart is showing Wave [ii] so far reached just above the %62 retracement.
This remains the best interpretation as the price has been rejected convincingly at the 200EMA.
4Hour Chart is showing that the current count now stands for a Wave iii of Wave (i) completed or at nearly completion at the lower trend line.
And a bounce up to continue with Wave iv correction should be next.
(hardly any movement today but there has not been confirmation of Wave iii completed yet)
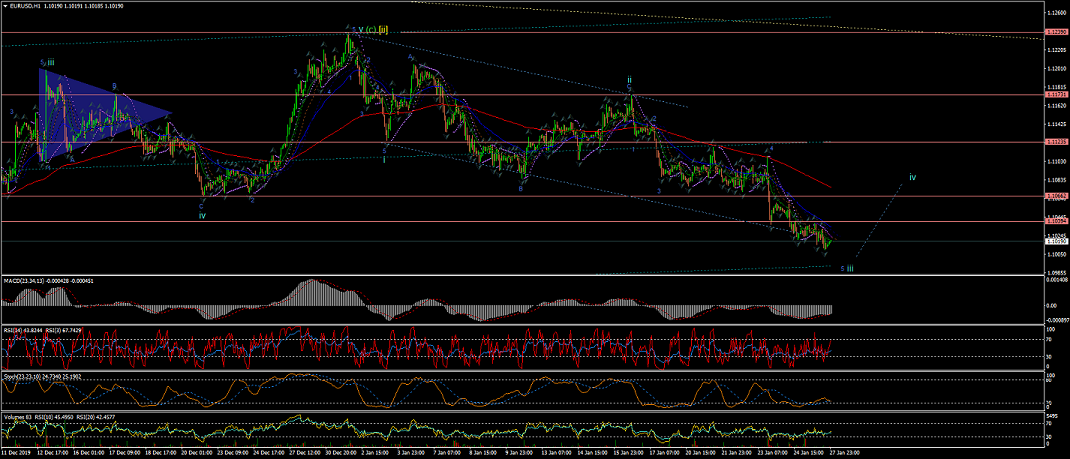
60Min Chart is showing the 5 internal waves of Wave iii that should be completed pretty soon, if not already completed, as mentioned earlier.
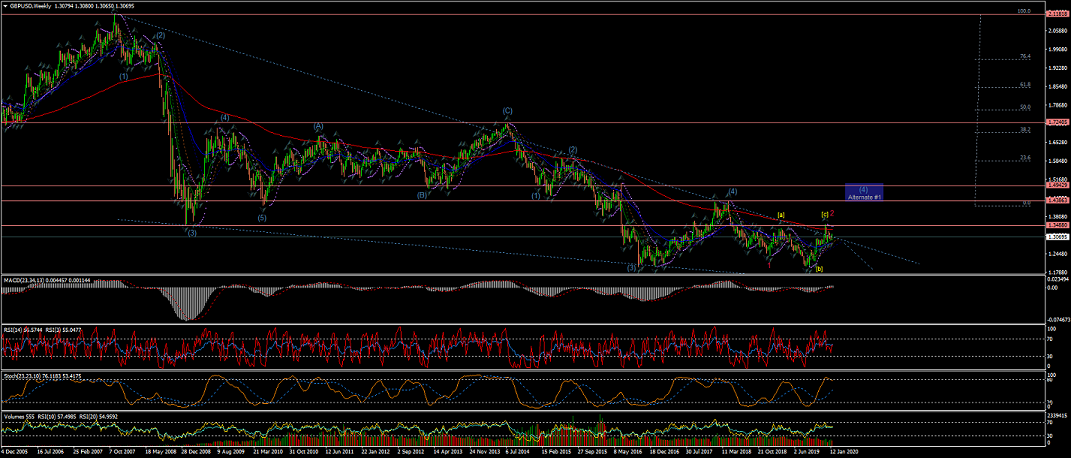
GBPUSD
Weekly chart shows Wave 1(red) and a Wave 2(red) correction completed at the 200EMA level with a retracement between %50 and %62 level.
Note Alternate #1 for a larger Wave (4) developing.
Daily Chart is showing the internal wave counts of Wave 2(red) most likely completed at this point, as the first impulsive Wave (i) of Wave 3(red) has developed and now Wave (ii) correction under development.
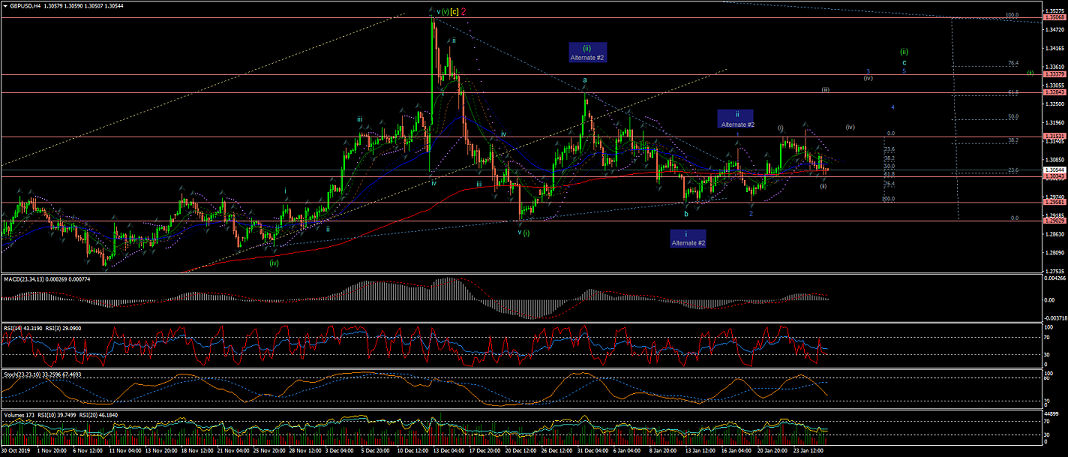
4Hour Chart shows a possible extended Wave (ii) ZigZag correction still underway; With Wave c in its initial stages.
I have marked Alternate #2 as a count for an already completed Wave (ii); Which would mean that the current Wave c correction would be Wave ii of Wave (iii) instead.
60Min Chart shows 5 waves down for Wave 1(blue) - Which I have marked as Wave ii in the Alternate #2 count.
And the current count for Wave 2(blue) which has finished at nearly 0 retracement.
Since, then the price moved higher to what, under the current interpretation, should be Waves (i) and (ii) of Wave 3(blue)
Any move lower from the low of Wave 1(blue) would trigger the Alternate count; suggesting the change of trend to the downside.
All the best for everyone and please do not hesitate to contact me if you have any questions or comments.
Andres
info@tradingwaves.org


 Trading Waves .org