Fri 03-01-2020
Hi everyone, hope you are all ok.
Let's get into it...
USDJPY
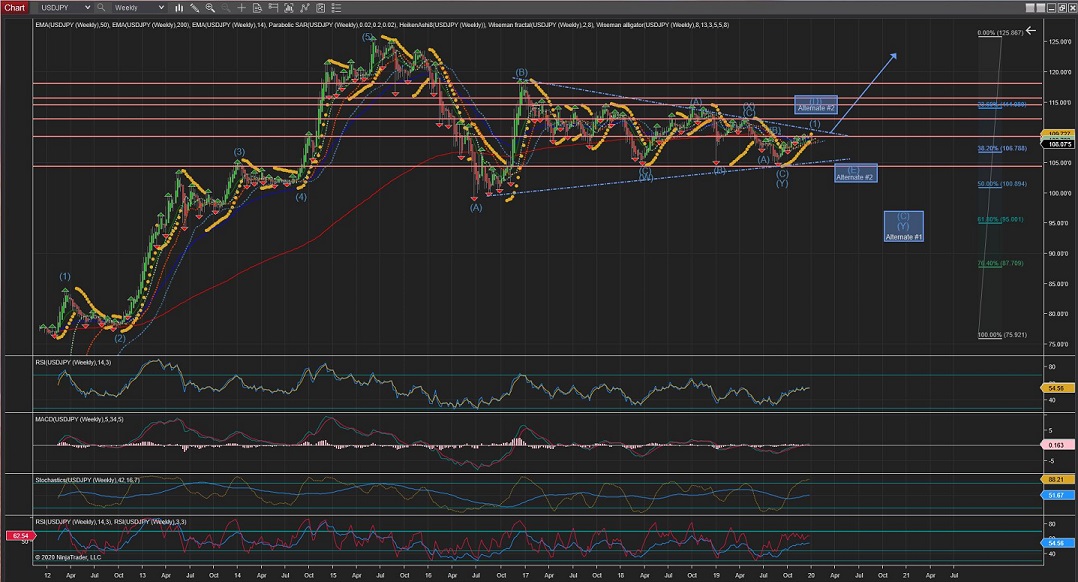
Weekly Chart is still showing the price hitting the 200EMA and almost reaching the long term upper trend line for Wave (1);
* Bearing in mind the Alternate#1 count for an extended Wave (C) of Wave (Y)
* And Alternate #2 for a Wave (D) topping at the upper trend line.
Daily Chart is showing Wave [ii] made a big rally down towards lower retracements.
So, since Wave (b) completed above Wave [i] I believe the best interpretation is for an expanded flat correction to complete Wave (c) below Wave (a); I.e. towards the %62 or %76 retracement level.
4Hour Chart shows the internal waves of Wave (c) of Wave [ii] expanded flat correction under development; with Wave ii now completed with a huge rally down in 5 waves.
(Any moves lower than the 0 retracement would invalidate the current count)
60Min Chart shows an updated count; The internal 5 waves of Wave (c) of Wave [ii] at nearly completion.
EURUSD
Weekly Chart under the current interpretation, shows a Wave [C] developing towards the %76 retracement of the 5-Waves raise from 2002 to 2008.
Alternate #1 shows a wave count for extended Waves (A) and (B).
Daily Chart is showing Wave [ii] so far reached just above the %62 retracement.
This remains the best interpretation as in the last session the price has been rejected convincingly at the 200EMA.
4Hour Chart is showing that the current count now stands for a Wave [ii] Zig Zag correction completed at just above the %62 retracement level.
Since then, there has been an impulsive drop to what could be the start of Wave [iii] with its initial Wave i.
60Min Chart is showing the internal waves of the initial Wave 1 and the first wave of the just started Wave 2.
GBPUSD
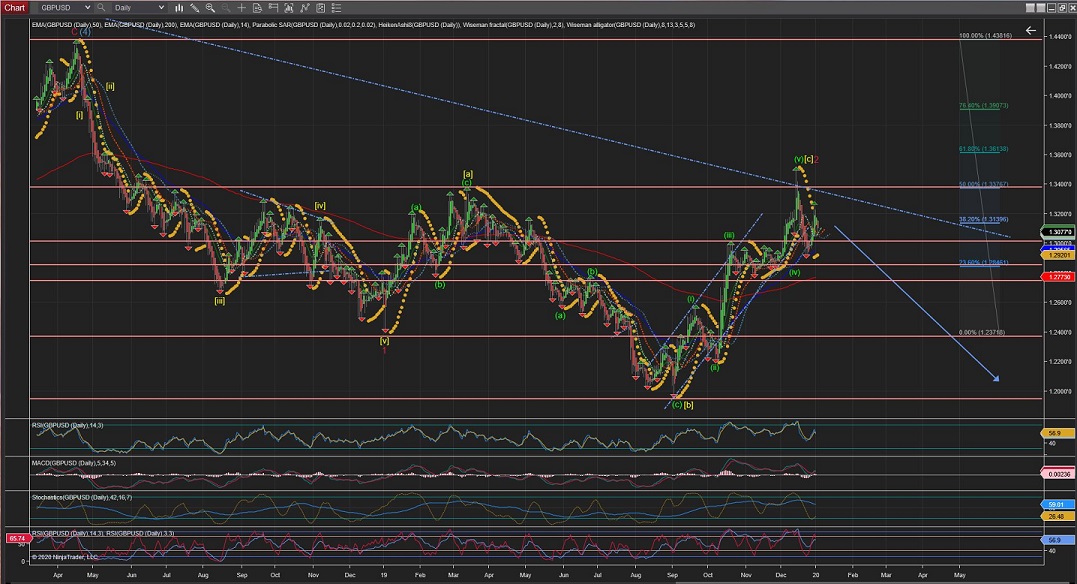
Weekly chart shows a new updated count following Friday's rally triggering a different count for a larger Wave 1(red) and a Wave 2(red) completed at the 200EMA level and retracement between %50 and %62 level.
Note Alternate #2 for a larger Wave (4) developing.
Daily Chart is showing the internal wave counts of Wave 1(red) and Wave 2(red) most likely completed at this point, as the first impulsive waves to the downside are starting to show.
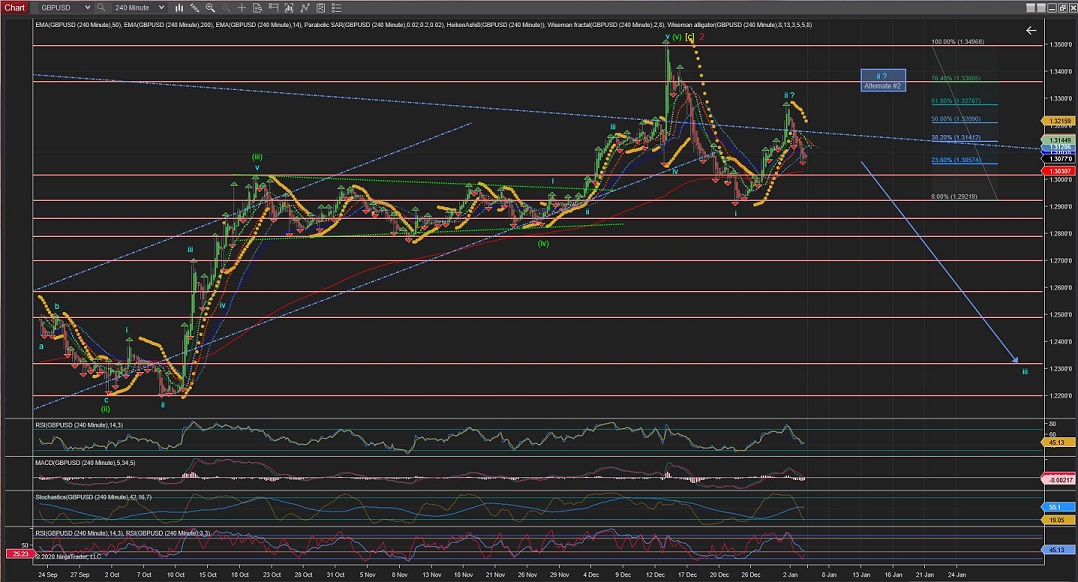
4Hour Chart shows 5 possible waves have now completed Wave i downwards.
Since then, Wave ii raised the price above the upper long term trend upto the exact %62 retracement level to drop again.
Wave iii would be confirmed once the price crosses the end of Wave i so I have marked Alternate #2 for a possible extension of Wave ii towards higher retracement levels.
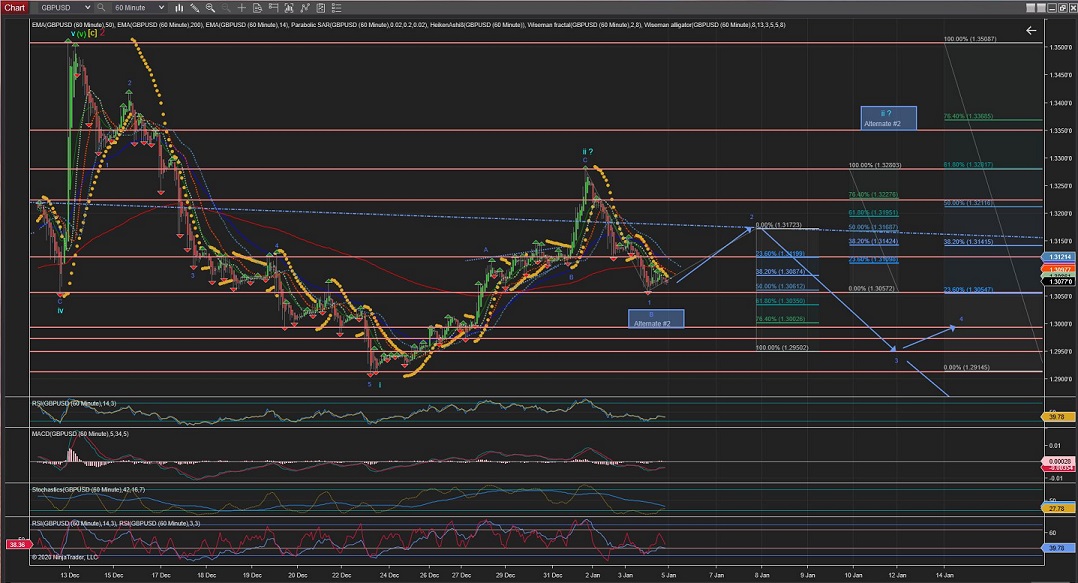
60Min Chart shows 5 waves down for Wave 1(blue) - Which I have marked as Wave B in the Alternate #2 count.
And, regardless of the counts, it is expected a raise; In the current count for Wave 2(blue) towards the upper trendline.
After Wave 2(blue) is completed we should see Wave 3(blue) to drop the price back towards the 1.2900 area again.
CADJPY
Weekly Chart is showing Wave [ii] correction still under development towards the upper trendline and 200EMA.
(Alternate #1 calls for the lon-term correction to have completed at the last low and the breakout of the upper trendline to continue as the strat of a new trend.
Daily Daily Chart shows Wave 3(blue) continues to push the price to the upside towards the upper trendline (blue-dotted).
4Hour Chart shows the internal waves of Wave 3(blue) under development;
With its initernal Wave (iv) now underway (wich should remain above the highest of Wave (i) at 82.60 area for this count to remain valid.
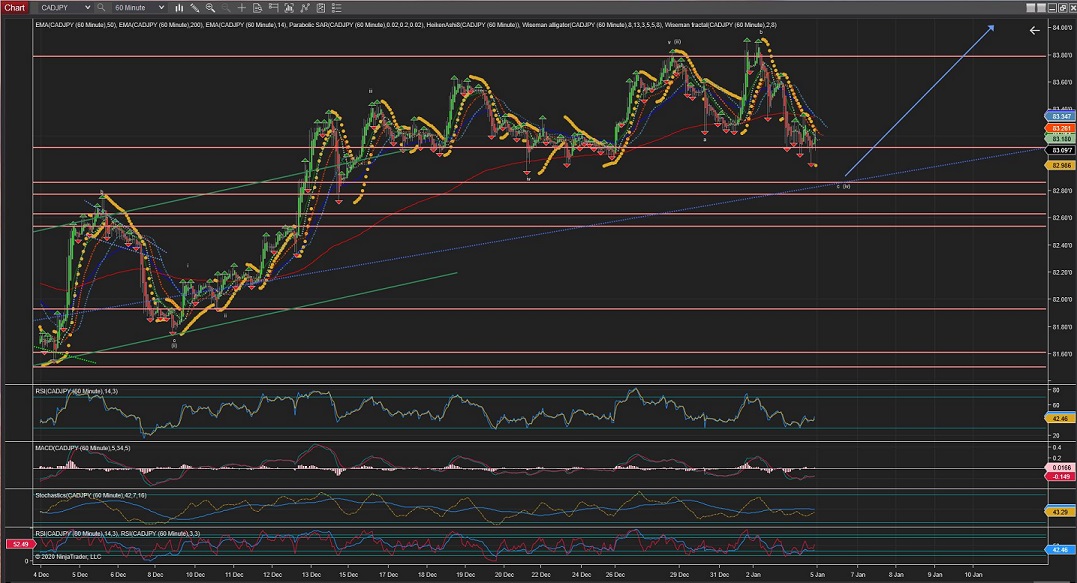
60Min Chart shows a Wave (iv) internal Wave b crossing the start of Wave a; Suggesting an Extended Flat Correction is developing that could see the price drop towards the 82.80 area, as Wave c gets extended to the downside and towards the lower trendline.
All the best for everyone and please do not hesitate to contact me if you have any questions or comments.
Andres
info@tradingwaves.org


 Trading Waves .org