Tue 10-12-2019
Hi everyone, hope you are all ok.
Let's get into it...
USDJPY
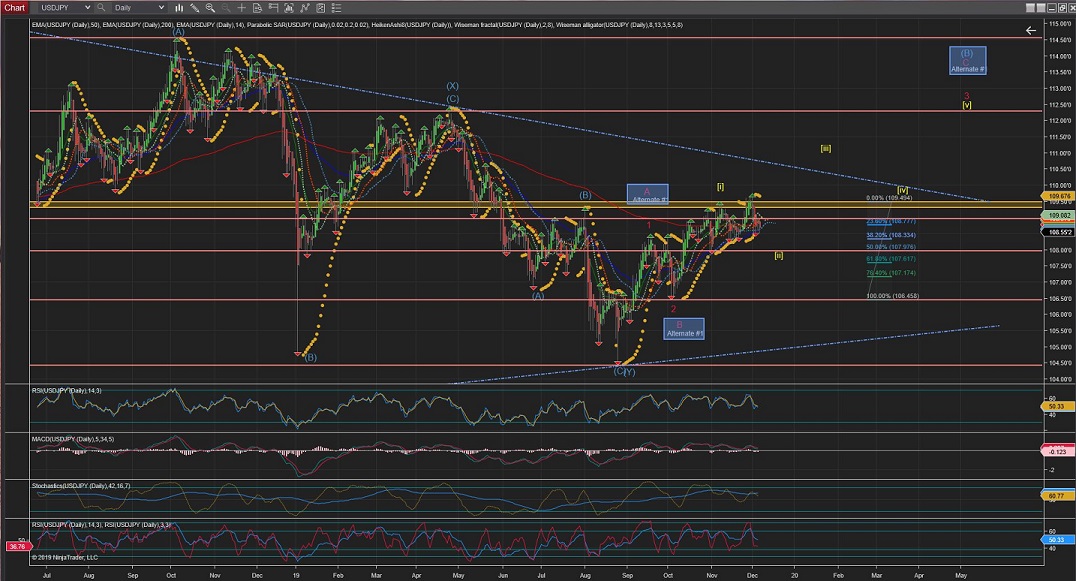
Weekly Chart is still showing impulse to go towards the long term upper trend line for Wave (1), bearing in mind the Alternate#1 count for an extended Wave (C) of Wave (Y).
Daily Chart is showing Wave [ii] as an expanded flat correction still under development on its last internal wave aiming, perhaps, towards the %50 or %62 retracement level.
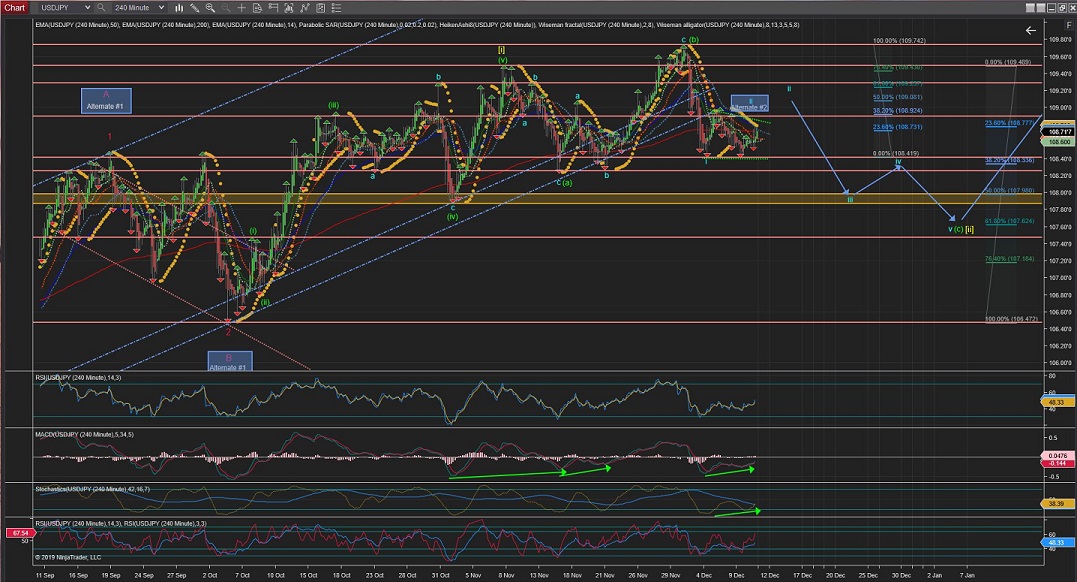
4Hour Chart shows the internal waves of Wave [ii] expanded flat correction under development, with Wave ii of Wave (c) correction still under development, before Wave ii continues to cross the lowest of previous Wave a (which would meet the %50 or greater retracement levels).
Note: within Wave (c) there is currently a flat correction as Wave ii, which could complete within the current triangule formation, as labelled by Alternate #2, or could breaktrough the triasmgule and show a last rally up (as the MAC divergence is indicating) towards the %50 or %62 typicall retracement.
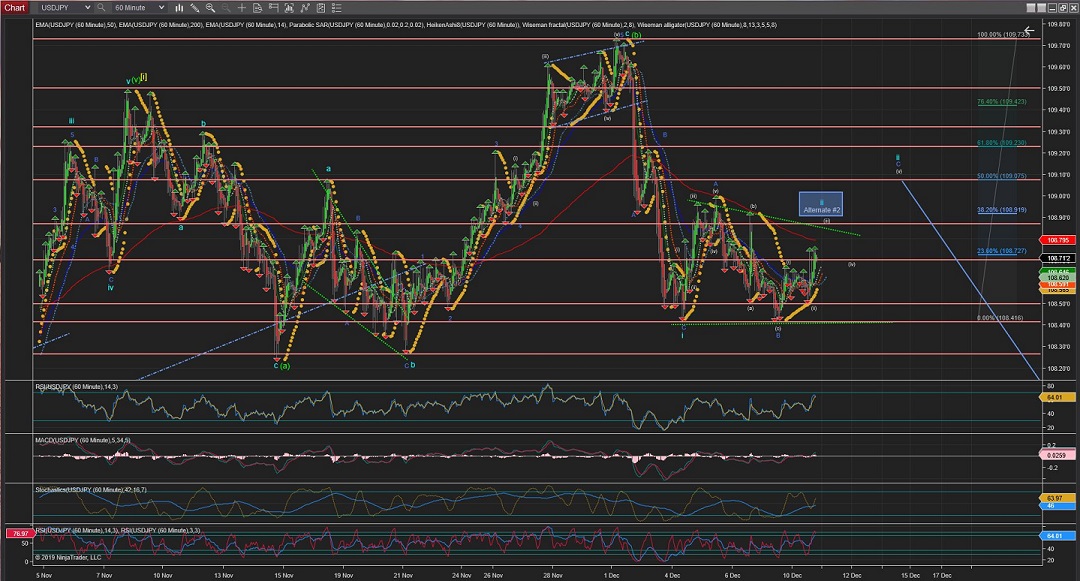
The 60Min Chart shows the internal waves of Wave (c);
With the possible Alternate #2, which would complete its internal Wave ii within the triangule...
And the current count indicating Wave ii is still in Wave (iii) of the 5 waves to complete Wace C(blue) and due to raise again towards the 200EMA.
60Mins
4Hours
Daily
Weekly
EURUSD
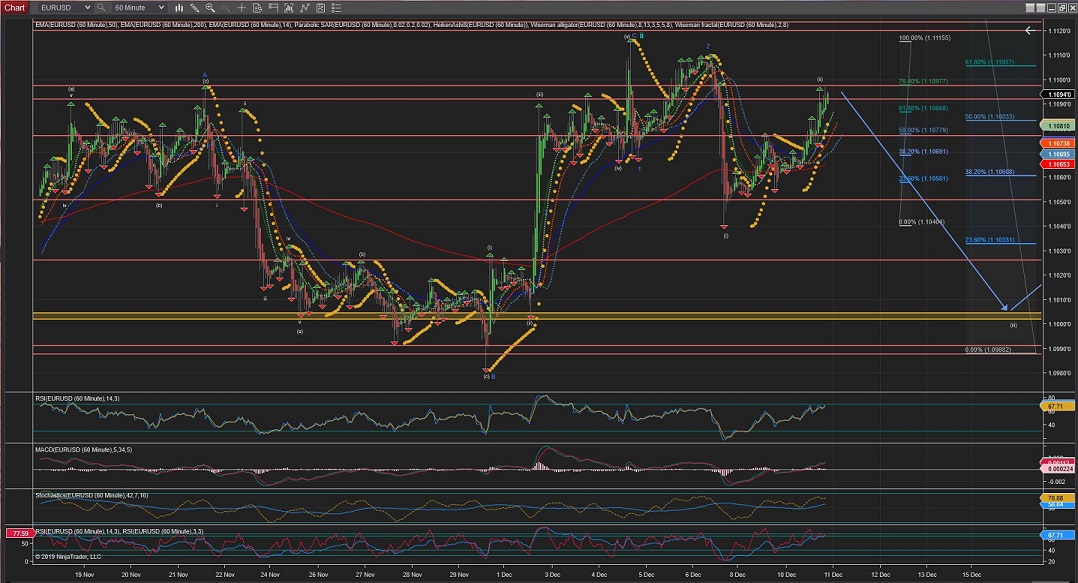
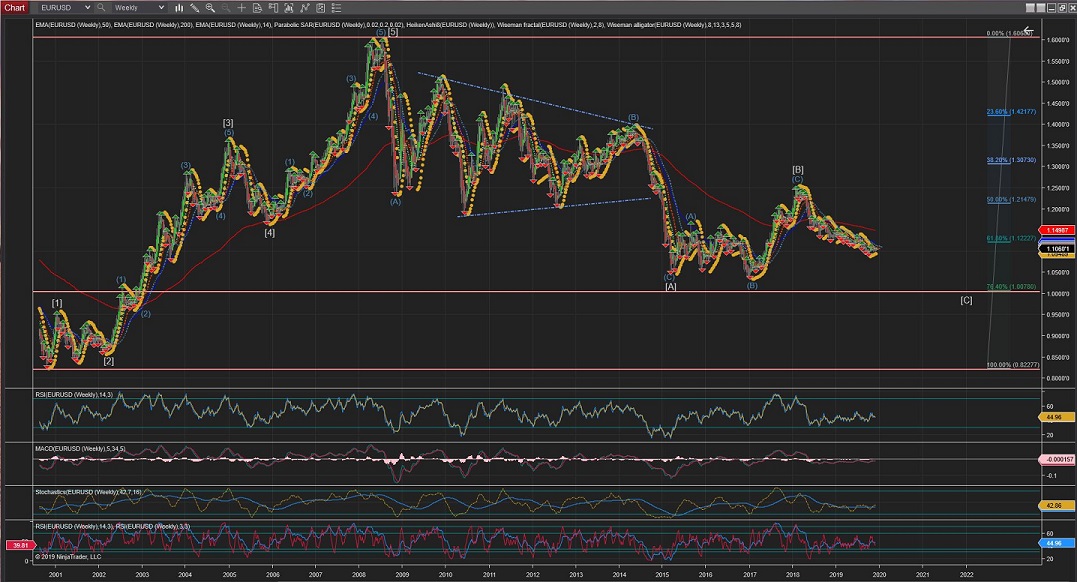
Weekly Chart under the current interpretation, shows a Wave [C] developing towards the %76 retracement of the 5-Waves raise from 2002 to 2008.
Daily Chart is showing Wave [ii] possibly completed at %50 retracement, although it is raising further the posibility that the correction gets extended to trigger Alternate #1 count for a retracement towards %61 or even %76 at the upper long term trend.
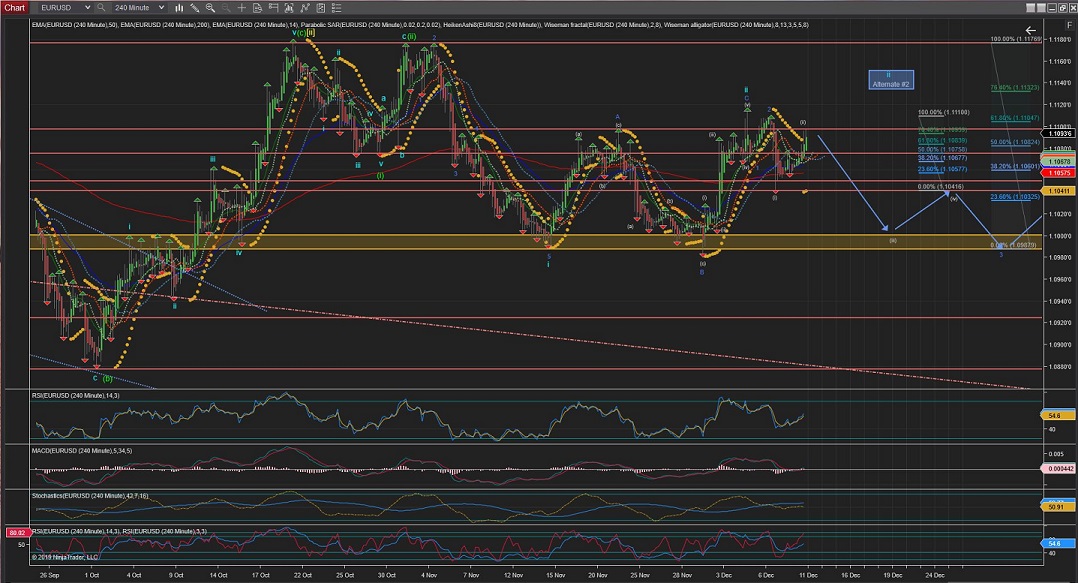
4Hour Chart is showing the current count now stands for a Wave ii expanded flat correction that, after the last session's impulsive move down, looks like could be completed at this point; between the %62 and the %76 retracement level, and Wave iii starting to develop.
60Min Chart, under the current count, shows the internal waves of the possible Waves 1 and 2 (blue) completed and the internal Waves (i) and (ii) of Wave 3(blue)possibly complete.
Next, after completion of Wave (ii), (and unless it raises further than the 0 retracement to trigger the alternate #2 count)...
... we should see Wave (iii) to drop down impulsivelly through the 200EMA, to see Wave 3(blue) completed towards the 1.1000 price level.
60Mins
4Hours
Daily
Weekly
GBPUSD
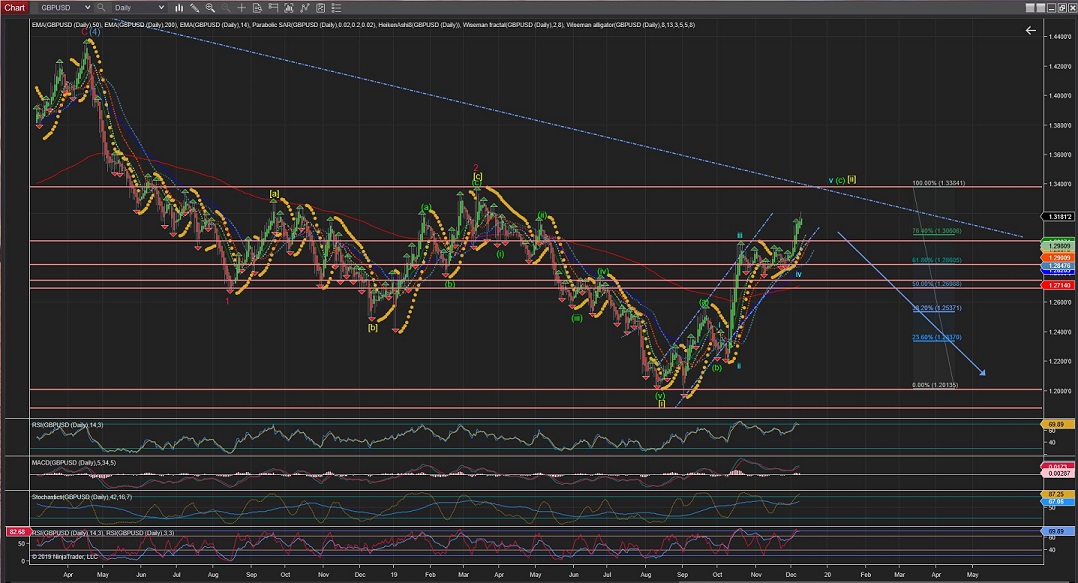
Weekly chart shows an Alternate #1 that indicates that Wave (5) could have been completed as a failed Wave (5); suggesting a change in trend ahead for a correction.
And, under the current count; Wave (5) more extended than Wave (1) to be still under development.
Daily Chart is showing an extended Wave [ii] aiming at a long term trendline crossing now the %76 retracement level and about to finish anytime now.
(further moves from the 0 retracement area would invalidate the current count and I will have to revise the whole long term count)
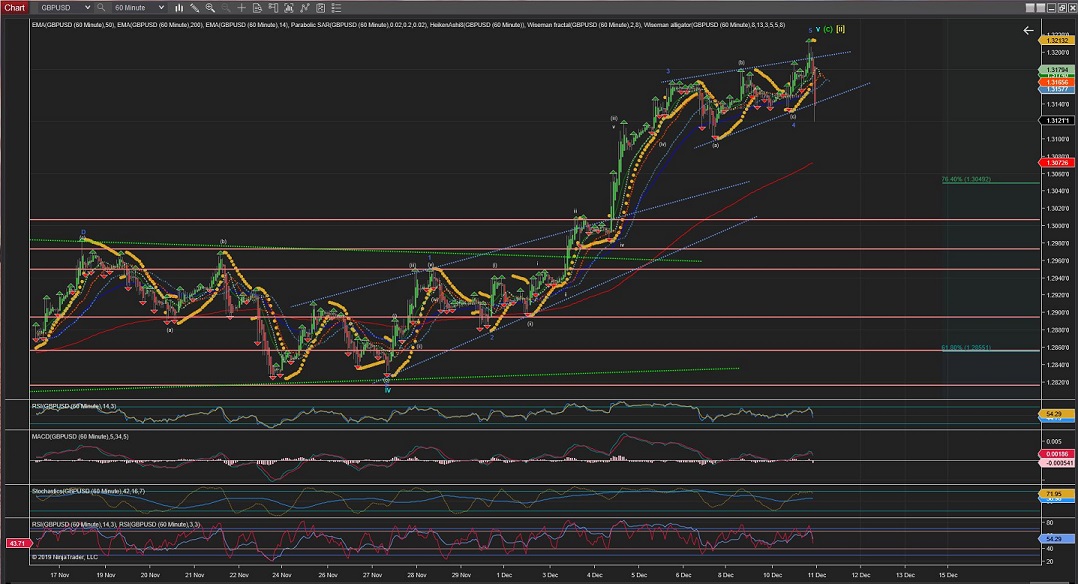
The 4Hour Chart shows that Wave v broke out of the wedge formation made by Wave iv in the past weeks.
Wave v has crossed the %76 retracement level and has triggered the Alternate #2 count for a Wave v that has already surpassed the length of Wave i (with an extended Wave iii in the set of waves).
The 60Min Chart is showing the internal waves of Wave v, now extended as previously labelled as Alternate #2.
Which could be about to or finished... and with that the end of Wave (c) and a long Wave [ii].
Next, if this is the end of Wave [ii] and further moves up do not trigger the Alternate count, we should see very impulsive waves down on the start of Wave [iii].
60Mins
4Hours
Daily
Weekly
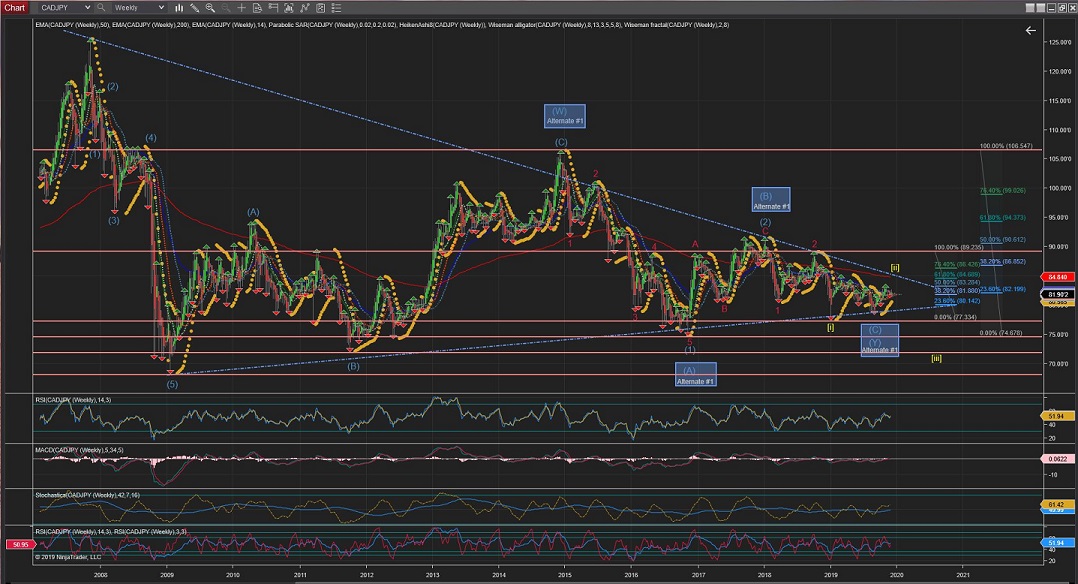
CADJPY
Weekly Chart is showing Wave [ii] correction still under development towards the upper trendline and 200EMA.
(Alternate #1 calls for the lon-term correction to have completed at the last low and the breakout of the upper trendline to continue as the strat of a new trend.
Daily Chart shows Wave 2(blue) of Wave iii to have compoleted at a new trend formation (blue-dotted) and indicating that Wave 3(blue) should start taking over impulsivelly to the upside.
4Hour Chart shows the internal Waves 1 and 2 (blue) and the Alternate #2 for an extended Wave 2 (blue) correction aiming at the %76 retracement level instead of current completion at %62.
60Min Chart shows further the internal waves; With Wave ii of Wave (iii) now completed within a small trendline (green-line) at slightly mpore than the %62 retracement level.
(further price drop from this trend channel(green-line) would trigger Alternate #3 for Wave (ii) as an Expanded Flat correction or, if further down, Alternate #2 mentioned earlier).
60Mins
4Hours
Daily
Weekly
All the best for everyone and please do not hesitate to contact me if you have any questions or comments.
Andres
info@tradingwaves.org


 Trading Waves .org