Wed 04-12-2019
Hi everyone, hope you are all ok.
Let's get into it...
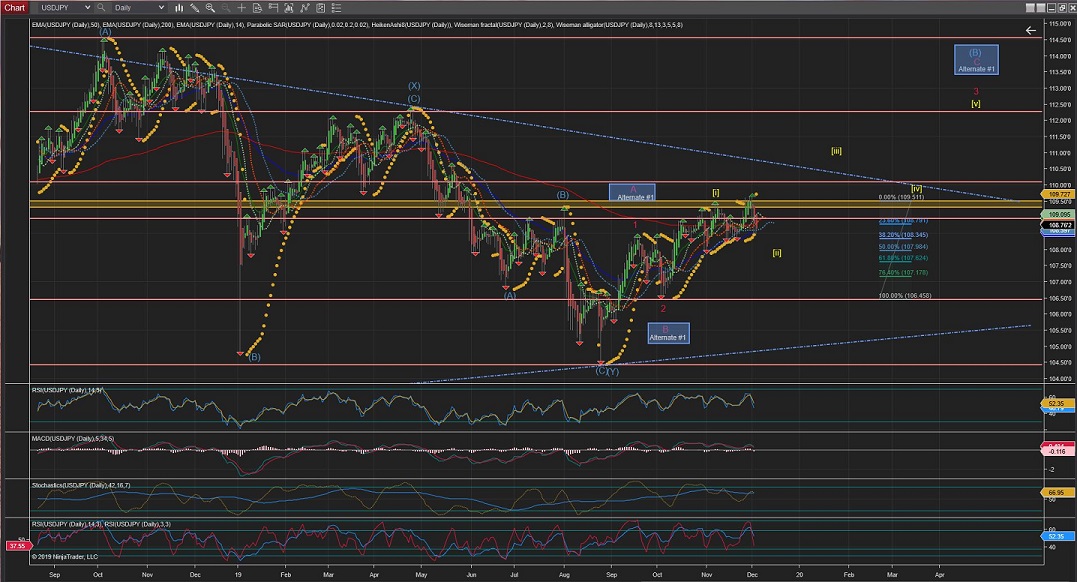
USDJPY
Weekly Chart is still showing impulse to go towards the long term upper trend line for Wave (1), bearing in mind the Alternate#1 count for an extended Wave (C) of Wave (Y).
Daily Chart is showing the updated labels for the triggered Alternate count for a larger Wave [i] and now Wave [ii] expanded flat correction still under development on its last internal wave aiming, perhaps, towards the %50 or %62 retracement level.
4Hour Charts shows the internal waves of the now updated Wave [ii] expanded flat correction under development, with Wave c on the way to cross the lowest of previous Wave a (which would meet the %50 or greater retracement levels).
The 60Min Chart shows the internal waves of Wave (c) underway; With its initial Wave a (of Wave (c)) complete and Wave b raising with again towards the 200EMA.
60Mins
4Hours
Daily
Weekly
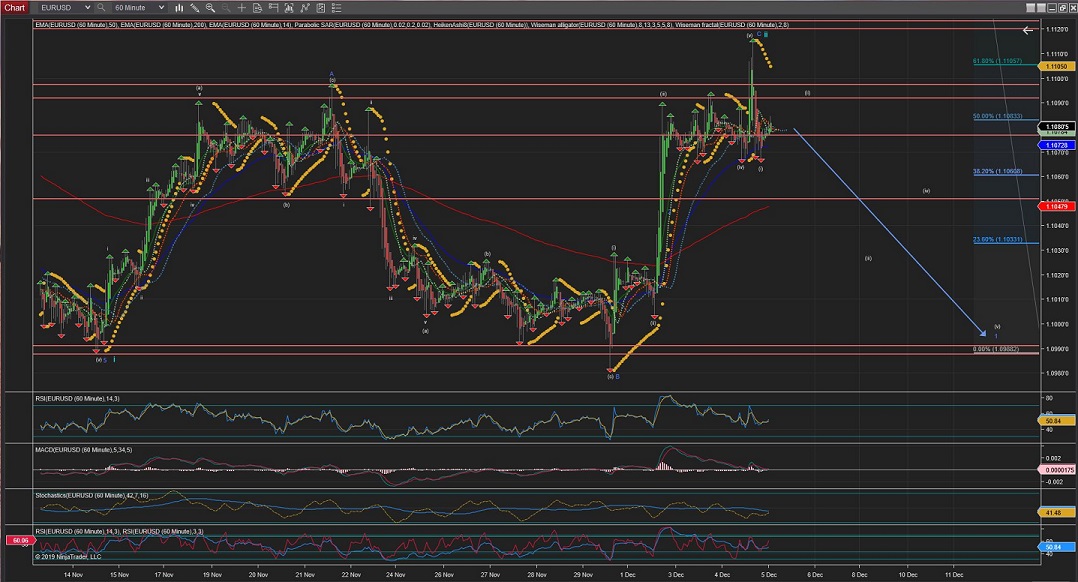
EURUSD
Daily Chart is showing Wave [ii] possibly completed at %50 retracement, although it is raising further the possibility that the correction gets extended to trigger Alternate #1 count for a retracement towards %61 or even %76 at the upper long term trend.
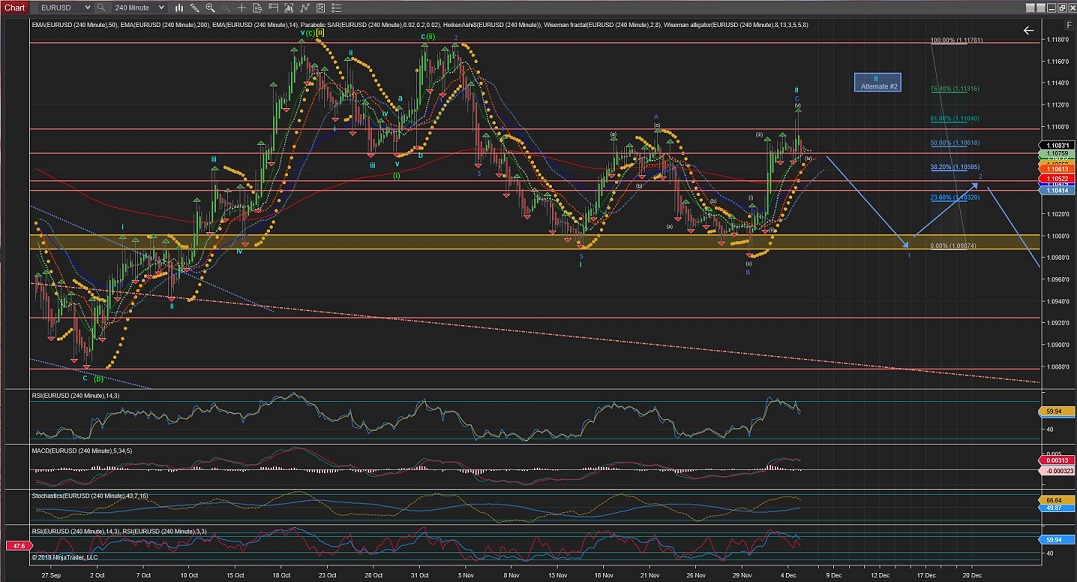
4Hour Chart is showing that the raise today has invalidated the previous count; The current count now stands for an extended flat correction and, although it looks like could be completed at this point, it could be further expanded further up to aim at the %76 retracement level.
60Min Chart shows the internal waves of the possibly completed Wave ii and an impulsive wave to the downside that could indicate Wave (i) of Wave 1(blue) of Wave iii.
60Mins
4Hours
Daily
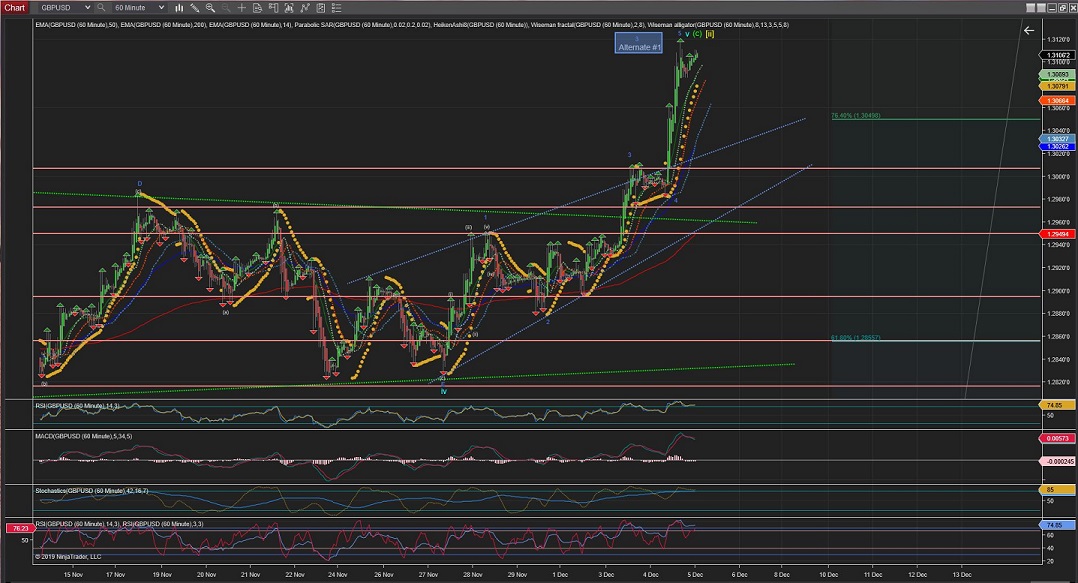
GBPUSD
Daily Chart is showing an extended Wave [ii] aiming at a long term trendline crossing now the %76 retracement level.
The 4Hour Chart shows that Wave v broke out of the wedge formation made by Wave iv in the past weeks.
Now Wave v of Wave (c) of Wave [ii] is crossing the %76 retracement level and could be aiming towards greater retracement levels (between %76 and 0), if it were to touch the upper trend line around the 1.3100 price.
(further moves from the 0 retracement area would invalidate the current count and I will have to revise the whole long term count)
The 60Min Chart is now showing a the current internal waves of Wave [ii] passing through the %76 retracement level.
As per current count it has developed 5 Waves up to complete Wave 5(blue) of Wave v of Wave (c) of Wave [ii]
Although the Alternate #1 labels this top as the completion of Wave 3(blue) and a further raise after a corrective Wave 4 could continue.
Either way, once completed, I am expecting impulsive waves to show the change of trend to the downside for Wave [iii].
60Mins
4Hours
Daily
All the best for everyone and please do not hesitate to contact me if you have any questions or comments.
Andres
info@tradingwaves.org


 Trading Waves .org