Thu 28-11-2019
Hi everyone, hope you are all ok.
Let's get into it...
USDJPY
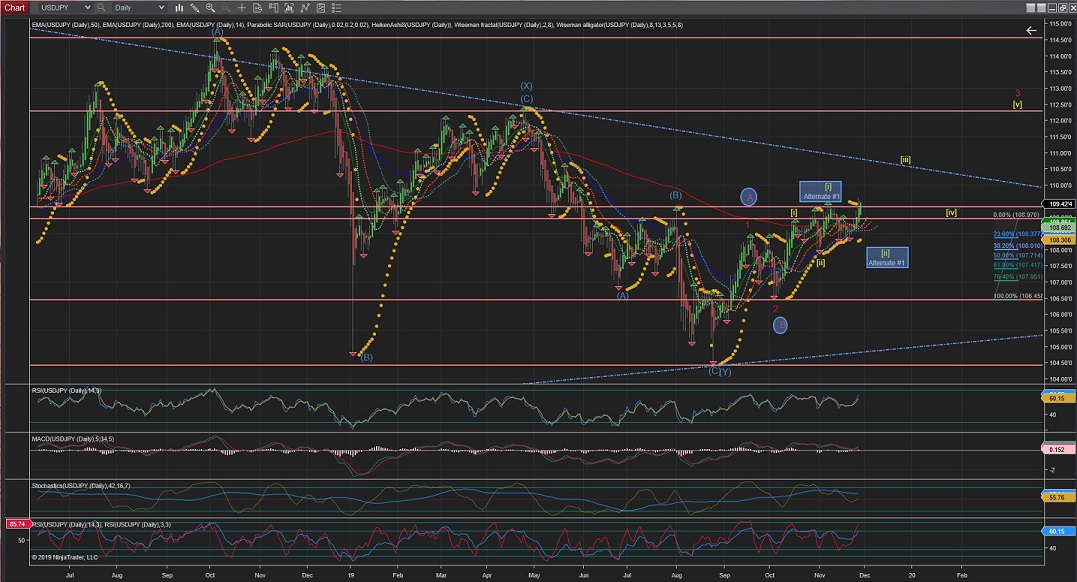
USDJPY Daily and 4Hour Charts are showing a possible Wave [iii] under development, almost leaving behind the Alternate #1 count for a possible extended Wave [ii].
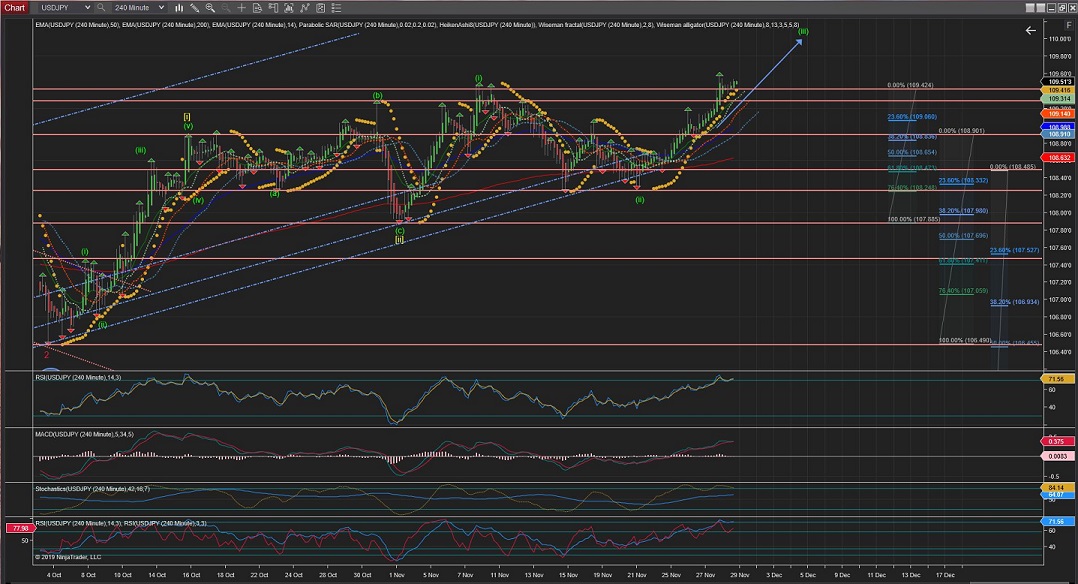
The 4Hour Chart is showing Wave (ii) of Wave [iii] completed at exactly %76 retracement and it has bounce of the low trend-line impulsivelly into what is now reaching to be a Wave (iii) with the same length (so far) as Wave (i).
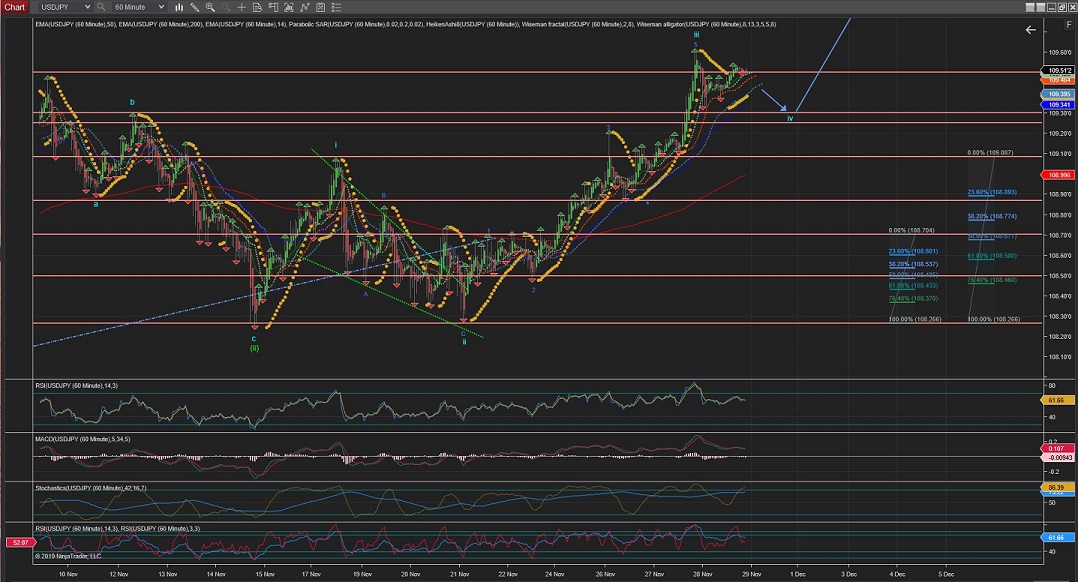
The 60Min Chart shows Wave iii completed with 5 clearly impulsivelly waves.
Wave iv correction it is now taking its turn; And for the rule of alternation, as Wave ii was a deep correction, Wave iv should be a more moderate correction (i.e. a flat or triangule correction) and, regardless, should not enter the price of Wave 1 (@ 109.10).
60Mins
4Hours
Daily
Weekly
EURUSD
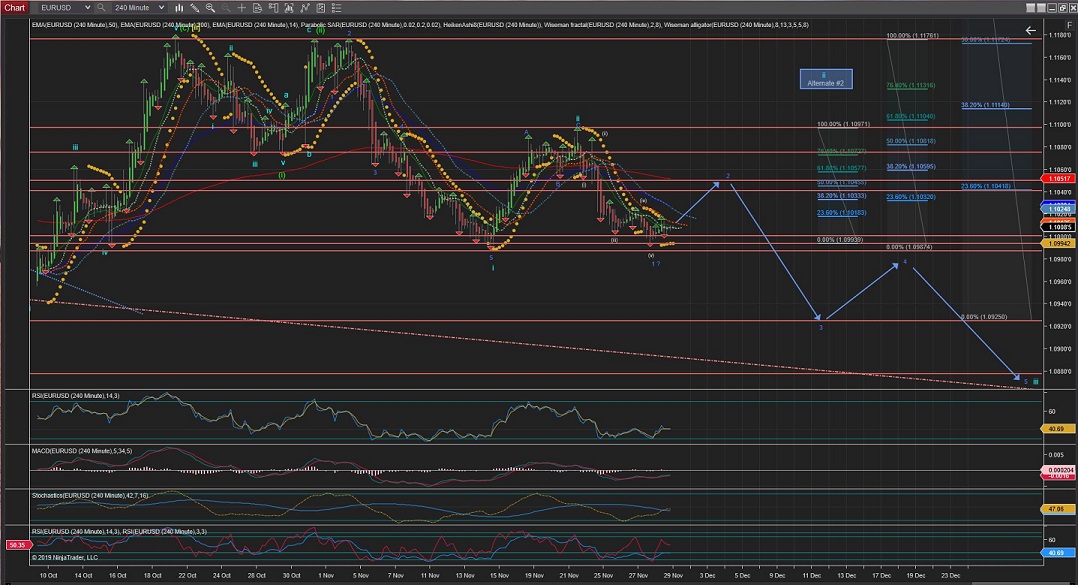
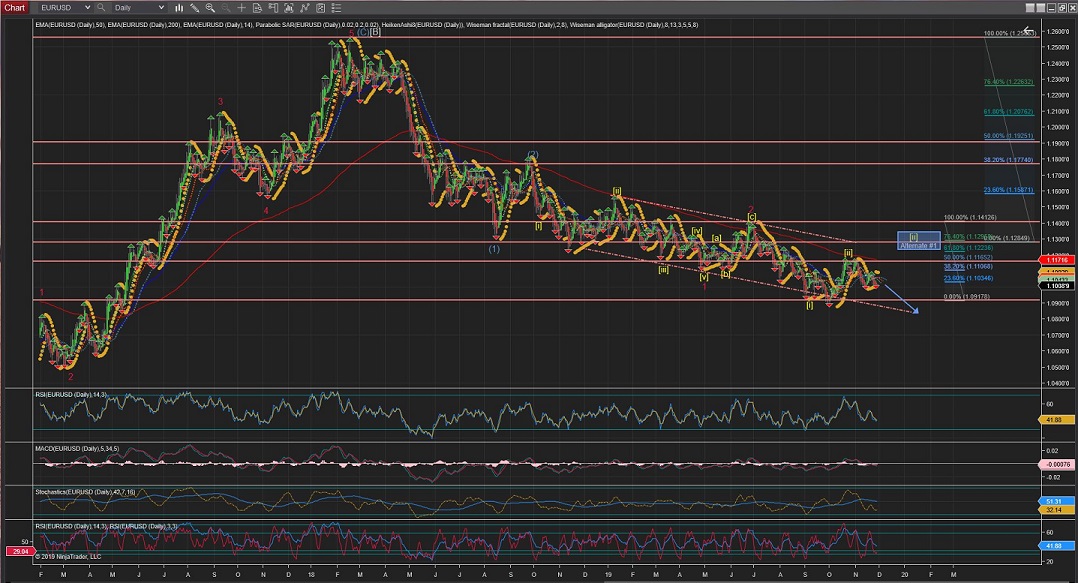
EURUSD Daily Chart is showing Wave [ii] possibly completed at %50 retracement, although there is still posibility that the correction gets extended to trigger the Alternate #1 count for a greater retracement; This coming week would decide between the alternate vs the current count.
The 4Hour Chart shows a Wave ii that might have found completion at just below the %62 retracement level.
The Alternate #2 for a Wave ii extending towards the %76 level is also possible and Wave iii would only be confirmed after crossing the end of Wave i at 1.0988.
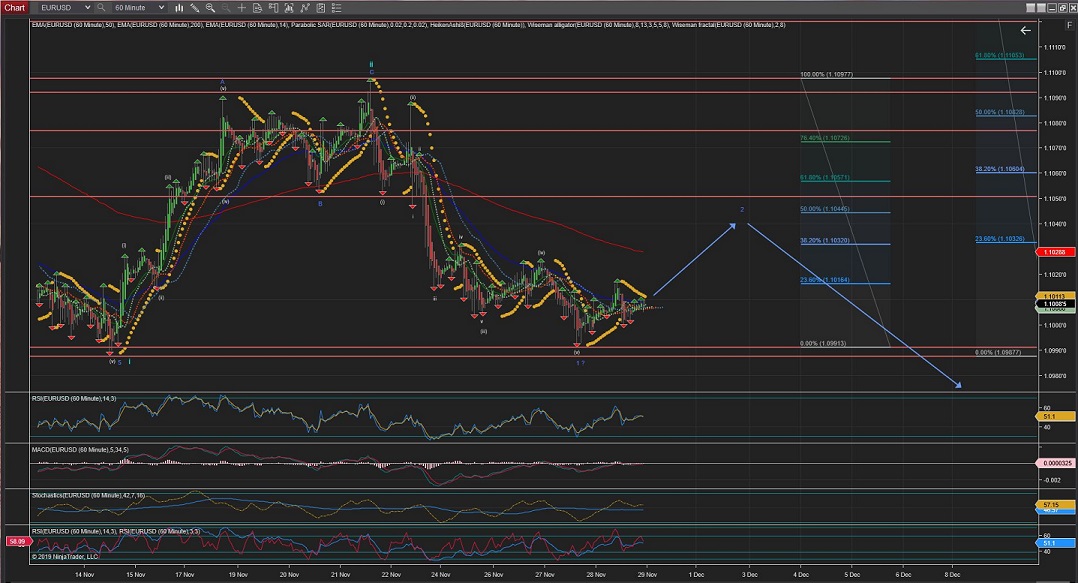
In the meantime, as per current count, Wave 1 (blue) of Wave iii seems to have completed and Wave 2(blue) correction should be now on its way.
The 60Min Chart shows more in detail current Wave 1(blue) of Wave iii internal waves, where Wave 2(blue) could be developing but too early to determine the type of correction.
60Mins
4Hours
Daily
GBPUSD
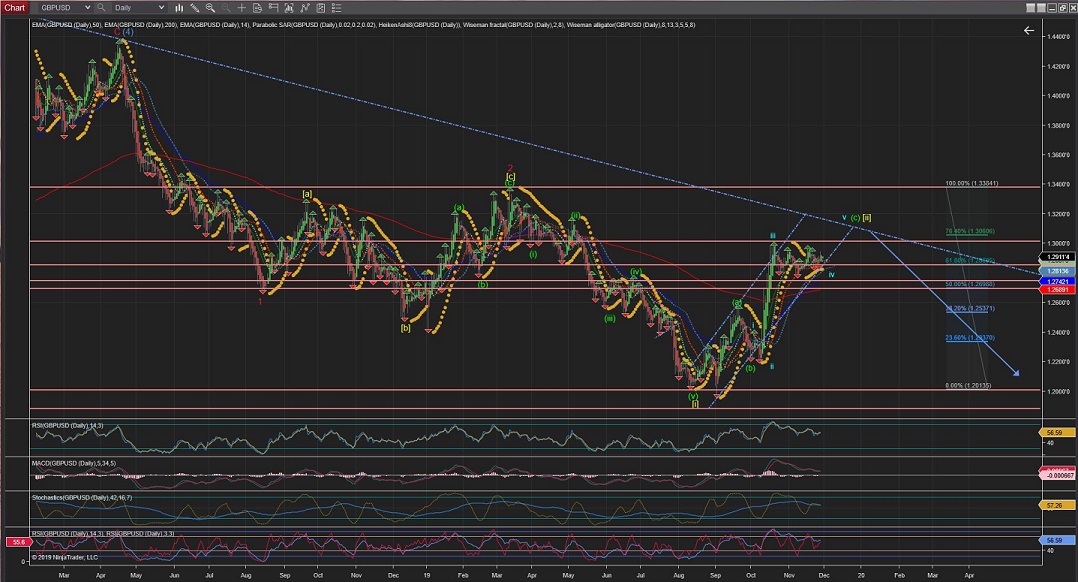
GBPUSD has moved sideways throughout the few past weeks and recent moves have trigered the Alternate count for an extended Wave [ii] aiming at a long term trendline and the %76 retracement level (best seen in the Daily Chart).
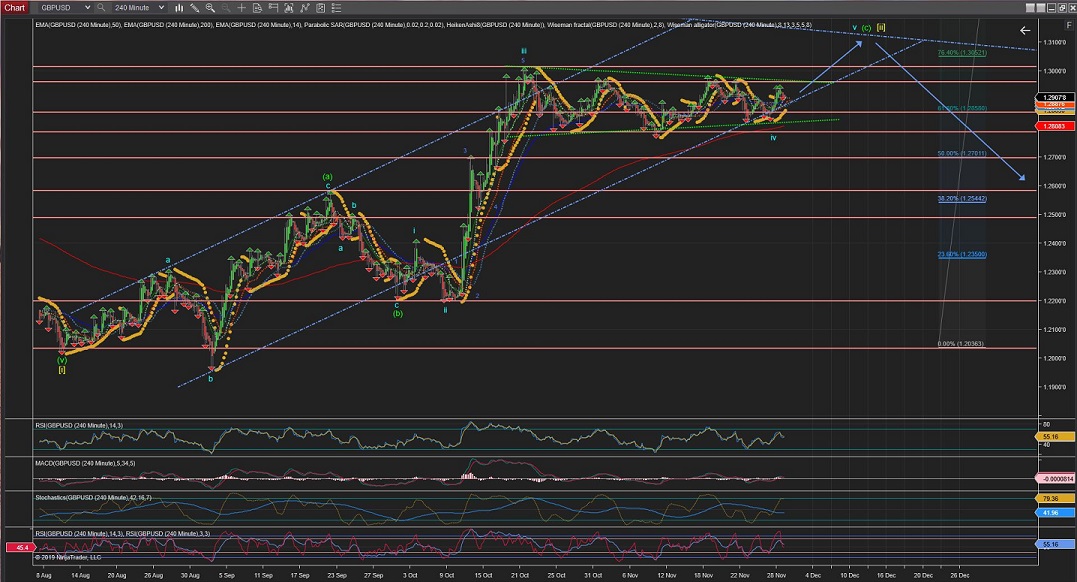
The 4Hour Chart shows that Wave iv could potentially come to an end by breaking out of the wedge formation of the past weeks.
This potential break out should complete Wave v of Wave (c) of Wave [ii] at around the %76 retracement level.
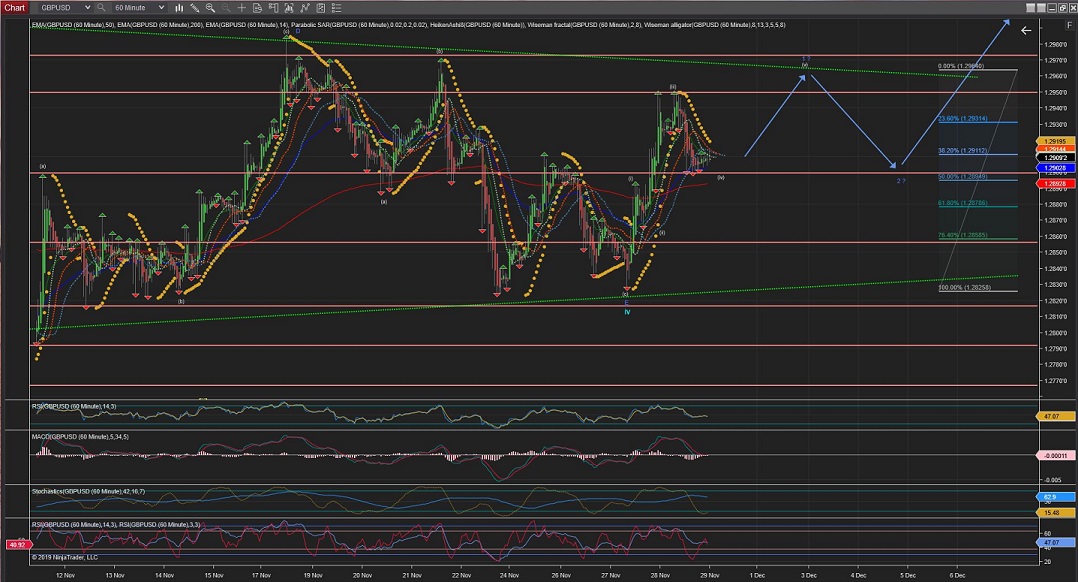
The 60Min Chart is now showing a potential 3 waves raise for what couold be Wave 1(blue) after a completed Wave iv.
There is a corrective Wave (iv) that, if the count is correct, should not enter the price of Wave (i) at 1.2894.
Next, I am expecting a Wave (v) raise towards the upper trend (green) to complete Wave 1 (blue).
60Mins
4Hours
Daily
All the best for everyone and please do not hesitate to contact me if you have any questions or comments.
Andres
info@tradingwaves.org

 Trading Waves .org