Thu 21-11-2019
Hi everyone, hope you are all ok.
Let's get into it...
USDJPY
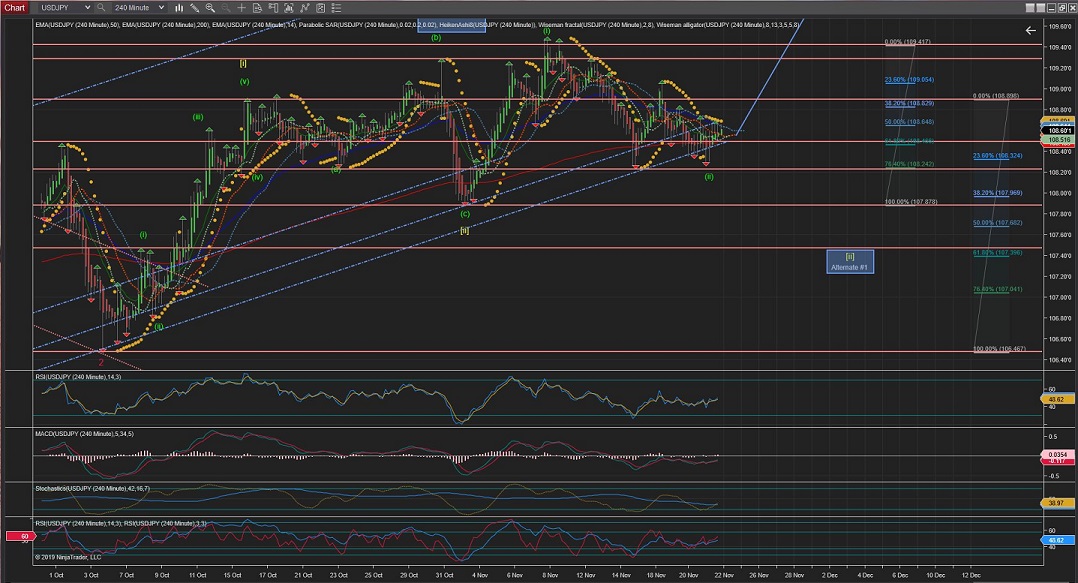
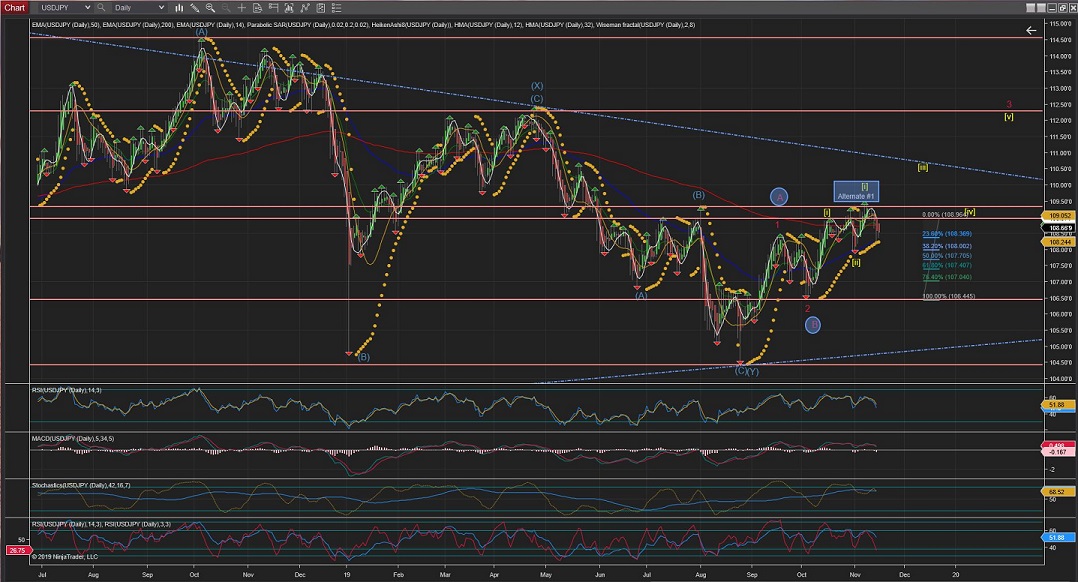
USDJPY Daily and 4Hour Charts are showing an ongoing Wave [ii] ZigZag (5,3,5) correction in its last internal wave.
Crossing the most recent highest would invalidate the Alternate count and confirm Wave [iii].
The 4Hour Chart is showing a possible Wave (ii) of Wave [iii] completed at exactly %76 retracement of Wave (i) and it has bounce of the low trend-line slightly into a possible start of Wave (iii).
(The Alternate #1 count is still on the cards for extended Waves [i] and [ii], should the price drop below the 107.87 price (0 retracement level))
The 60Min Chart shows a messy Wave ii hitting the lowewr trendline (blue) again with what appears to be its internal Wave C crossing at nearly 0 to complete Wave ii (any further than the 0 would have invalidated the count).
Since Wave ii completion there has been a raise and next we should expect Wave iii picking up the prices impulsivelly higher across the 109.00 price barrier and the price to remain above the 108.25 price for this count to remain valid.
60Mins
4Hours
Daily
Weekly
EURUSD
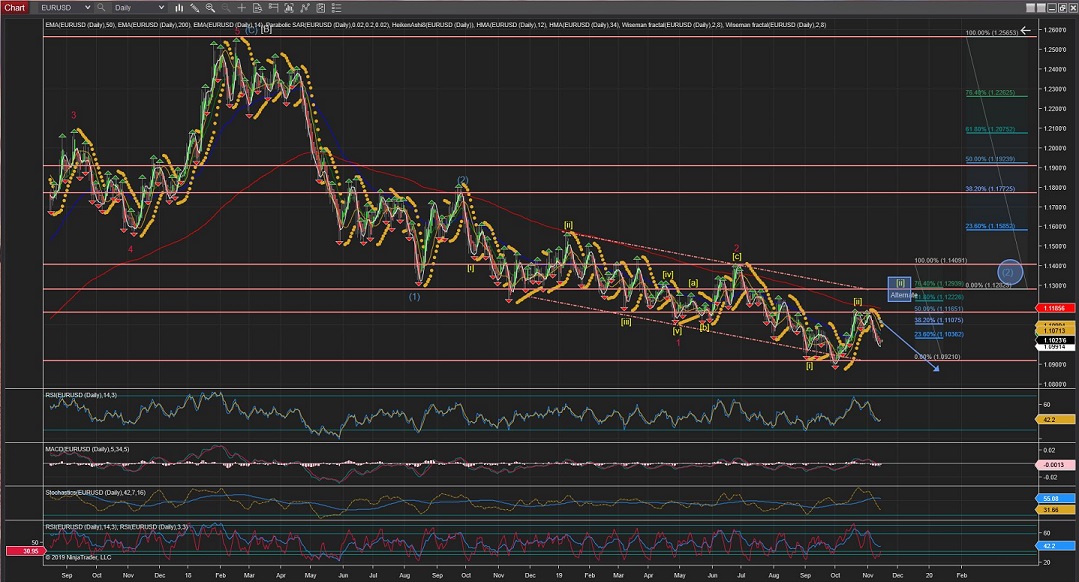
EURUSD Daily Chart is showing Wave [ii] possibly completed at %50 retracement, although there is still a real posibility that the correction gets extended to trigger the Alternate #1 count for a greater retracement; This coming week would decide between the alternate vs the current count.
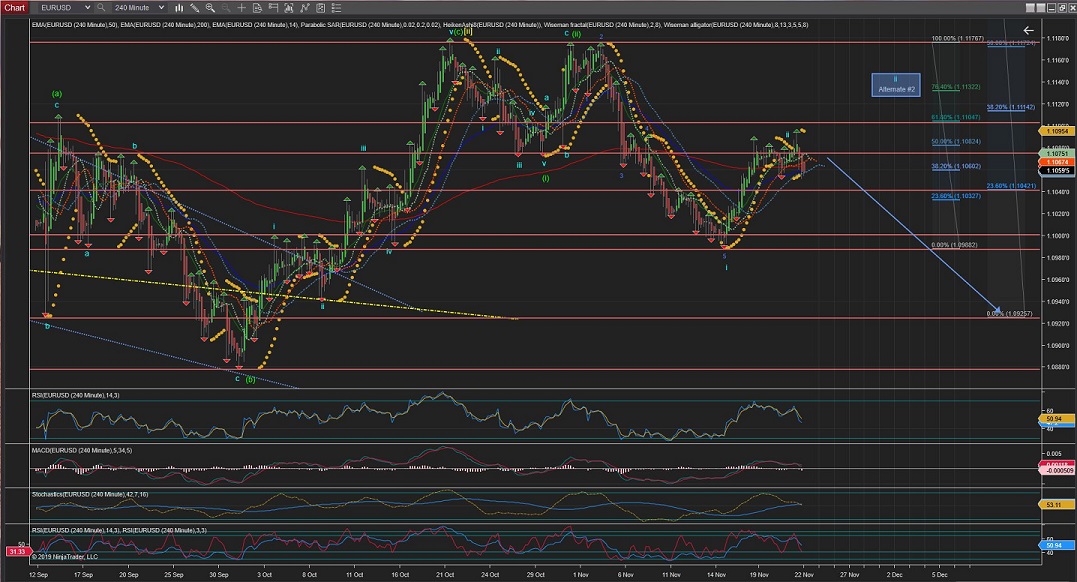
The 4Hour Chart shows Wave i with 5 internal waves very impulsive to the downside and a Wave ii that might have found completion at just below the %62 retracement level.
(Please note the Alternate #2 for a Wave ii extending towards the %76 level).
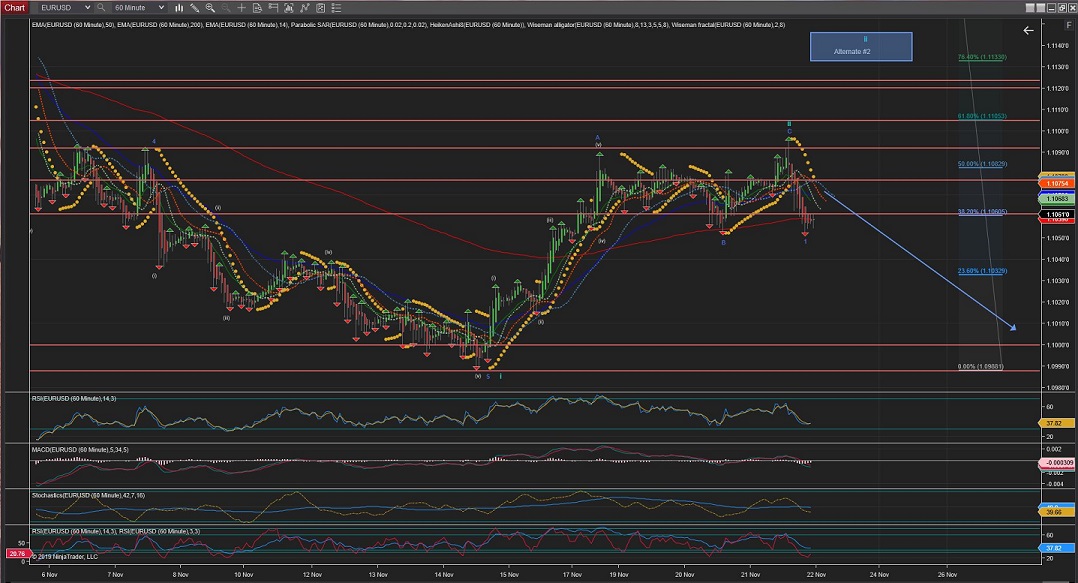
The 60Min Chart shows more in detail Wave i and Wave ii internal waves, and an impulsive wave down now that night signal the start of Wave iii.
60Mins
4Hours
Daily
GBPUSD
GBPUSD has moved little throughout this week in the current correction but the current count remains the preferred count as it is looking now to reverse into Wave [iii] to the downside, although it has not picked up very impulsive waves to the downside yet.
(The other Alternate count marked is for an extended Wave [ii] correction reaching the %76 retracement level or slightly higher).
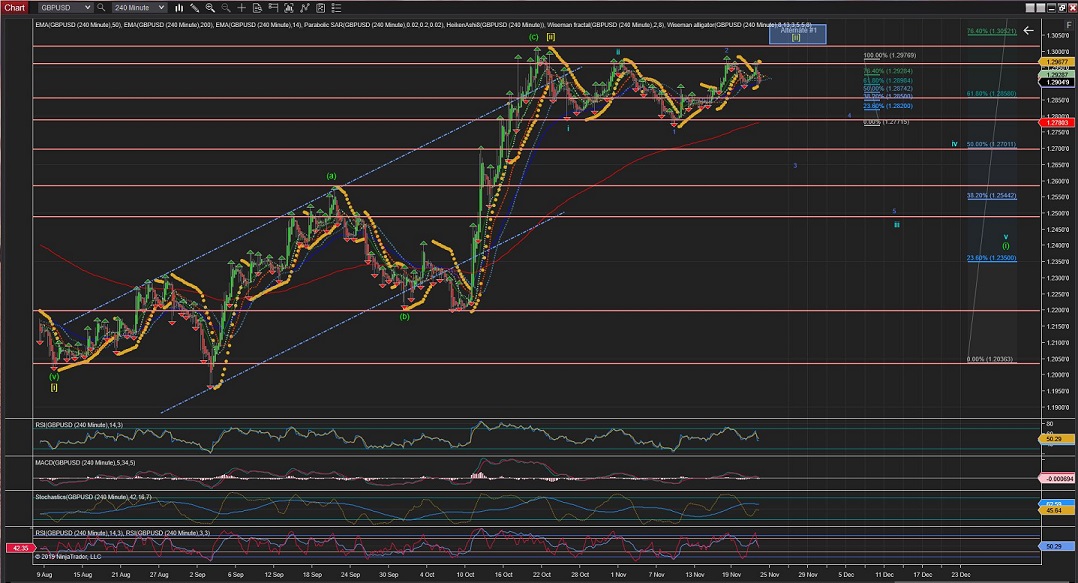
The 4Hour Chart shows Wave iii has started in a slow mode with an internal Wave 2 correction almost reaching the 0 retracement level, hence nearly triggering the Alternate count... And, as with the EURUSD pair, the longer the wait for impulsive Waves to the downside, the most indications towards an extended Wave [ii] correction, as per Alternate #1.
I have left the current count as there is still a possibility that Wave 3 (blue) picks up to the downside to what resembles now a triple top in place.
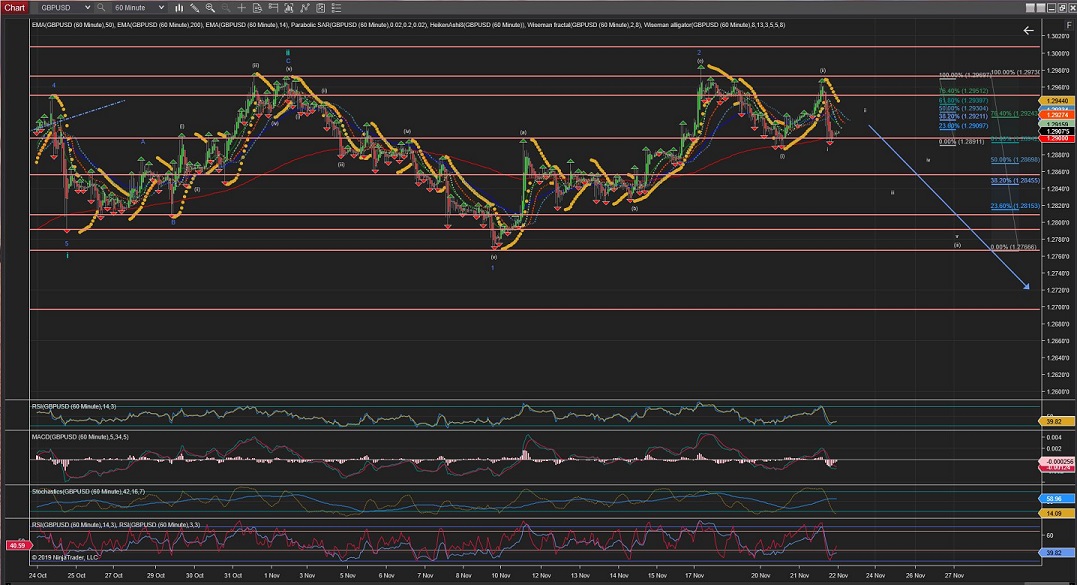
The 60Min Chart is now showing the internal waves of Wave 2(blue) possibly completed... With the initial internal Waves (i) and Wave (ii) of Wave 3(blue) possibly under development.
I'm expecting the price to drop more impulsively, and the price to continue lower across the end of previous Wave 1(blue) at 1.2766 after current Wave (iii) of Wave 3 picks up momentum.
60Mins
4Hours
Daily
CADJPY
CADJPY Weekly Chart shows 5 clear waves to the downside (2008-2009) and a correction that might have completed in 2015.
Which brought the price back down since then until 2017 (unless the correction is still being extended, as marked in the Alternate counts).
The whole count from 2008 until now has formed a downwards triangle that also suggest that the price could breakout lower, continuing the mayor trend.
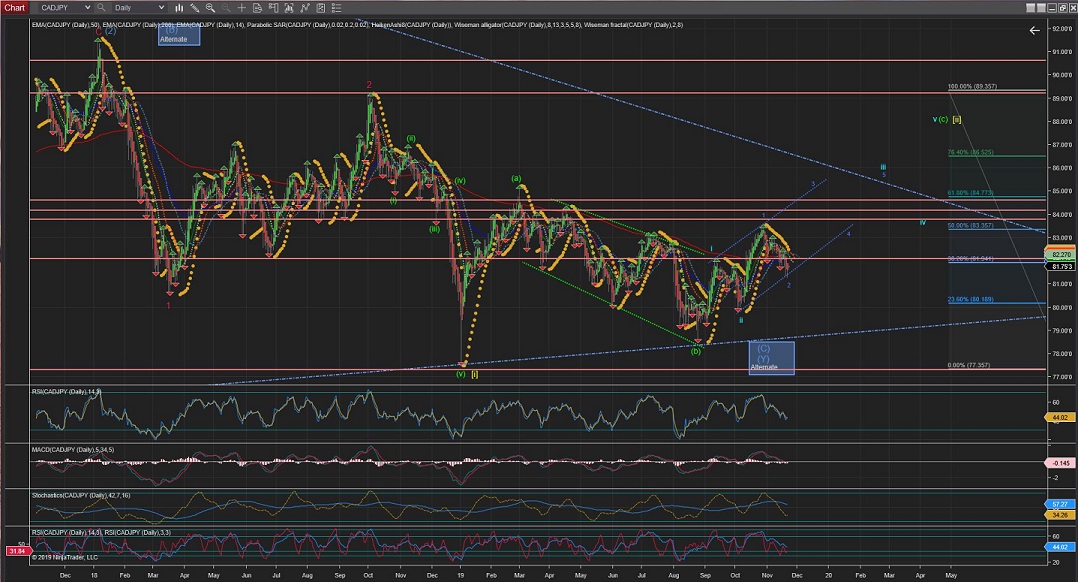
CADJPY Daily Chart shows that the price is targetting the upper triangule trend line in Wave (c) of Wave [ii] with a continuation of Wave v to the upside again.
And it has now formed a channel (blue-dotted) with the recent internal waves.
Following the updated count;
The 4Hour Chart shows more in detail that Wave iii has started with its internal Waves 1(blue) and Wave 2(blue) of Wave iii completed; Wave 2(blue) completing at the %62 retracement level.
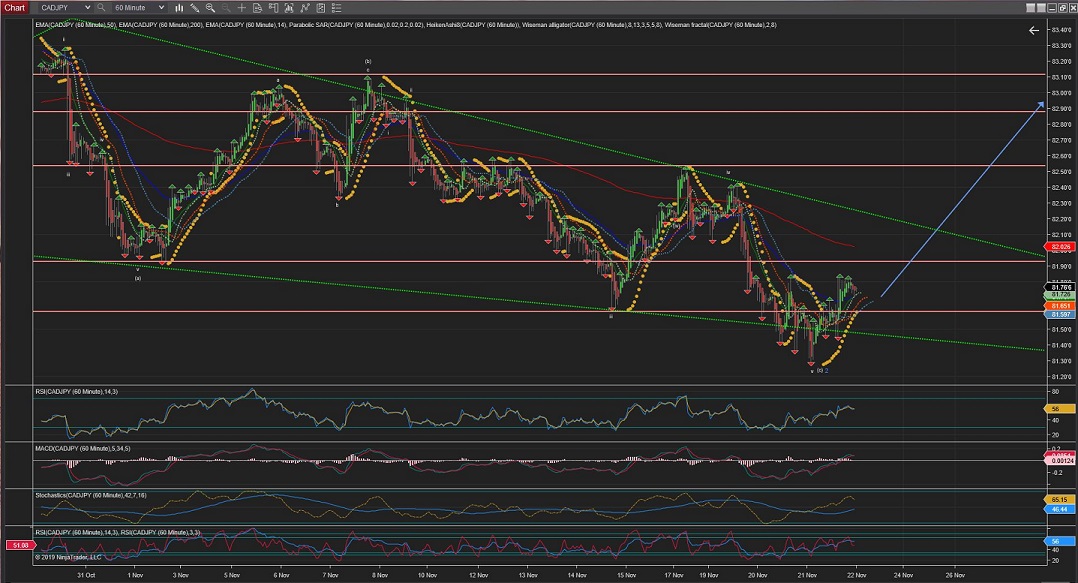
CADJPY 60Min Chart is showing the innings of this Wave 2(blue) correction. And, although there could be different interpretations (i.e. a triangule ABCDE) I am inclined to use this one as the inner waves can be read quite clearly into different waves of 5 whereas an ABCDE should define more clearly internal waves of 3 instead.
Even this interpreetation can go into more detail with the clear internal waves but I have decided to keep it as simplified as possible.
60Mins
4Hours
Daily
Weekly
All the best for everyone and please do not hesitate to contact me if you have any questions or comments.
Andres
info@tradingwaves.org


 Trading Waves .org