Tue 29-10-2019
Hi everyone, hope you are all ok.
Let's get into it...
USDJPY
USDJPY; The 4Hour Chart remains little changed ans, as per current count, is showing that Wave (b) of Wave [ii] could be about complete in the form of a Zig Zig correction (5,3,5) towards the lower trend line (blue).
Although there is a real posibility that the alternate count marked as small Wave [ii] to have completed already at between %23 and %38 retracement level; In which case the current rally would be Wave [iii] to have already started its way towards the upper trend line (blue).
The 60Min Chart, as per current count, is showing the last leg of Wave (b) of Waved [ii] completed within a Zig Zag Correction.
Hence, next we should expect the price to keep droping again in the form of 5 Waves for Wave (c) to complete Wave [ii].
60Mins
4Hours
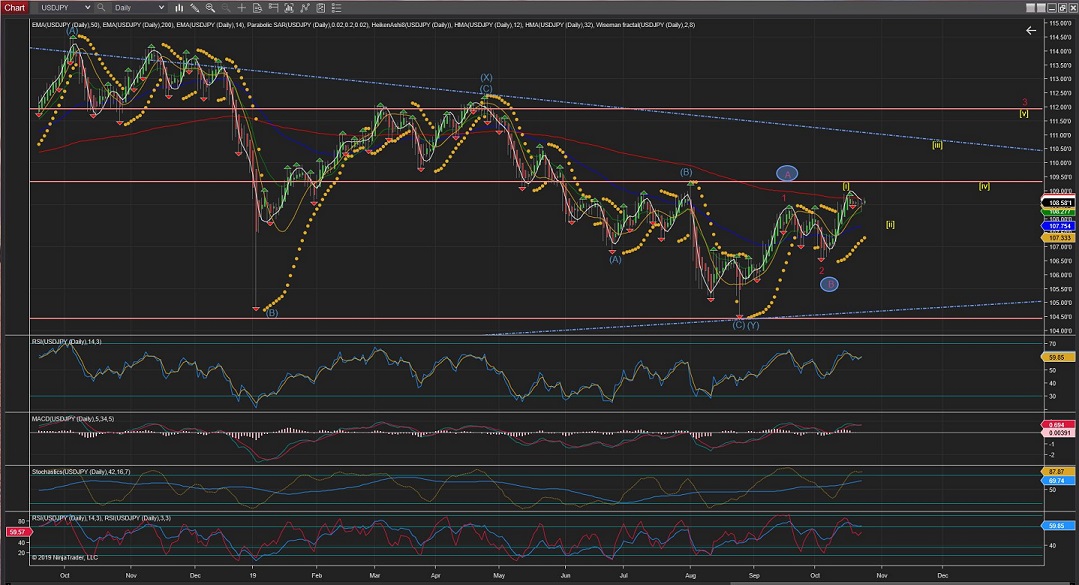
Daily
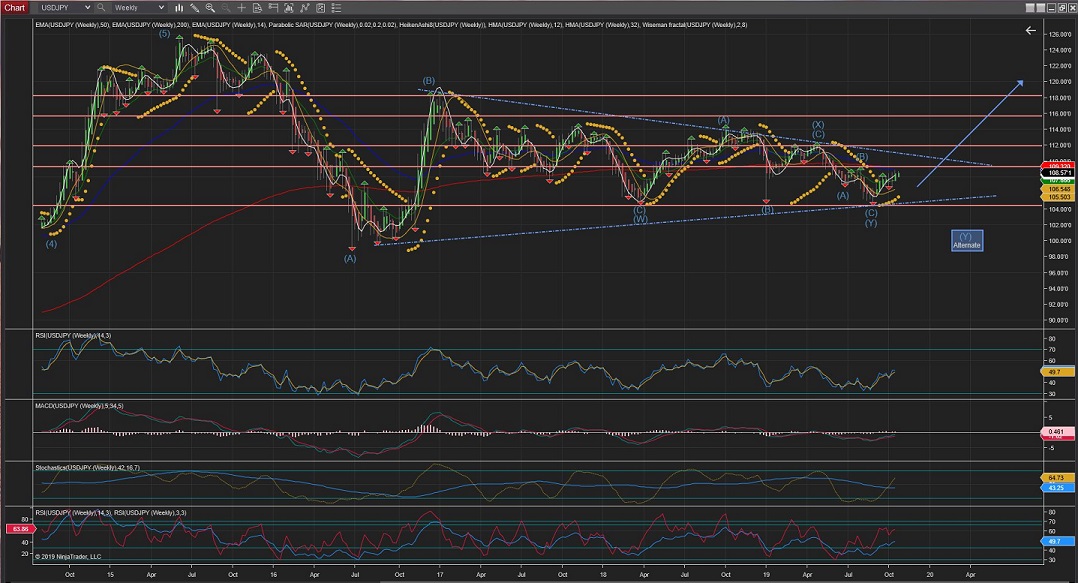
Weekly
EURUSD
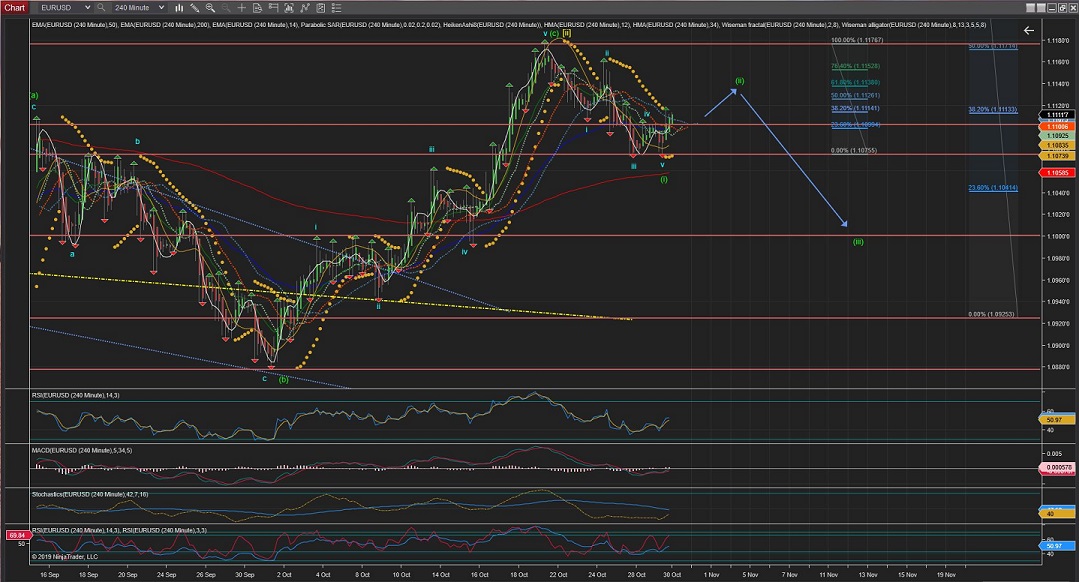
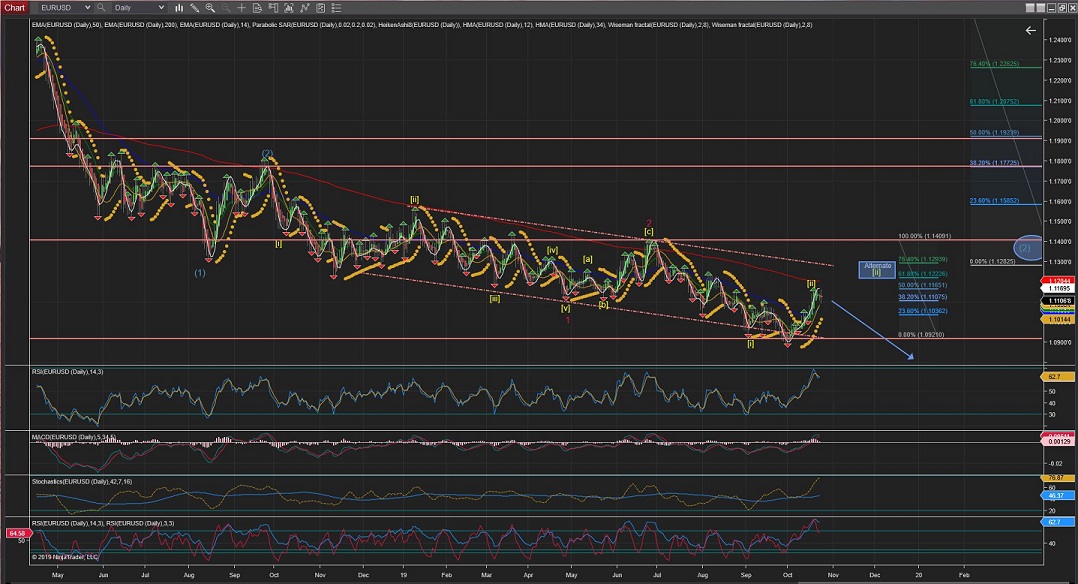
EURUSD 4Hour Chart is showing that felt shy of completing Wave (i) at the 200EMA and it is now developing Wave (ii) correction.
Once Wave (ii) completes we shall see Wave (iii) to carry the price lower, breaking through that 200EMA level.
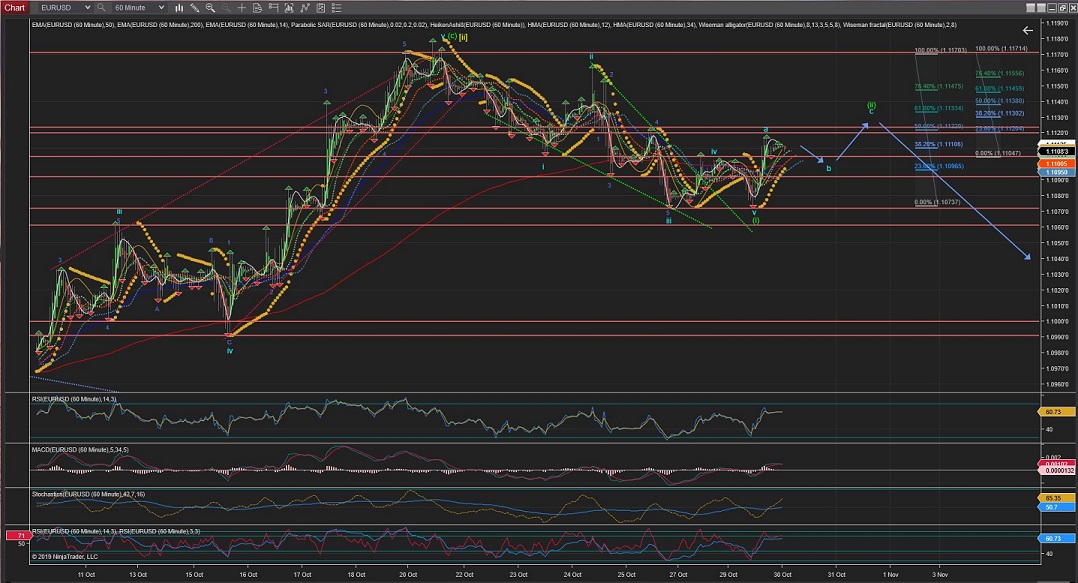
The 60Min Chart is showing that the internal Wave a of current Wave (ii) might have completed with a nice rally today.
Next, we should see Wave b to clarify the type of correction that Wave (ii) is developing, as it seems to early to forecast yet.
In any case, once we can determine the correction type we should be able to calculate the most likely retracement level for an early entry to the Wave (iii)... which would be confirmed once the price breaks through the lowest of Wave (i) at 1.1073.
60Mins
4Hours
Daily
GBPUSD
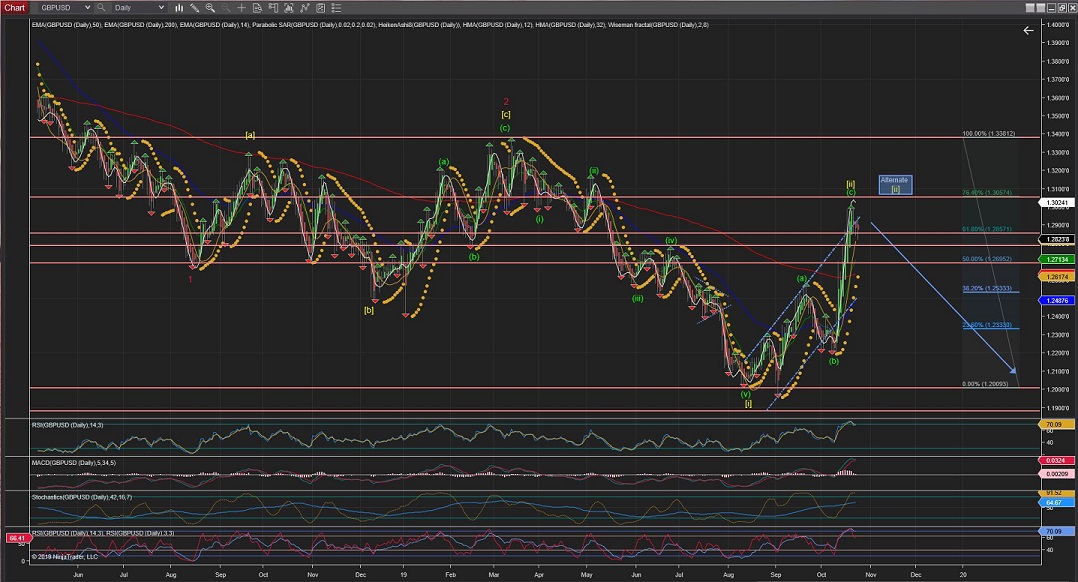
GBPUSD has moved little today in the current correction and I have marked another Alternate within the current internal count of Wave (i) as a larger Wave i, which would mean that the current count is still Wave ii (more visible in the 60Min Chart).
(The other Alternate count marked is for an extended Wave [ii] correction reaching the %76 retracement level or slightly higher).
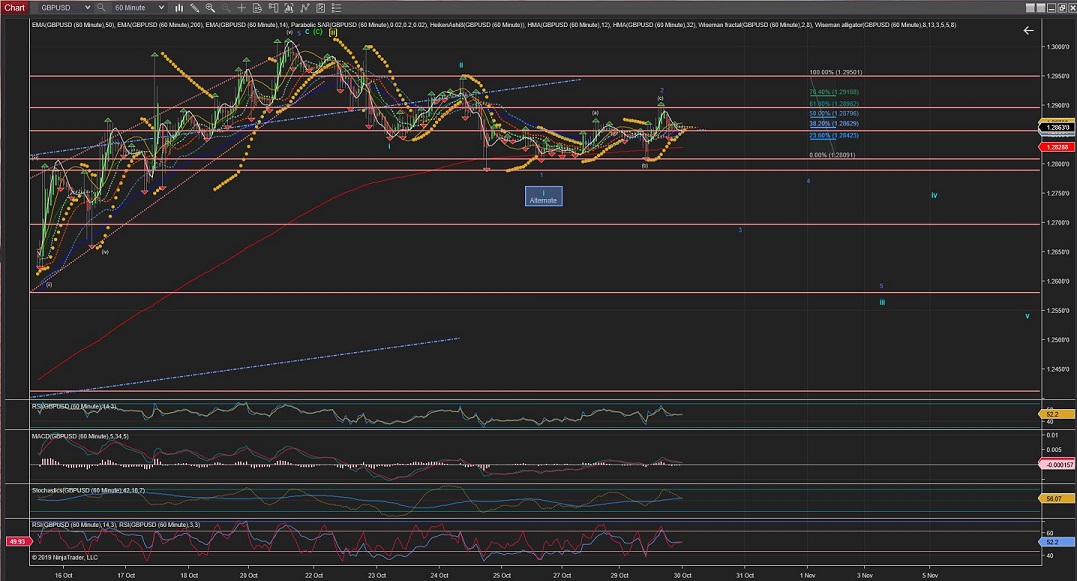
The 60Min Chart is showing that, as per current count, Wave 2 (blue) should now be complete at little above %62 retracement of Wave 1 (blue).
Tomorrow's price action would determine whether the alternatre count for a more extended Wave i is more of a valid count (if the price keeps raising) or if the current count remains valid, if the price brings impulsive waves down again for a continuation of Wave 3 of Wave iii.
60Mins
4Hours
Daily
I have now introduced the analysis of CADJPY as I found that has some interesting Elliot Waves patterns;
CADJPY
CADJPY Weekly Chart shows 5 clear waves to the downside (2008-2009) and a correction that might have completed in 2015.
Which brought the price back down since then until 2017 (unless the correction is still being extended, as marked in the Alternate counts).
The whole count to today has formed a downwards triangle that also suggest that the price could breakout lower, continuing the mayor trend.
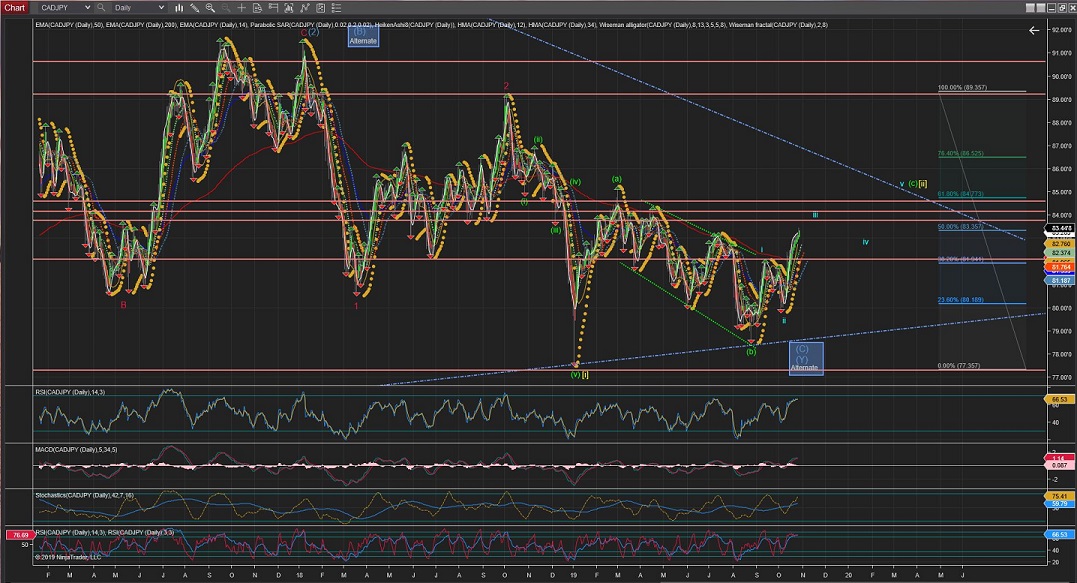
CADJPY Daily Chart shows that the price is targetting the upper triangule trend line in Wave (c) of Wave [ii].
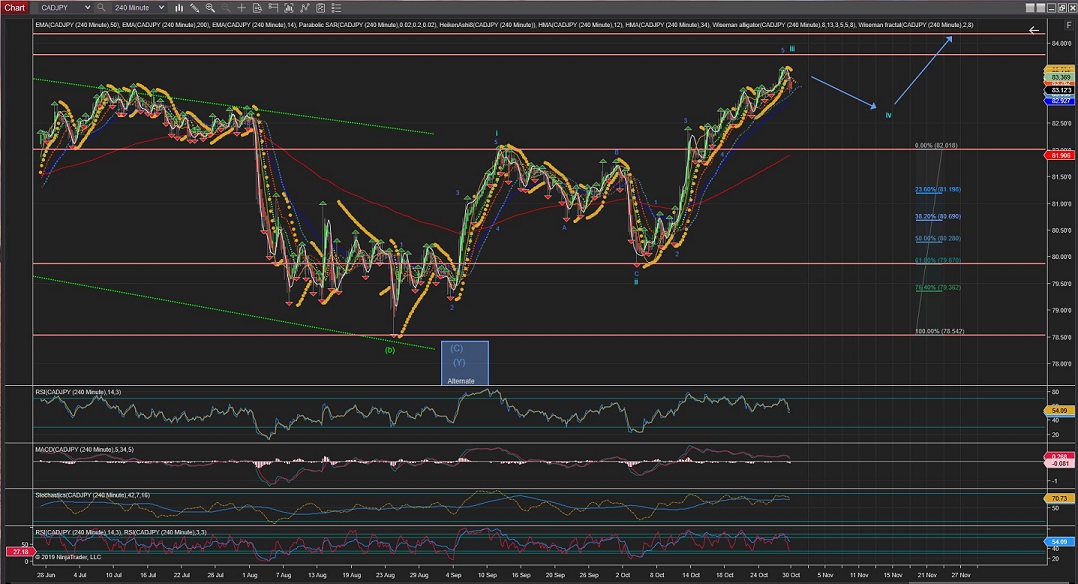
CADJPY 4Hour Chart is showing Wave iii could have just completed, which would bring the price into corrective price action for Wave iv, potentially towards the 200EMA and previous lower degree Wave 4.
CADJPY 60Min Chart is showing that the price broke out of an ascending wedge on what seems the start of Wave iv correction.
60Mins
4Hours
Daily
Weekly
All the best for everyone and please do not hesitate to contact me if you have any questions or comments.
Andres
info@tradingwaves.org


 Trading Waves .org