Thu 24-10-2019
Hi everyone, hope you are all ok.
Let's get into it...
USDJPY
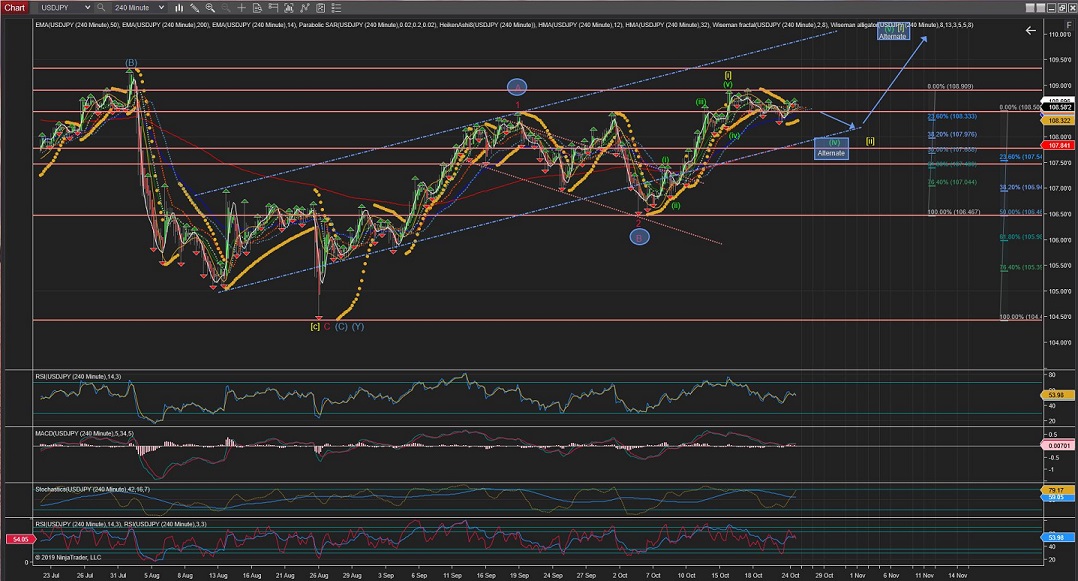
USDJPY; The 4Hour Chart is showing Wave [ii] underway in the form of a Zig Zig correction (5,3,5) towards the lower trend line (blue) to what could become a Head and Shoulders formation.
Once Wave [ii] completes, Wave [iii] should start showing impulsive waves up again.
The 60Min Chart is showing Wave (b) correction underway within this Wave [ii] Zig Zag Correction.
Once Wave (b) completes we should expect the price to drop again in the form of 5 Waves for Wave (c).
60Mins
4Hours
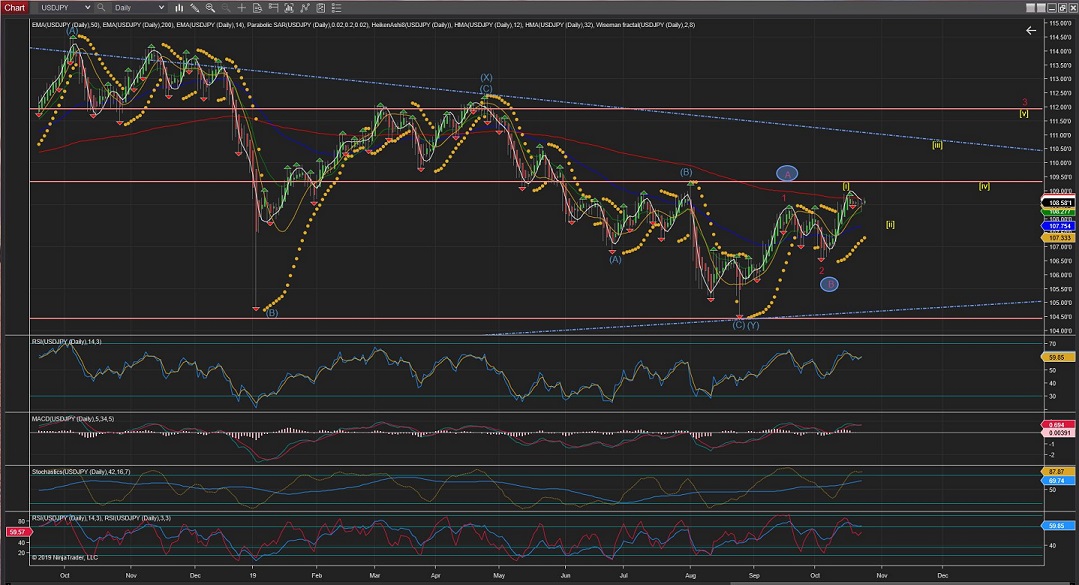
Daily
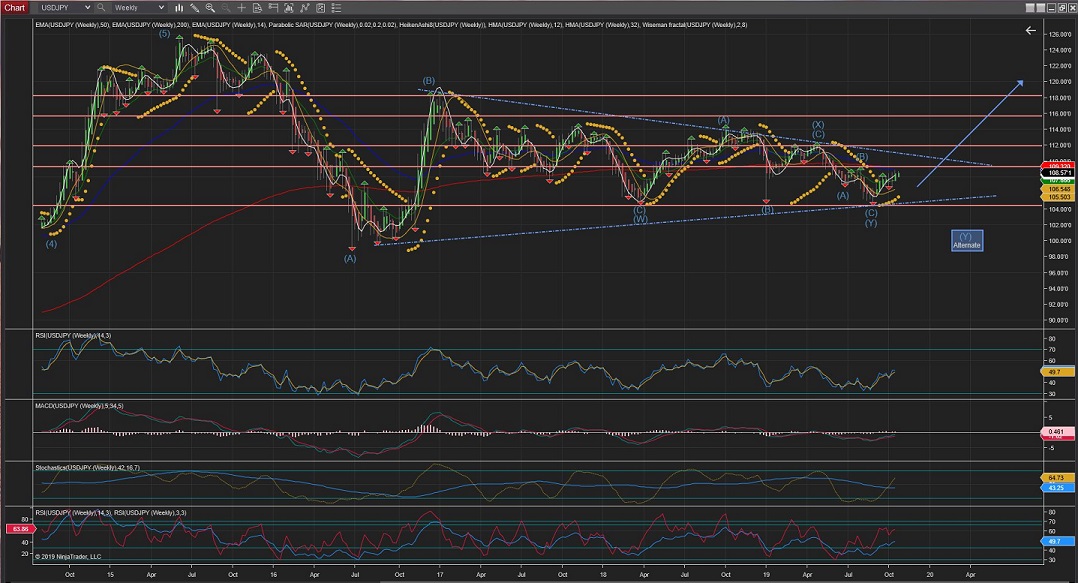
Weekly
EURUSD
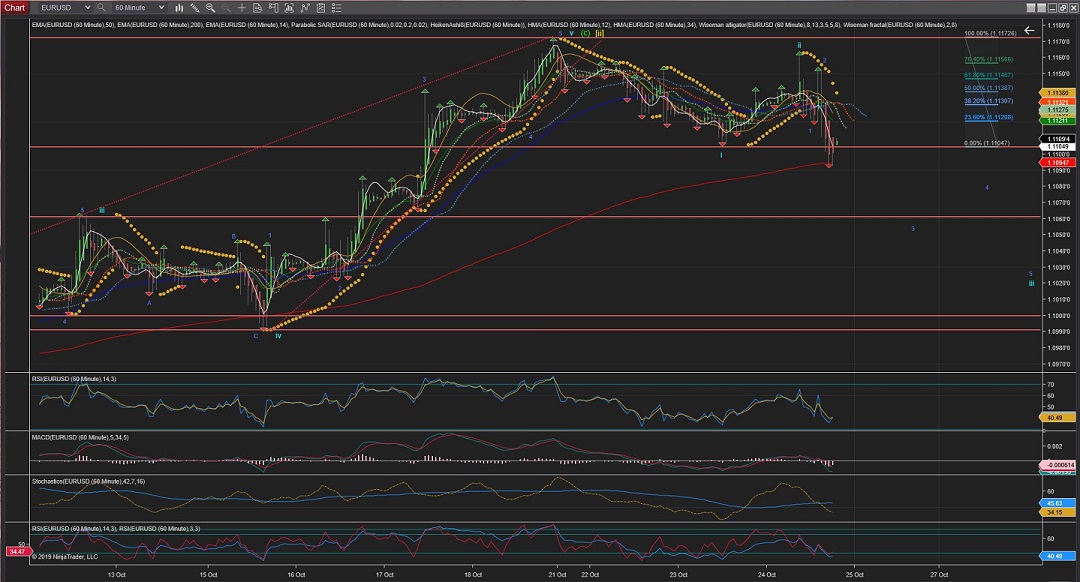
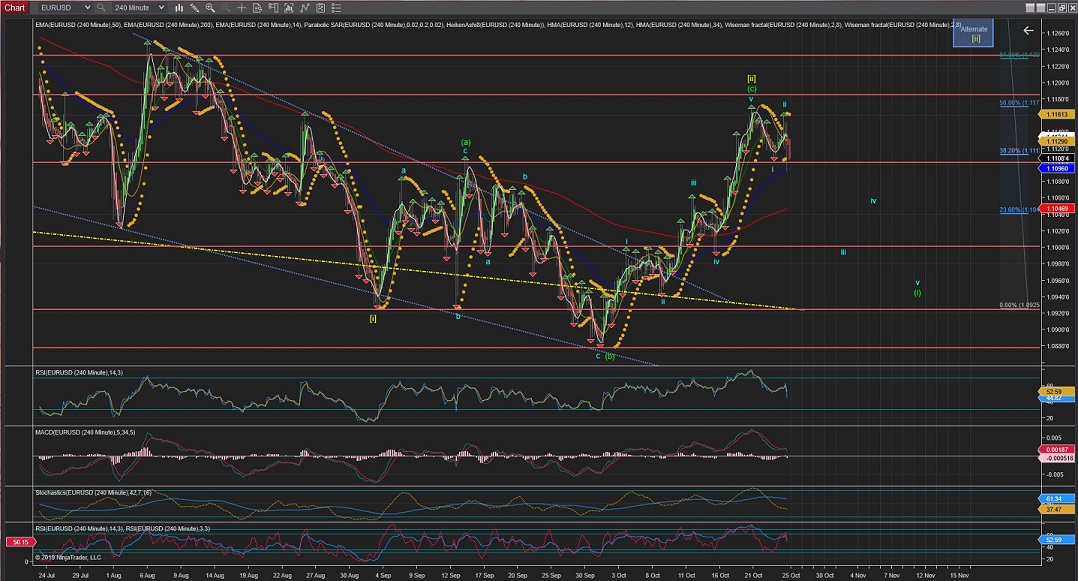
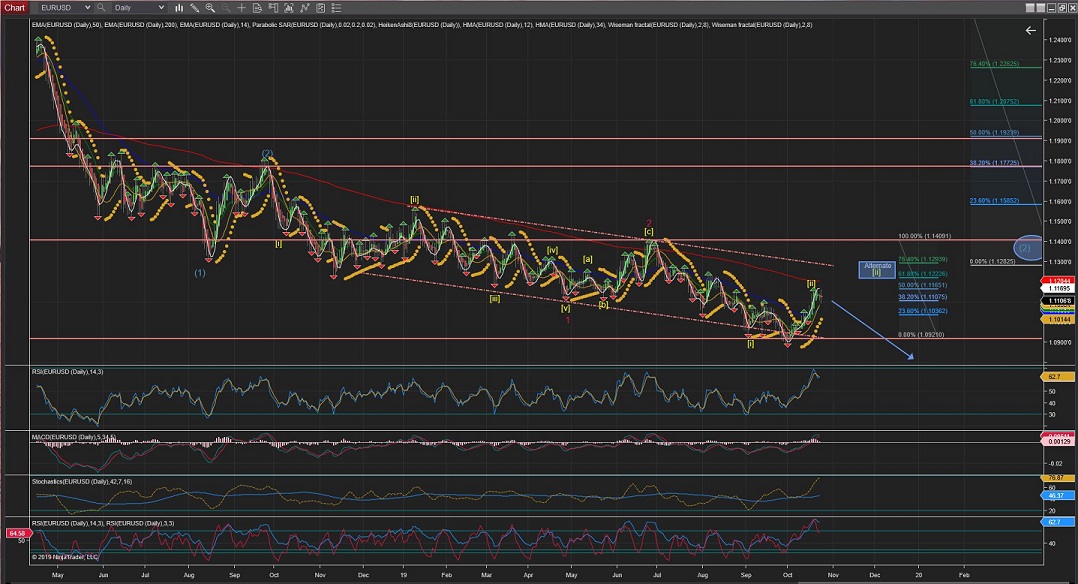
EURUSD seemed to have completed Wave [ii] at exactly %50 retracement of Wave [i] and now moving down impulsively in Wave iii of the initial Wave (i) of Wave [iii].
The 60Min Chart is showing Wave i completed with 5 clear internal waves and Wave ii also showing 3 clear waves.
Now Waves 1 and 2 of Wave iii also completed and Wave 3 should break through the 1.1107 barrier bringing the price much lower to what could be a Head and Shoulders formation on the 60Min Chart.
60Mins
4Hours
Daily
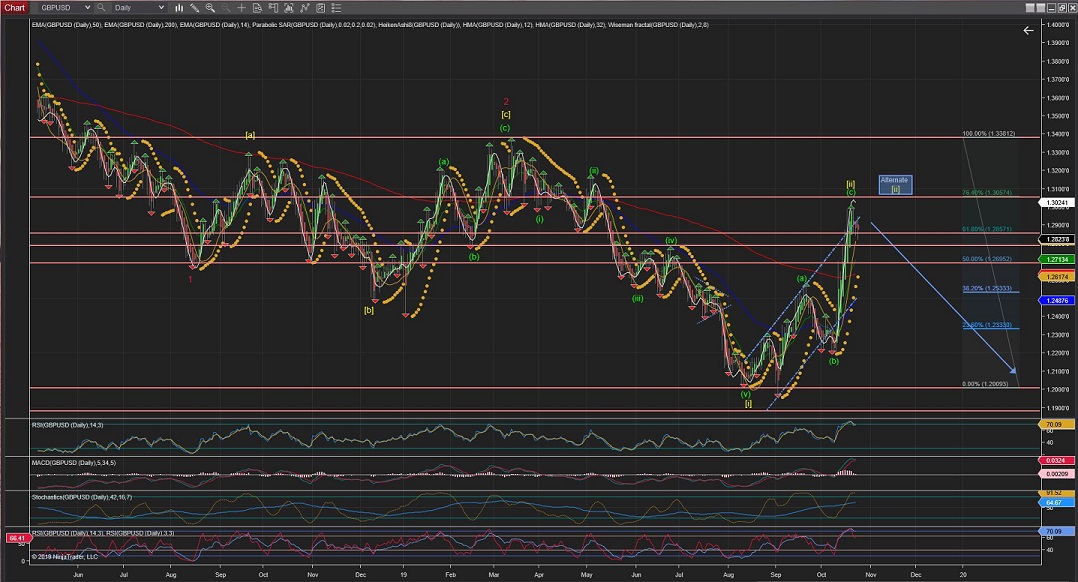
GBPUSD
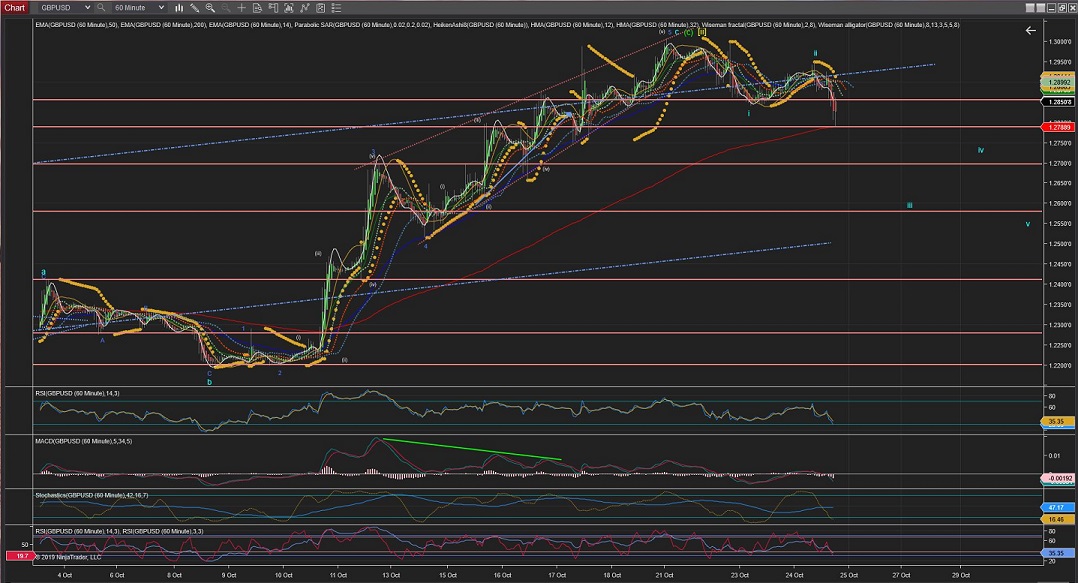
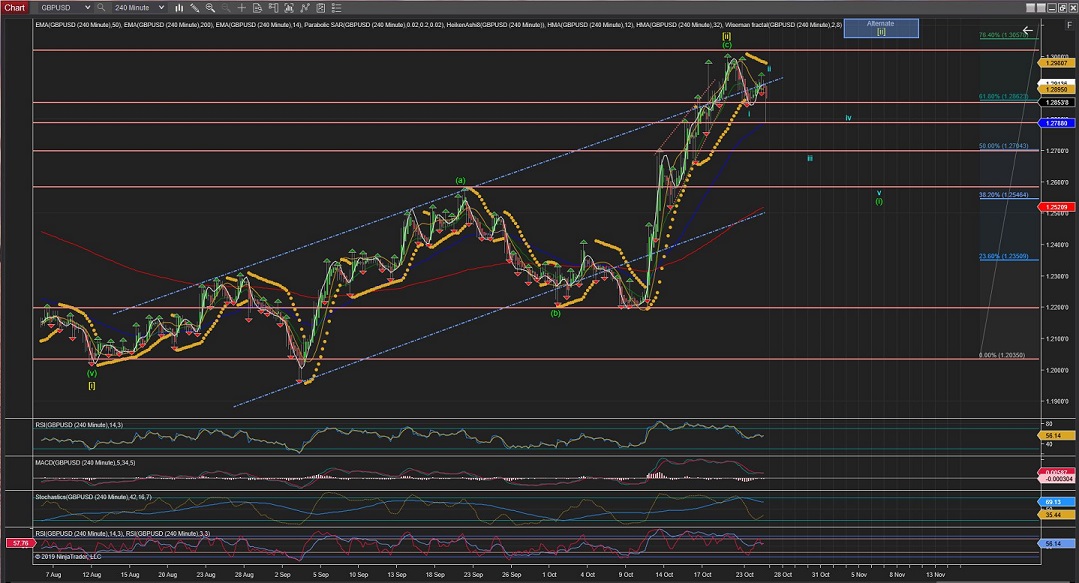
GBPUSD has a very similar shape as EURUSD and has also completed Wave [ii], although at almost %76 retracement of Wave [i] instead. With Wave iii of Wave [iii] possibly on the way.
(The Alternate count marked is for an extended Wave [ii] correction reaching the %76 retracement level).
The 60Min chart is showing 5 clear waves completed for Wave (c) of Wave [ii] and, much like EURUSD too, Waves i and ii have clear defined internal Waves, suggesting that Wave iii of Wave (i) of Wave [iii] is now on the run.
60Mins
4Hours
Daily
All the best for everyone and please do not hesitate to contact me if you have any questions or comments.
Andres
info@tradingwaves.org

 Trading Waves .org