Wed 09-10-2019
Hi everyone, hope you are all ok.
Let's get into it...
USDJPY
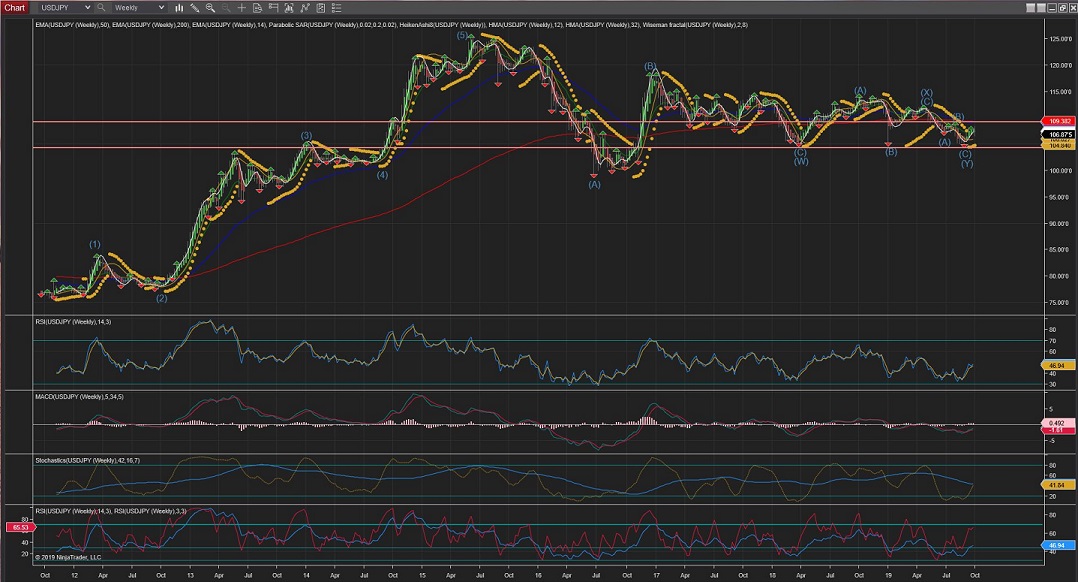
USDJPY is now back within the long term trend (blue) which puts more weight into the current count (for Wave C (red) continuing upwards), rather than the alternate count for an extended Wave B (red) making a Head & Shoulders formation.
Both cards still on the table and the reaction to this trend line (blue) could be decisive.
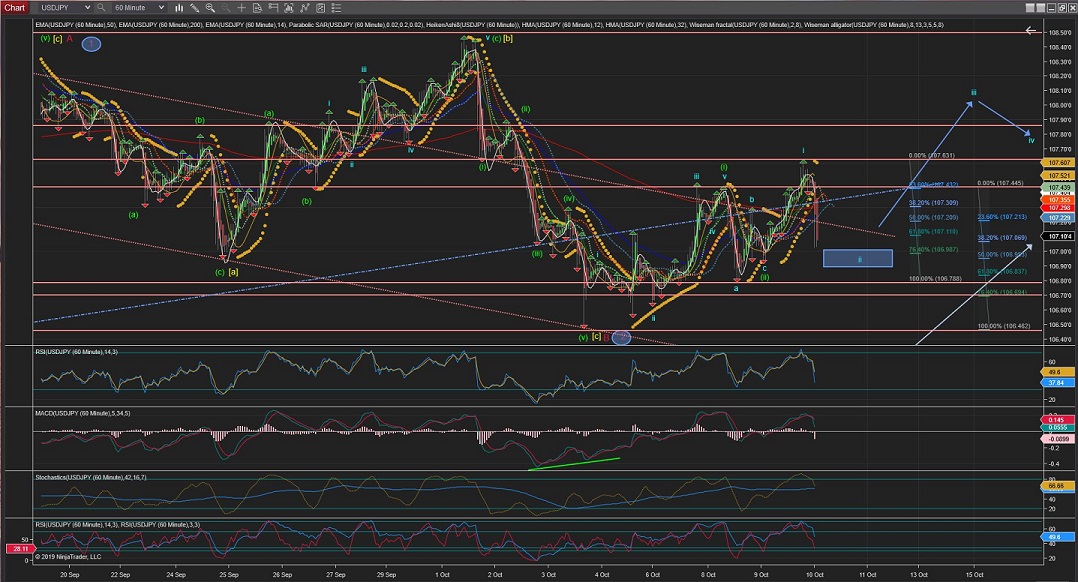
The current count in the 60Min Chart still stands for a completed Wave (i) and now a completed Wave (ii) with a clear flat correction.
And, if this count is correct, Wave i of Wave (iii) is now completed and, once the next correction for Wave ii is completed, Wave iii should take the price higher impulsively again.
Tomorrow's action should see the price to remain above 106.78 (the start of Wave i) while Wave ii is underway, and if the price continues to drop below that point, the alternate count would be trigered for an extended Wave [c] (yellow) (see 60Min Chart).
60Mins
4Hours
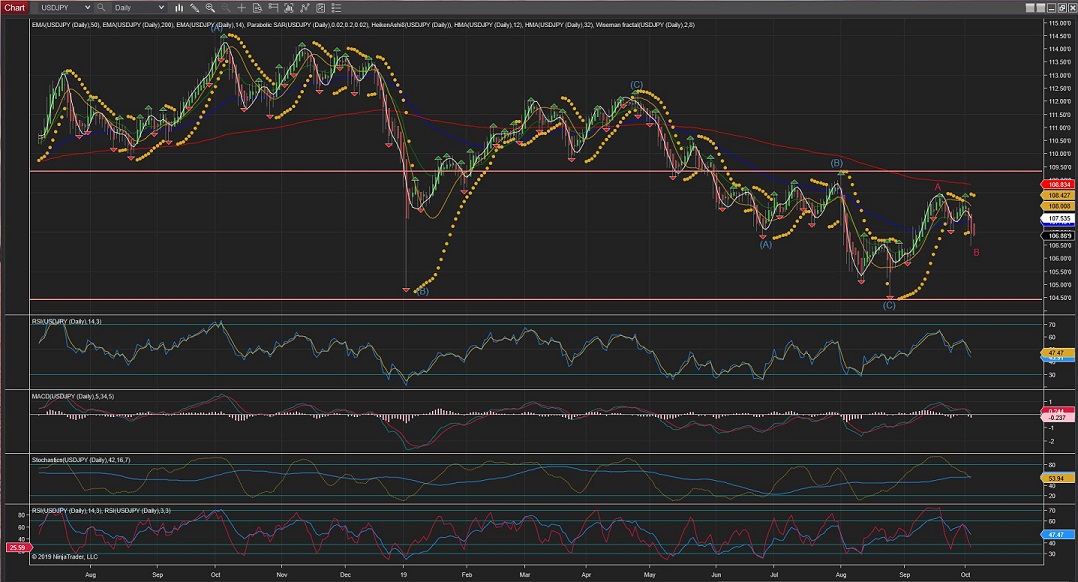
Daily
Weekly
EURUSD
EURUSD is stalled between the top trend line (blue) and the longer term lower trend line (yellow) (4Hour Chart) within this Wave [ii], as per current count (see also Daily Chart).
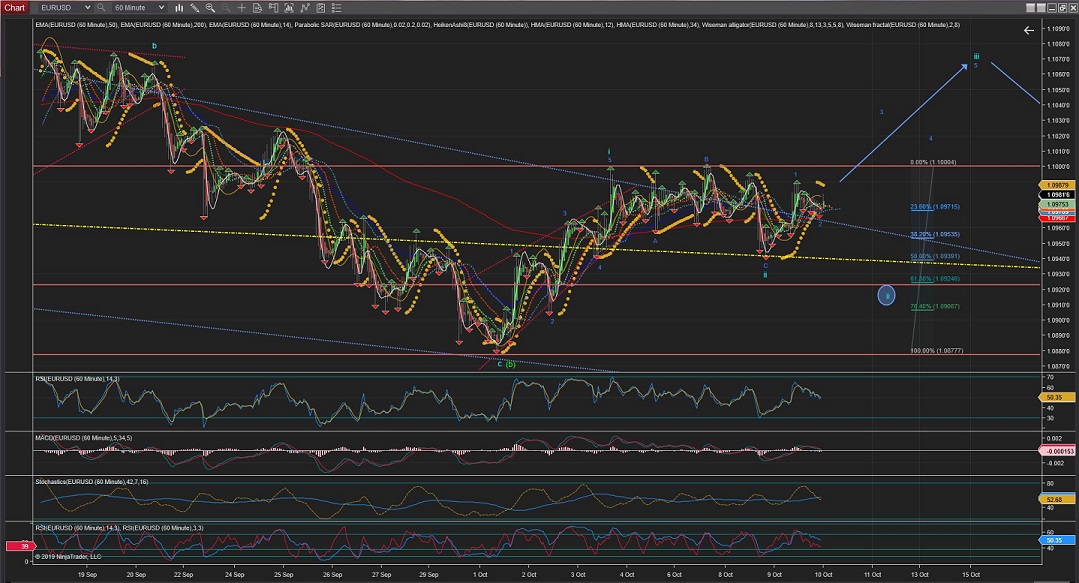
The 60Min Chart is showing 3 waves completed for Wave ii in an expanded flat correction, with its lowest at the %50 retracement.
I have circuled the alternate count for an extension of Wave ii towards the next level of Support at the %62 retracement level.
And, if the price moves impulsivelly up again, crossing the highest of Wave i at 1.1000, it will be a clear indication that Wave iii is underway.
(Moves lower than 1.0880 at the 0 retracement would trigger the alternate 4Hour Chart Wave [ii] count)
60Mins
4Hours
Daily
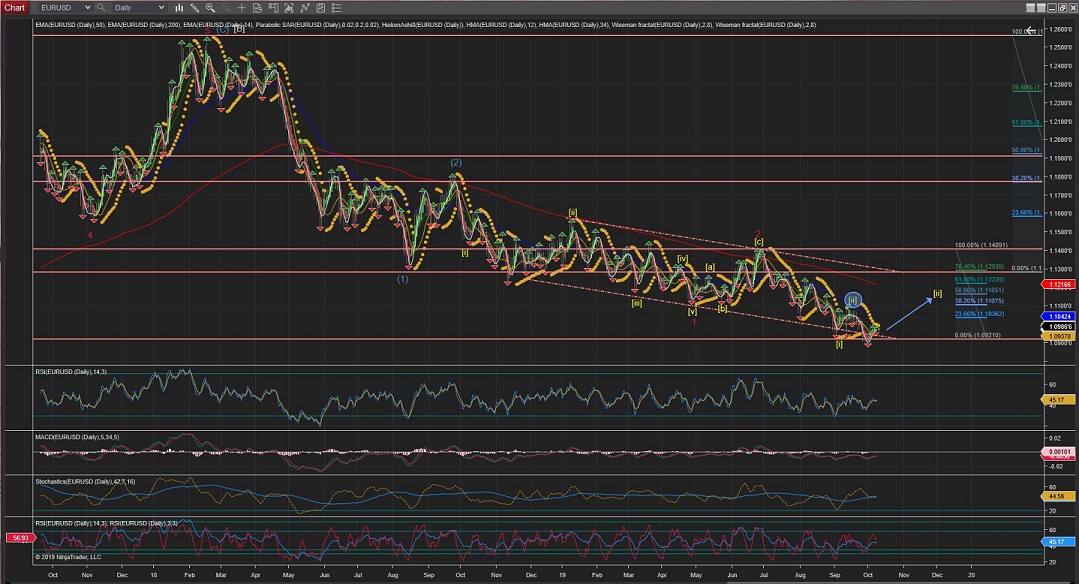
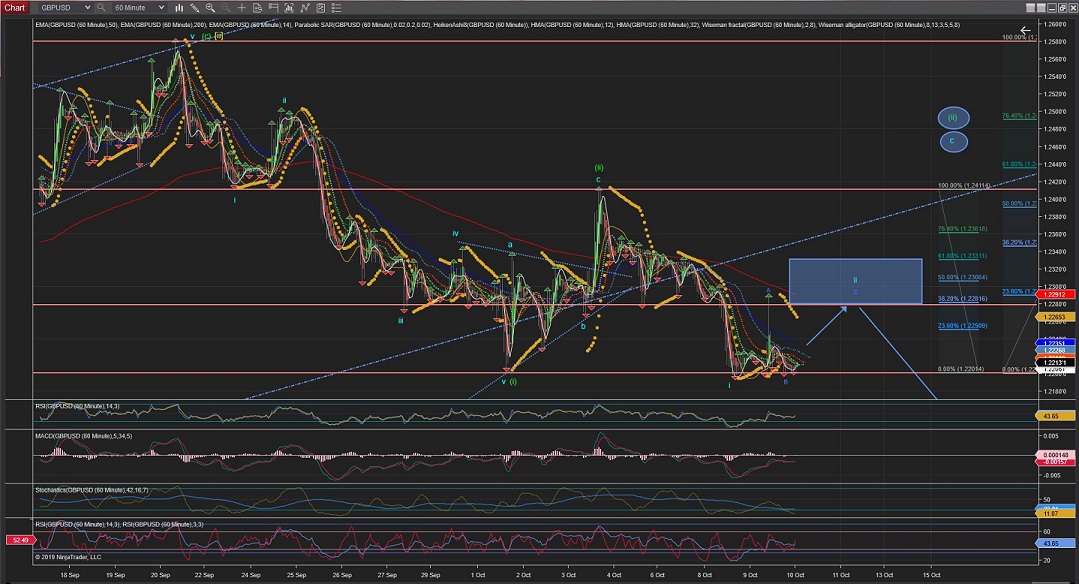
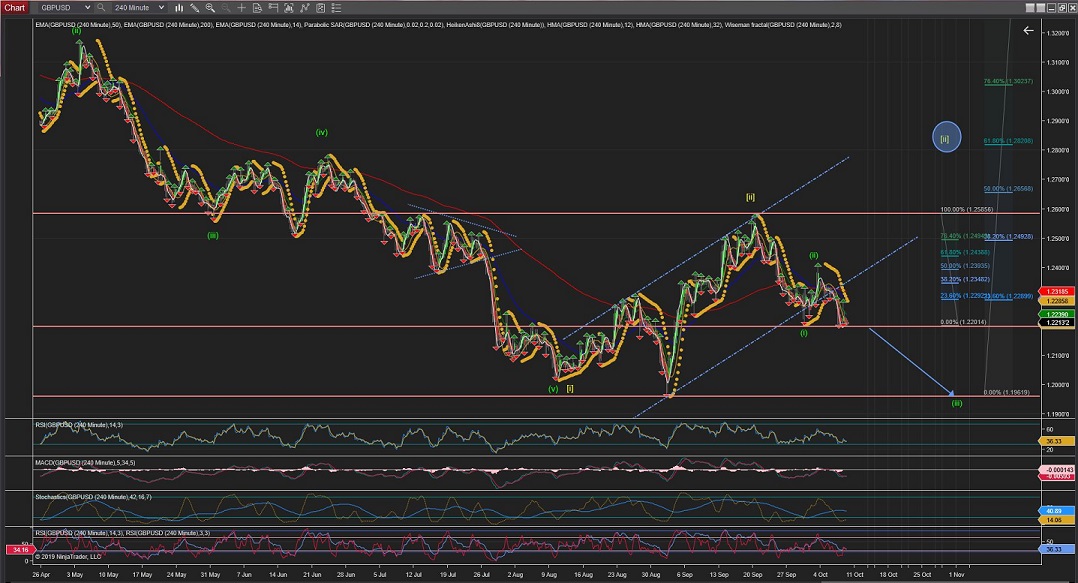
GBPUSD
GBPUSD 4Hour Chart is showing that the current trend has been broken to what appears now Wave (iii) of Wave [iii] (confirmed once the price crosses the lowest of Wave (i) at 1.2200).
Although most unlikely now, there is an alternate count for a possible further raise in a continuing Wave [ii] correction towards the %61 retracement.
The 60Min Chart is showing a rather odd impulsive Wave i of Wave (iii) completed Wave ii correction to have completed its internal Waves A and B. And it is possible that the price could now be moving up in the last Wave C of the correction towards the %38 to %62 retracementg levels (the 1.2300 price area).
Once Wave ii correction is completed we should expect the impulsive moves to the downside to continue for Wave iii of Wave (iii) of Wave [iii]... so the move should be important !!
60Mins
4Hours
Daily
All the best for everyone and please do not hesitate to contact me if you have any questions or comments.
Andres
info@tradingwaves.org


 Trading Waves .org