Fri 04-10-2019
Hi everyone, hope you are all ok.
Let's get into it...
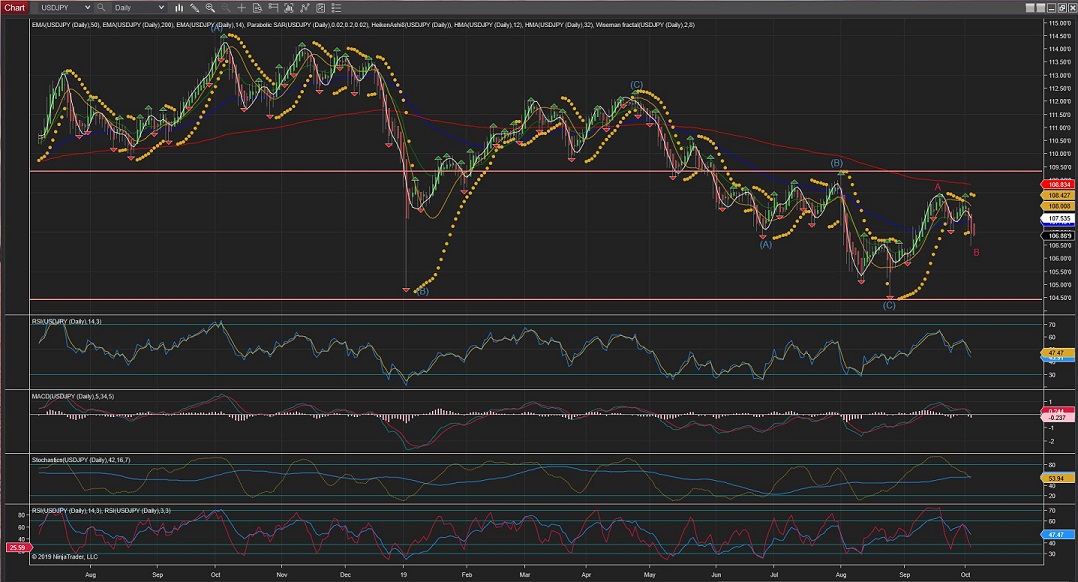
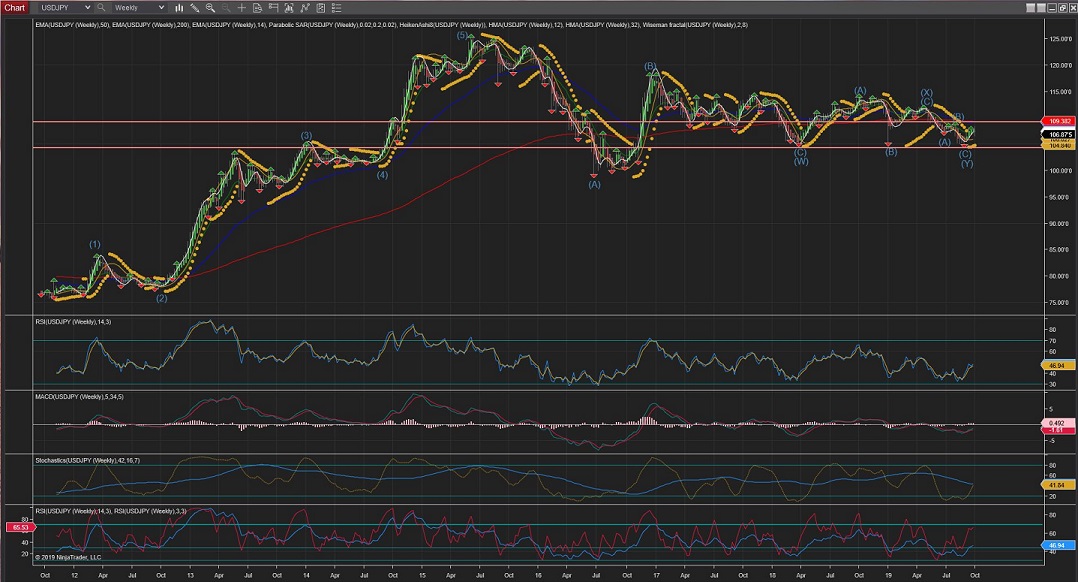
USDJPY
USDJPY is showing to be bouncing off the small trend line (red-dotted) in the 4Hour Chart.
Looking at the 60Min Chart that bounce should be the initial Waves i and ii of the first Wave (i) up.
The alternate count is showing the posibility of an extended move down for Wave (v) (see alternate counts circled in the Chart/s).
60Mins
4Hours
Daily
Weekly
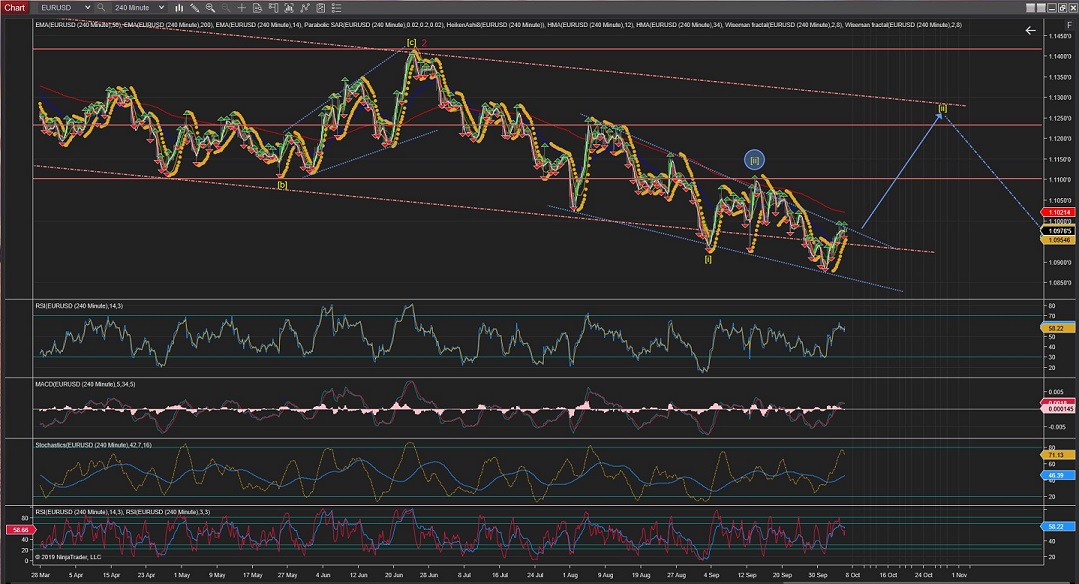
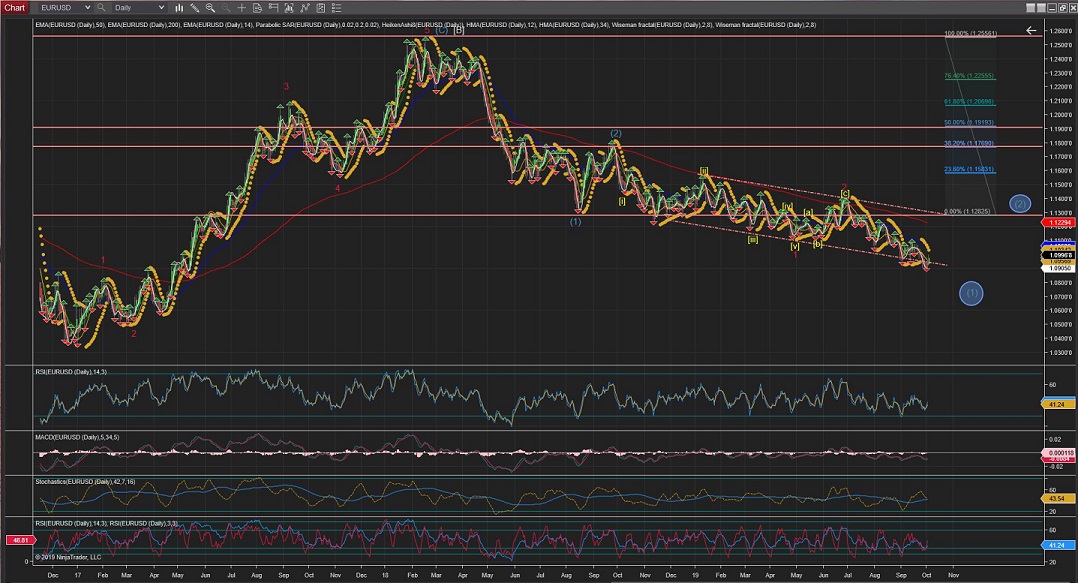
EURUSD
EURUSD is still raising (by looking at the 4Hour Chart), while developing corrective Wave [ii].
Looking at the 60Min Chart, it shows Wave i of Wave (c) to have been completed and Wave ii possibly completed.
Next, I am expecting Wave ii to complete within the %50 retracement and the price to continue its way up through Wave iii.
60Mins
4Hours
Daily
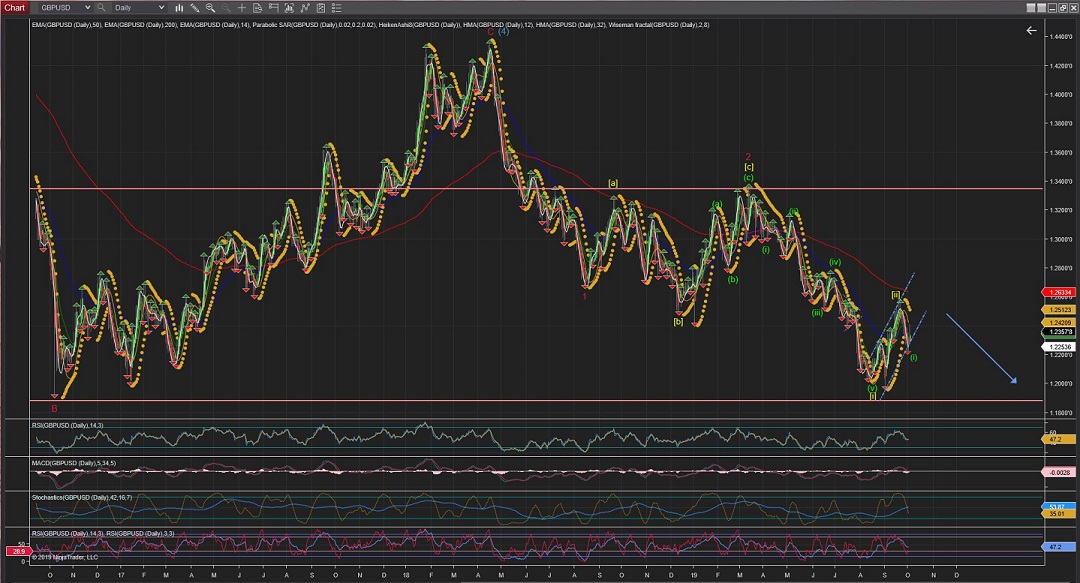
GBPUSD
GBPUSD is showing the initial Wave (i) of Wave [iii] might have started; Leaving Wave [ii] completed at between %38 and %50 retracement of Wave [i].
Although there is an alternate count for a possible further raise in a continuing Wave [ii] correction towards the %61 retracement.
As it stands now, a closer look into the 60Min Chart is showing that Wave ii might also have finished; And further action next session would decide whether this impulse down is the beginning of Wave (iii) down or a continuation of Wave (ii), which in the last case would suggest further raise towards the 1.2450 area at around the %62 retracement area.
60Mins
4Hours
Daily
All the best for everyone and please do contact me with any question or comments and, if it is the case, will come back with a reply.
Andres
info@tradingwaves.org


 Trading Waves .org